INTRODUCTION
Common coral trout Plectropomus leopardus are epinephiline serranids (i.e. groupers) that form the basis of the commercial and recreational reef line fishery on the Great Barrier Reef (Russ 1991), and comprise 35−55% of the commercial catch, 20−25% of the charter catch and 15−20% of the recreational catch (Mapstone et al. 2004). In Queensland, Australia, alone, the P. leopardus fishery generates approxi -mately $35 million (AUD) in gross annual revenue
(Queensland Government 2011). However, previous studies have revealed evidence of population decline of this economically valuable species (Fulton et al. 1999, Morris et al. 2000, Graham et al. 2003, Little et al. 2005), and P. leopardusare now classified by the IUCN as Near Threatened (Cornish & Kiwi 2004).
Declines in Plectropomus leopardus populations have been attributed to life history patterns of the species (Bohnsack 1982, Russ 1991), specifically their tendency to form reproductive aggregations (Thresher 1984), which make them vulnerable to
© Inter-Research 2014 · www.int-res.com *Corresponding author: [email protected]
Movement, habitat utilization and behaviour of
coral trout
Plectropomus leopardus
during and
after the reproductive period on the southern
Great Barrier Reef
C. M. Bunt
1,*, M. J. Kingsford
21Biotactic Fish and Wildlife Research (Biotactic, Inc) 691 Hidden Valley Road, Kitchener, Ontario N2C 2S4, Canada 2School of Marine and Tropical Biology and ARC Centre of Excellence for Coral Reef Studies, James Cook University,
Townsville QLD 4811, Australia
ABSTRACT: Coral trout Plectropomus leopardus(mean total length = 498.9 ± 19.7 mm, n = 10) were tagged and tracked with ultrasonic transmitters over 81 d at an intra-lagoonal location at One Tree Island, Great Barrier Reef, Australia (23.4979° S, 152.0712° E). Movement and habitat preferences were compared during the transition between the reproductive and post-reproductive period. Overall, mean movement was highest between 05:00 and 10:00 h, with the most move-ment during the crepuscular period and the least movemove-ment at night. There was no difference in nighttime movement during or after the reproductive period. Mean daily movement (14.48 ± 0.26 km d−1) and fish depths (4.23 ± 0.02 m) during the post-reproductive period were significantly greater than both movement (10.63 ± 0.13 km d−1) and depths occupied (3.38 ± 0.01 m) during the reproductive period, which was likely related to reallocation of bioenergetic resources to foraging related activities rather than spawning. Most fish movement was localized (within 0.04 km2), with some movements recorded outside of this area to a maximum distance of 0.6 km. Fish traversed sand and small scattered coral out-croppings to reach areas of continuous reef. The ranges of movement and habitat preferences described in this study are important for future research on habitat requirements and behavioural changes across the transition period between reproductive and post-reproductive states. Furthermore, this study provides additional information that may be used for focusing and delineating species-specific Marine Protected Area management plans.
KEY WORDS: Plectropomus leopardus· Serranidae · Movement · Habitat preference · Habitat requirements · Ultrasonic telemetry · Marine Protected Area
Resale or republication not permitted without written consent of the publisher
overfishing (Samoilys 1997a). In the last 20 yr, the establishment of marine reserves in known P. leop-ardus aggregation locations has been identified as the most viable strategy for sustainable manage-ment of this species (DeMartini 1993, Rowley 1994, Russ & Alcala 1996a,b). Management programs designed to protect specific P. leopardus reproduc-tion aggregareproduc-tion areas are more likely to succeed as additional information on reproductive behaviour, movement and habitat requirements becomes avail-able (Zeller 1996, 1997, 1998, Samoilys 1997a,b, Zeller & Russ 1998).
In addition to fisheries-related economic implica-tions, the sustainability of Plectropomus leopardus populations has ecological ramifications. This species feeds on fishes and invertebrates (Choat 1968, Kings-ford 1992, St. John et al. 2001), and thereby influ-ences mortality rates and population dynamics of other pre dators and their prey (Hixon 1991, Connell & Kingsford 1998, Mclean et al. 2011). Data on spatial and temporal scales of movement as well as habitat se lection and habitat preferences of these higher-order predators are important for reef fisheries man-agement and the maintenance of viable P. leopardus populations, and have implications for the balance of the entire reef ecosystem (Sluka et al. 1994, Cecca-relli & Ayling 2010).
Previous studies on Plectropomus leopardusspatial utilization have focused on counting individuals in aggregations, mapping aggregation sites (Aguilar-Perera & Aguilar-Dávil 1996, Samoilys 1997a) and enumerating intra-reef patterns of abundance (Con-nell & Kingsford 1998, Kingsford 2009). Habitat preferences and movement patterns during the repro -ductive and post-repro-ductive transition at aggrega-tion sites are largely unknown.
Ultrasonic telemetry has been used with Plectropo-mus leopardus to determine the movement within home ranges (Zeller 1997), spawning aggregations (Zeller 1998) and across boundaries of Marine Pro-tected Areas (MPAs) (Zeller & Russ 1998). However, data from these studies were not stratified to allow movement comparisons during reproductive and post-reproductive periods. Therefore, the purpose of this project was to enhance and build on previously acquired information by providing detailed data to: (1) characterize diel movement patterns (in 3 dimen-sions) of P. leopardusinto and out of an ag gregation site during the reproductive (November− December) and post-reproductive periods (January− February); and (2) evaluate diel habitat utilization patterns and habitat preferences during the reproductive and post-reproductive periods.
MATERIALS AND METHODS
Study site and sampling design
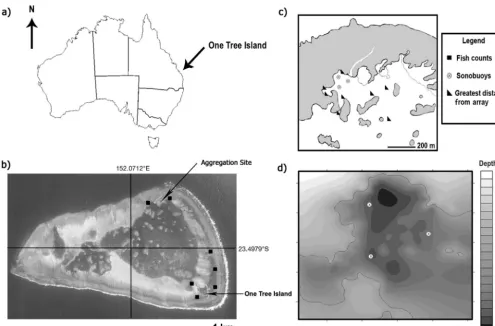
Plectropomus leopardus were collected, tagged and tracked at One Tree Island (OTI), southern Great Barrier Reef, Australia (23.4979° S, 152.0712° E; Fig. 1a). The tracking location was based on long-term SCUBA observations over 13 yr that identified an area with a pre-existing and presumably spawn-ing-related aggregation site. Fish were monitored over 81 d from 13 November 2001 to 4 February 2002, spanning the typical reproductive (November− December) and post-reproductive (January−February) periods at OTI (M.J.K., pers. obs.). These periods are estimates based on definitions of reproductive period -icity by Domeier & Colin (1997) because the begin-ning and ending dates of spawbegin-ning are usually not known for certain. However, there was distinct evidence that fish were in a reproductive state at the beginning of the study. This evidence included: unusual aggregation behaviour of mature fish (see Pet et al. 2005) during a time of the year when spawning of this species is known to occur; swollen gonads in females; and males that expressed milt on Analytical groups in this study did not contain fish from both reproductive states, and no data were included in the analyses from 18 December 2001 to 11 January 2002. This unintended but surreptitious buffer was the result of technical difficulties with the tracking system during a period when researchers were away from OTI. We euthanised one of the tagged fish (4591) on 18 January 2002 and there were no ga metes present internally, suggesting that spawning was complete. It is unlikely that this was an im mature fish, based on behavioural comparisons with other similarly sized mature fish in the spawn-ing aggregation in No vember/December.
Fish tagging and tracking
interrupted braided silk sutures. Tagged fish were placed in flow-through pens for a recovery period of 3 to 6 h, and were then released near the site of original capture. Fish tracking was conducted with a radio-linked acoustic positioning sonobuoy array (VRAP System, Vemco) 1.5 km north west of the OTI research station. Tracking system function and trian-gulation of transmitters is described in O’Dor et al. (2001). According to the manufacturer and verified with pre-study tests, locations were accurate to within 1 m (x, y dimensions) and depth data were accurate to within 0.2 m when transmitters were not hidden behind coral. During collection of VRAP data, telemetry data from areas outside the array were also recorded by boat using mobile VEMCO VR-60 receivers and a towed hydro phone. On occasion we used an underwater pinger locator (VEMCO VR-96) to track fish within the aggregation site with SCUBA. Plectropomus leopardus were also counted with SCUBA at the aggregation site and at 6 other sites along the lagoon edge to determine how
representa-tive the tagging site was (Kingsford 1992, 2009). Sites were separated by 0.3 to 5 km along the edge of the lagoon (Fig. 1b). At each site, fish were counted in 5 transects, each mea suring 5 × 25 m. This sampling design was re peated January−February each year from 1995 to 2007.
Movement and depths
All fish were simultaneously tracked within a 0.04 km2 area within the OTI lagoon. Distances (m) between successive timestamped locations were cal -culated from filtered telemetry data. Approximately 1% of movement data appeared to be related to sig-nal bounces and erroneous reception based on visual examination of temporal and spatial aspects of the telemetry data. These data points were removed accordingly to minimize overestimates of movement. Plectropomus leopardus movement data were ana-lyzed within and among 4 daily time periods (early Fig. 1. (a) The approximate location of One Tree Island (OTI) on the Southern Great Barrier Reef. (b) OTI lagoon (14 km2),
showing the aggregation site and fish count locations. (c) Aggregation area, with approximate positions of VRAP sonobuoys used to track Plectropomus leopardusand maximum distances fish moved from the array. (d) Enlargement of the aggregation
[image:3.612.50.545.74.399.2]morning: 05:00:01−10:00:00 h; midday: 10:00:01− 14:00:00 h; late afternoon: 14:00:01−19:00:00 h; and night: 19:00:01−05:00:00 h) during and after the typi-cal reproductive period. Movement patterns as well as fish depths were analyzed using t-tests and a 3-factor general linear ANOVA with the 3-factors defined as individual, time block (time of day) and spawning state (reproductive/post-reproductive).
Habitat mapping
A bathymetric map of the study site was developed using a combination of SONAR and differential GPS (Fig. 1d). Maps of physical habitat (coral, open sand, rubble substrate, coral formations or bommies) were created throughout the study period. Coral was iden-tified to genus and species (when possible) and mapped over scaled images derived from the bathy-metric map of the reef edge. After the telemetry study was complete, habitat within the study area was mapped using SCUBA. To create scaled maps of habitat availability, we used a novel technique with an acoustically-tagged diver and an assistant, who both tabulated substrate and coral along underwater transects (spaced approximately 3 m within the tracking array) while being tracked with the tele -metry system. In this way it was possible to create a scaled map of habitat availability that could be superimposed on a similarly scaled map of fish move-ment for analysis.
Raw telemetry data were filtered and superim-posed over maps of habitat availability using a Win-dows-based telemetry data analysis program called Biotrek, which was custom designed for this study. This software used pixel-coding to assign specific habitat characteristics on scaled maps, and then cor-related pixel codes with locations occupied by fish when they were tracked. The program essentially recreated patterns of habitat/depth utilization by re -playing scaled paths of movement over scaled maps of habitat in areas that fish occupied. The program calculated habitat utilization histograms related to the number of observations of each fish in each habi-tat category.
Total area and percentage of the total area for each habitat type was calculated using GE path v 1.4.6. Habitat preference was calculated by dividing habi-tat utilization by habihabi-tat availability, which was then standardized to a value of 1 by dividing by the high-est preference value (Mäki-Petäys et al. 1997) for each respective time block across the reproductive and post-reproductive periods. Patterns related to habitat
utilization throughout the day and night during and after the reproductive period were analyzed with a G-test. All analyses (α= 0.05) were conducted using JMP 7.0 (SAS Institute).
RESULTS
Movement
Tagged fish from the aggregation site slowly began to disappear from the OTI lagoon over the course of the study, which corresponded to the transition be -tween the estimated reproductive and post-reproduc-tive periods (Table 1). Of the 10 fish that were tagged in November 2001, Fish 4587 was last detected on 11 December 2001 and Fish 4590 was not detected after 18 January 2002, despite extensive mobile tracking efforts throughout and around OTI. By 31 January 2002, only 40% of tagged Plectropomus leopardus were located near the aggregation site.
Fish were absent from the array for more than an hour before returning to the aggregation on 5 sions during the reproductive period and 45 occa-sions after reproduction (Table 1). Fish detected outside the lagoon moved to a maximum distance of 593 m from the aggregation (Fig. 1c). Some fish disappeared and reappeared periodically from the array area, indicating movements away from the aggregation site (verified using mobile tracking). Other fish used complex areas of coral habitat, and transmitter signals were undetect able even while they were in the array (as determined with SCUBA and portable underwater re ceivers), particularly dur-ing the reproductive period. Movement outside the array increased during the post-reproductive period as the aggregation began to disperse in late January (Table 1).
Depth
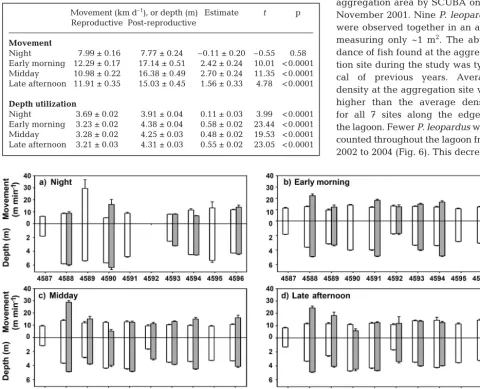
The maximum depth of the study area was 7.5 m at high tide, and fish utilized almost the entire depth range. The mean depth occupied during the repro-ductive period (3.38 ± 0.01 m) was significantly shal-lower than the mean depth occupied during the post-reproductive period, 4.23 ± 0.02 m (F= 1093.37, p < 0.0001; Table 2, Table 3, Figs. 2, 3b,d,f, 4). Fish occupied deeper areas during the reproductive period at night, and the shallowest depths were occu-pied in the morning and afternoon. After the repro-ductive period, the opposite pattern was observed. Despite overall trends, tracks of individual fish indi-cated that there was a great deal of variation, with some fish making rapid changes in depth in the water column (> 6 m), while other fish tended to maintain similar depths throughout the day and night (Fig. 4).
Vertical positions of Plectropomus leopardusin the water column were variable but did not appear to be influenced by daily tidal conditions during or after the reproductive period. OTI, including the area where the study was conducted, is a ponding lagoon, so the water level remains elevated and stable as sea level drops outside the reef. As such, the tidal fluctuation (for low tide) is truncated in the intra -lagoonal location where the tracking study took place. This confounds any statistical analyses designed to demonstrate that the fish responded to tidal fluc -tuations. Fig. 4 shows that as water elevation (or tide level) decreases, fish tended to occupy shallower areas; however, we believe that this is an artifact resulting from reduced hydrostatic pressure on the tag transducer rather than vertical movement in the water column. This also makes sense in light of the highly territorial nature of coral trout. Therefore, based on qualitative observations, P. leopardustended to remain at specific locations relative to the bottom of the reef and did not appear to be affected by changes in surface water elevation (Fig. 4).
Habitat
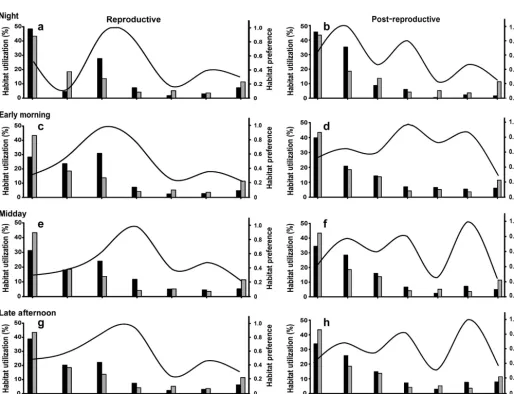
Habitat was not distributed uniformly throughout the study area, and habitat utilization was not uni-form throughout the day during or after the repro-ductive period (G-test, G = 14.94, all p < 0.0001). Sand was the most abundant habitat type (43%) and was utilized more than any other habitat type during the reproductive (36%) and post-reproductive peri-ods (38%; Table 4, Fig. 5). However, in terms of
pref-T ag T agging Fr eq. Length Sex Captur e and
Days tracked in ar
ray
No. occasions fish tracked outside ar
ray F inal code date (kHz) (mm) re lease R epr oductive Post-r epr oductive Repr oductive Post-r epr oductive status 4587 13/11/01 51 565 − Near aggr egation 17 − 0 0 O ff r eef 4588 13/11/01 54 485 M (ripe) Near aggr egation 23 14 0 2 Ar ray 4589 13/11/01 57 545 M (ripe) Aggr egation 19 10 0 1 1 Lagoon 4590 16/11/01 60 585 − Aggr egation 23 1 0 0 O ff r eef 4591 16/11/01 63 470 − Aggr egation 19 9 0 14 Euthanised a 4592 16/11/01 66 447 − Aggr egation 13 2 0 6 A rr ay 4593 16/11/01 69 572 − Aggr egation 23 15 0 2 Ar ray 4594 16/11/01 72 466 M (ripe) Aggr egation 22 14 0 0 Ar ray 4595 17/11/01 75 412 M (ripe) Aggr egation 18 − 5 6 O ff r eef 4596 17/11/01 78 442 M (ripe) Aggr egation 20 5 0 4 O ff r eef aRecaptur
ed in the ar
ray on 18 Januar
y 2002 so that
the transmitter could be r
e
-used to map habitat with SCUBA
T able 1. Plectr opomus leopar dus . V
ital statistics of coral tr
out tracked at One T
ree Island, with tagging date, captur
e and r
e
lease location, number of days e
ach fish was
tracked inside and outside the ar
ray during and after the r
epr
oductive period, and the status of each fish at the end of the st
erence, live Porites coral, followed by large (> 2 m wide, >1 m high) bommies, ranked as the most im -portant habitat type during the reproductive period, regardless of time of day (Fig. 5a,c,e,g, Table 4). After spawning, there was a shift in habitat preference that varied depending on the time of day. At night, Plec-tropomus leopardus preferred to use coral rubble, whereas in the early morning they preferred large bommies > 2 m wide and >1 m high. At night and in the late afternoon they preferred smaller bommies, 1 and 2 m wide and > 0.5 m high (Fig. 5b,d,f,h).
Patterns of abundance
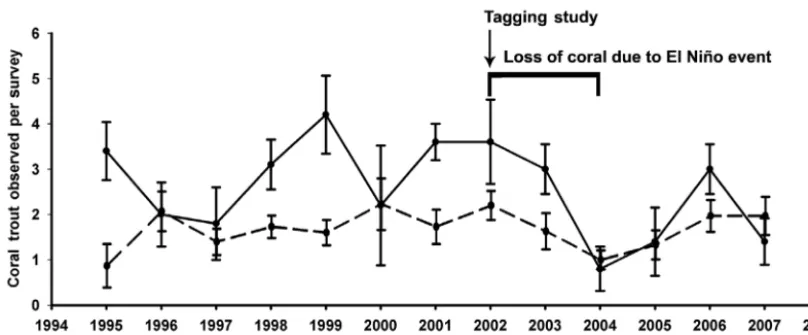
[image:6.612.58.288.119.241.2]Twenty Plectropomus leopardus were observed near or within the aggregation area by SCUBA on 15 November 2001. Nine P. leopardus were observed together in an area measuring only ~1 m2. The abun-dance of fish found at the aggrega-tion site during the study was typi-cal of previous years. Average density at the aggregation site was higher than the average density for all 7 sites along the edge of the lagoon. Fewer P. leoparduswere counted throughout the lagoon from 2002 to 2004 (Fig. 6). This de crease Table 2. 3-factor ANOVA comparing movement and depth
utilization throughout the day (time period) during and after the reproductive period (spawning status)
Fig. 2. Plectropomus leopardus. Mean movement (± SE) and mean depth utilization (SE) of coral trout during the reproductive period (white, November−December 2001) and after the reproductive period (grey, January−February 2002) across all daily
time periods near the aggregation site
Factor df SS F p
Movement
Spawning status 1 32850.71 121.65 < 0.0001 Time period 3 86990.54 107.38 < 0.0001 Individual 9 51386.29 21.14 < 0.0001
Depth
Spawning status 1 1894.26 1093.37 < 0.0001 Time period 3 1001.45 192.68 < 0.0001 Individual 9 21656.83 1388.93 < 0.0001
Movement (km d–1), or depth (m) Estimate t p
Reproductive Post-reproductive
Movement
Night 7.99 ± 0.16 7.77 ± 0.24 –0.11 ± 0.20 –0.55 0.58 Early morning 12.29 ± 0.17 17.14 ± 0.51 2.42 ± 0.24 10.01 < 0.0001 Midday 10.98 ± 0.22 16.38 ± 0.49 2.70 ± 0.24 11.35 < 0.0001 Late afternoon 11.91 ± 0.35 15.03 ± 0.45 1.56 ± 0.33 4.78 < 0.0001
Depth utilization
[image:6.612.58.538.300.688.2]Night 3.69 ± 0.02 3.91 ± 0.04 0.11 ± 0.03 3.99 < 0.0001 Early morning 3.23 ± 0.02 4.38 ± 0.04 0.58 ± 0.02 23.44 < 0.0001 Midday 3.28 ± 0.02 4.25 ± 0.03 0.48 ± 0.02 19.53 < 0.0001 Late afternoon 3.21 ± 0.03 4.31 ± 0.03 0.55 ± 0.02 23.05 < 0.0001 Table 3. t-tests comparing movement and depth utilization throughout the day (time period) during and after the reproductive period. Movement, depth and
in abundance appeared to be related to loss of live coral cover that followed strong El Niño conditions in 1998 and 2001.
DISCUSSION
MPAs and fishing restrictions are essential for the recovery and sustainability of Plectropomus leopar-dusand other serranids that are heavily targeted and exploited in the Indo-Pacific and the Great Barrier Reef (Williams et al. 2008). There is ample evidence that MPAs replenish fish populations (Graham et al. 2003, Nardi et al. 2004, Williamson et al. 2004, Wat-son et al. 2007, Russ et al. 2008) and are a promising global fisheries management option. Despite con-cerns of economic consequences associated with sequestering reef habitats for the sole purpose of conservation (Russ 1991), recent work has shown no net loss in revenue in commercial fisheries, with the losses of some fishers balanced by the gains of others (Jeffrey et al. 2012).
Identification of preferred habitats, movement capabilities and site fidelity within both home ranges and aggregation sites must be considered during de
-lineation of MPAs, and should be a focus of conserva-tion objectives. Although data are limited for most species, it is important to determine whether Plectro -pomusspp., as well as other serranids, can be effec-tively managed using multi-species rather than species-specific conservation strategies.
[image:7.612.110.486.78.367.2]In this study, Plectropomus leopardusmoved signif-icantly greater distances, utilized signifsignif-icantly deeper habitat and preferred different habitat during the post-reproductive compared with the reproductive period. In comparison with other studies on P. leopar-dus, the intralagoonal site at OTI is somewhat unique within the Great Barrier Reef. This location is at the southern end of the P. leopardusdistribution, and as such, the data collected for this study may be more relevant to southern populations than northern ones, and may partially explain differences in be haviour considering that the tracking methods that we used were similar to those used by Zeller (1996), Zeller & Russ (1998) and Samoilys (1997a). Large amounts of data are typically collected with these types of VRAP telemetry projects, and this may have resulted in in-flated distances moved due to the cumulative effect of minor signal bounces or variation in signal trans -mission. However, it is important to note that most of Fig. 3. Plectropomus leopardus. Detailed examples of (a,c,e) mean movement (± SE) and (b,d,f) mean depth (± SE) of Individu-als 4588 (a,b), 4594 (c,d) and 4596 (e,f) within the aggregation site during the reproductive period (solid line, November−
Fig. 4.
Plectr
opomus leopar
dus
. Depth data fr
om Individuals 4588 (solid line), 4594 (dotted line) and 4596 (dashed line) over several days during the r
epr
odu
ctive period
([a]
19 November 2001, [b] 14 December 2001 and [c] 17 December 2001) and post-r
epr
oductive period ([d] 20 Januar
y
2002, [e] 26
Januar
y 2002 and [f] 29 Januar
y 2002],
in r
e
lation to the tide height above sea level outside the lagoon (gr
ey cur
ved line). New moon and full moon: 14 December 2001
and 29 Januar
y 2002, r
e
Habitat/substrate type Number of sites Total area (m2) % Available Habitat utilization (%)
Reproductive Post-reproductive
Sand 276 16803 43 36 38
Rubble 118 7163 19 17 27
Live Poritescoral 85 5304 14 27 14
Bommiea> 2 m wide, >1 m high 27 1626 4 8 7
Bommie 1−2 m wide, < 0.5 m high 23 1394 4 3 6
Bommie 1−2 m wide, > 0.5 m high 33 2013 5 3 3
Bommie <1 m wide, < 0.5 m high 72 4414 11 6 5
Total 634 38717 100 100 100
[image:9.612.60.539.121.252.2]aA bommie is a vertical coral out-crop or a distinct congregated coralline mound usually surrounded by sand
Table 4. Habitat type, number of sites surveyed, total area and percentage of total area of each habitat type within the receiver array, as well as coral trout utilization of each habitat type pooled across daily time blocks during and after the reproductive
period
Fig. 5. Plectropomus leopardus. Habitat utilization (black bars), habitat availability (grey bars) and habitat preference curves for coral trout during the (a,b) night, (c,d) early morning, (e,f) midday and (g,h) late afternoon, during the reproductive period (a,c,e,g) and post-reproductive period (b,d,f,h). Bommie habitat types are as follows: Bommie 1: > 2 m wide, >1 m high;
[image:9.612.43.557.282.675.2]the potential biases in our data would have been con-sistent across the 2 periods (reproductive and post-reproductive), and therefore the relative differences that we observed are significant and inferentially valuable. Despite the caveats, the differences in movement and habitat preferences between repro-ductive and post-reprorepro-ductive periods from this study complement previously documented patterns and trends of P. leopardusbehaviour that are essential for the development of effective management strategies. As with many other species in the grouper family, this study showed that Plectropomus leopardus use a mosaic of habitats such as sand, rubble, live coral and bommies of varying dimension (Syms & Kings-ford 2008). They also use lagoon reef environments including reef slope, areas of strong water currents (Kingsford 1992, 2009) and live coral such as Acrop-ora and Porites (Morris et al. 2000, Manson et al. 2005). The preference for live corals was evident at the aggregation site, particularly during the repro-ductive period, as also described by Connell & Kings-ford (1997). However, after reproduction, a shift away from live coral was noted at small spatial scales, with an increase in the use of coral rubble. This trend has also been documented for other heav-ily exploited and potentially threatened species such as black grouper Mycteroperca bonaci in Florida (Eklund et al. 2000), Nassau grouper Epinephelus striatus in the Bahamas (Eggleston 1995, Sadovy & Eklund 1999, Bolden 2000), red hind E. guttatus in the US Virgin Islands (Nemeth 2005), Cephalopholis urodeta in the Indo-West Pacific (Donaldson 2002) and P. areolatus, P. lavevisand P. maculatuson the Great Barrier Reef (Hutchinson & Rhodes 2010).
Changes in habitat preference and vertical shifts in
position within the water column did not appear to occur, as indicated by the lack of consistent response to tidal stage (Fig. 4). The results of Connell & Kings-ford (1998) also showed little temporal variation in position within the water column. However, Samoilys & Squire (1994) linked movements into and out of reproductive aggregation sites with lunar cycles. They also noted an increase in abundance at aggre-gation sites during the 3rd and 4th phases of the moon, and reproduction occurred around the new moon, when fish released gametes during strong tidal flow. According to Zeller (1998), the highest total count of Plectropomus leoparduswas in aggre-gations during the new moon periods in October and November. In addition, Zeller (2002) also found that the upcurrent side of reefs and smaller structures were preferred, and that fish moved with changing upcurrent positions through the tidal cycle.
[image:10.612.88.492.77.244.2]Previously examined movements of Plectropomus leopardusindicate site fidelity to both home ranges and aggregation sites (Zeller 1997, 1998, Zeller & Russ 1998). Such behaviours must be considered in MPA delineation. In the present study, movements away from the aggregation site were 9 times more likely after the reproductive period. However, at OTI, fish only moved a maximum distance of 0.6 km from the aggregation within the lagoon (Fig. 1). In com-parison, these values differ greatly from those docu-mented by Hutchinson & Rhodes (2010) for P. areo -latus (23 km), P. leopardus (5.2 km), Epinephelus striatus (240 km) and E. guttatus (33 km). Zeller (1998) found that the distance between home ranges and aggregation sites ranged from 0.2 to 5.2 km (mean = 0.9 ± 0.2 km), and that movement back and forth between these sites ranged from 0.6 to 17 km. Fig. 6. Plectropomus leopardus. Changes in January abundance of coral trout observed per 125 m2at One Tree Island from
In the present study, the mean distance moved by P. leopardus was less during the reproductive period (10.63 ± 0.13 km d−1) and greater (14.48 ± 0.26 km d−1) during the post-reproductive period, which contrasts with observations by Samoilys (1997a). However, Zeller & Russ (1998) also showed that P. leopardus moved much less (mean = 0.2 km d−1) during repro-duction. These observations probably have a bio -energetic explanation, with re-direction of resources primarily towards reproduction. During the reproductive period, movement rates may have been re -duced as fish conserved energy, remained relatively aggregated and devoted bioenergetic resources to gamete production and spawning. After reproduc-tion, movement rates may have increased and prox-imity to the bottom of the reef (i.e. fish depth) may also have increased as fish became more engaged in foraging activities to replace resources lost during reproduction. In our study, fish moved most in the morning segment of the post-reproductive period, and this was likely related to visually oriented foraging activity. The least amount of movement was ob -served during the night throughout the study, and there was no significant difference in nighttime move -ment between the reproductive and post-reproductive period. Zeller (1998) found that 60% of departures from aggregation sites occurred in the morning and minimal movement occurred at night. Pastor et al. (2009) observed peak hours of activity between 08:00−09:00 and 19:00−20:00 h, with decreased activ-ity at sunset for Epinephelus marginatusin the Medi-terranean. The variation in movement and distance traveled between home ranges and aggregation sites by P. leopardus and other species of serranids is large. In this context, general protection of all ser-ranids may require a maximum distance of 240 km from aggregations to be protected; however, for P. leopardusa maximum distance of 5.2 km may be suf-ficient at OTI, but this may not be appropriate for other areas.
It is important to note that several fish disappeared entirely during the study, which may be related to detection efficiency within a complex reef habitat or inter-reef movement. Hutchinson & Rhodes (2010) tested the efficiency of tag detection and found that in open water with no obstructions, detection ranges were 0.25 km, but when fish were associated with reefs, distances dropped to 0.1 km, and in complex coral, reception dropped to under 40 m with the worst detection ranges of 10−20 m. In addition to complex coral habitat, wind, sea state and biological noise (e.g. pistol shrimp) may also interfere with de -tection of ultrasonic transmissions, meaning that the
effects of these factors on signal detectability and ori-entation need to be considered to minimize direc-tional bias and error (Zeller 1999, Farmer et al. 2013). When considering inter-reef movements for the creation of MPAs, Zeller (1998) found that multiple aggregation sites do exist, and there was circum -stantial evidence to suggest that inter-reef move-ments may have occurred in the present study. How-ever, this contradicts results from Davies (1995), who found minimal movement between reefs even during reproductive periods. Zeller (1998) reported that only 31% of tagged fish returned to an aggregation, and one male utilized a spawning site 0.7 km away on a neighboring patch reef even though there were closer well-established aggregations. In a similar study, an individual Nassau grouper was caught at an aggre-gation 220 km away from the reef, where it was tagged in the Bahamas, although there were many other aggregations much closer (Bolden 2000). Bolden (2000) suggested that the locations of aggregations may be learned through social cues from older indi-viduals. Evidence suggests that inter-environmental and inter-reef movements likely do occur and should be incorporated into the delineation of MPAs.
Consistent movements out of the aggregation indi-cate that fish were seeking one or a combination of the following: (1) better feeding conditions on the reef edge (Connell & Kingsford 1997) due to lack of signif-icant resources within the aggregation site (Samoilys & Squire 1994), or (2) cleaning stations and/ or social interactions with conspecifics (e.g. courting, Kings-ford 2009). However, Plectropomus leopardusin the OTI lagoon remained within 2.6 ha for over 81 d, sug-gesting a preference for particular smaller areas within a larger home range. Previous studies have shown that P. leopardusmaintain a small number of sites for access to shelter and cleaning stations, and may move along the reef slope in search of prey (Samo ilys 1997a, Zeller 1997). Samoilys (1997a) tracked P. leopardusthat moved a mean distance of 2 km, to a maximum of 7.5 km, along the reef slope before returning to an aggregation site. Displacement experiments and observations of aggregation fidelity indicate that P. leopardus can and will move across the reef crest, and they have the ability to rapidly return to previously occupied areas over distances of several kilometers (C.M.B. & M.J.K. unpubl. data). This indicates strong site fidelity and exceptional homing abilities in highly complex reef habitats.
reproductive and post-reproductive periods. Com-parisons between P. leopardus and other serranids show that variation in movement is great and there-fore multiple species cannot be effectively protected using similar management measures. Unless maxi-mum movements of species (e.g. Epinephelus striatus) are used, species-specific and site-specific manage-ment plans should be developed. Therefore, to effec-tively protect and sustain P. leopardus, research on site-specific aggregations, migratory corridors and adjacent home range habitats must be conducted to determine appropriate sizes and placement of areas where P. leopardus could be protected from exploitation.
Acknowledgements.The authors of this study are grateful for an ARC Grant to M.J.K. and an NSERC post-doctoral research fellowship to C.M.B. Biotactic Fish & Wildlife Research provided funding and facilities for data analysis and manuscript preparation. Special thanks to Phil Bolton, Paul Condon and Julian Hughes for assistance in the field. Brett Raven developed and wrote the code for the Biotrek program used to analyze our telemetry data. Tidal and lunar data were provided by the Commonwealth of Australia and Sydney Observatory. Thanks for the support of Konrad and Pam Beinssen (managers at OTI) during the study. We also thank Stephanie Choo-Wing, Dana Eddy, Adam Martin, Rebecca McNeil, Emily Taylor, Samantha Crowley, Barbara Piolunowska, Dan Watkins and several anonymous review-ers. All international and institutional ethics standards were followed throughout the course of this study.
LITERATURE CITED
Aguilar-Perera A, Aguilar-Dávila W (1996) A spawning aggregation of Nasau grouper Epinephelus striatus
(Pisces: Serranidae) in the Mexican Caribbean. Environ Biol Fishes 45: 351−361
Bohnsack JA (1982) Effects of piscivorous predator removal on coral reef fish community structure. In: Caillet GM, Simenstad CA (eds) Gutshop ’81: fish food habit studies. Washington Sea Grant, Seattle, WA, p 258−267
Bolden SK (2000) Long-distance movement of a Nassau grouper (Epinephelus striatus) to a spawning aggrega-tion in the central Bahamas. Fish Bull 98: 642−645 Ceccarelli D, Ayling T (2010) Role, importance and vul
-nerability of top predators on the Great Barrier Reef: a review. Research Publications Series No. 105, Great Barrier Reef Marine Park Authority, Townsville
Choat JH (1968) Feeding habits and distribution of Plectro -pomus maculatusSerranidae at Heron Island Australia. Proc R Soc Queensl 80: 13−19
Connell SD, Kingsford MJ (1997) The utility of descriptive in-formation for assessing the impact of coral reef piscivores on their prey. Proc 8th Int Coral Reef Symp 1: 999–1004 Connell SD, Kingsford MJ (1998) Spatial, temporal and
habitat-related variation in the abundance of large predatory fish at One Tree Island, Australia. Coral Reefs 17: 49−57
Cornish A, Kiwi LK (2004) Plectropomus leopardus. In: IUCN
2013. IUCN Red List of Threatened Species. Version 2013.1 Davies CR (1995) Patterns of movement of three species of coral reef fish on the Great Barrier Reef. PhD disserta-tion, James Cook University, Townsville
DeMartini EE (1993) modeling the potential of fishery reserves for managing Pacific coral reef fishes. Fish Bull 91: 414−427
Domeier ML, Colin PL (1997) Tropical reef fish spawning aggregations: defined and reviewed. Bull Mar Sci 60: 698−726
Donaldson TJ (2002) Habitat association and depth distribu-tion of two sympatric groupers of the genus Cephalopho-lis(Serranidae: Epinephelinae). Ichthyol Res 49: 191−193 Eggleston DB (1995) Recruitment in Nassau grouper Epi-nephelus striatus: post-settlement abundance, microhab-itat features, and ontogenetic habmicrohab-itat shifts. Mar Ecol Prog Ser 124: 9−22
Eklund AM, McClellan DB, Harper DE (2000) Black grouper aggregations in relation to protected areas within the Florida Keys National Marine Sanctuary. Bull Mar Sci 63: 721−728
Farmer NA, Ault JS, Smith SG, Franklin EC (2013) Methods for assessment of short-term coral reef fish movements within an acoustic array. Movement Ecol 1: 7
Fulton E, Kault D, Mapstone B, Sheaves M (1999) Spawning season influences on commercial catch rates: computer simulations and Plectropomus leopardus, a case in point. Can J Fish Aquat Sci 56: 1096−1108
Graham NAJ, Evans RD, Russ GR (2003) The effects of mar-ine reserve protection on the trophic relationships of reef fishes on the Great Barrier Reef. Environ Conserv 30: 200−208
Hixon MA (1991) Predation as a process structuring coral-reef fish communities. In: Sale PF (ed) The ecology of fishes on coral reefs. Academic Press, London, p 475−508 Hutchinson N, Rhodes KL (2010) Home range estimated for squaretail coralgrouper, Plectropomus areolatus(Rüppell 1830). Coral Reefs 29: 511−519
Jeffrey CFG, Leeworthy V, Monaco ME, Piniak G, Fonseca M (eds) (2012) An integrated biogeographic assessment of reef fish populations and fisheries in Dry Tortugas: effects of no-take reserves. NOAA Tech Memo NOS NCCOS 111. Silver Spring, MD
Kingsford MJ (1992) Spatial and temporal variation in pre-dation on reef fishes by coral trout (Plectropomus leopar-dus, Serranidae). Coral Reefs 11: 193−198
Kingsford MJ (2009) Contrasting patterns of reef utilization and recruitment of coral trout (Plectropomus leopardus) and snapper (Lutjanus carponotatus) at One Tree Island, southern Great Barrier Reef. Coral Reefs 28: 251−264 Little LR, Smith ADM, McDonald AD, Punt AE, Mapstone
BD, Pantus F, Davies CR (2005) Effects of size and frag-mentation of marine reserves and fisher infringe ment on the catch and biomass of coral trout, Plectropomus leop-ardus, on the Great Barrier Reef, Australia. Fish Manag Ecol 12: 177−188
Mäki-Petäys A, Muotka T, Huusko A, Tikkanen P, Kreivi P (1997) Seasonal changes in habitat use and preference by juvenile brown trout, Salmo trutta, in a northern boreal river. Can J Fish Aquat Sci 54: 520−530
Manson FJ, Loneragan NR, Harch BD, Skilleter GA, Williams L (2005) A broad-scale analysis of links between coastal fisheries production and mangrove extent: a case-study for northeastern Australia. Fish Res 74: 69−85
Mapstone BD, Davies CR, Little LR, Punt AE and others
(2004) The effects of line fishing on the Great Barrier Reef and evaluation of alternative potential manage ment strategies. CRC Reef Research Centre Technical Report, 52. CRC Reef Research Centre, Townsville
Mclean DL, Harvey ES, Meeuwig JJ (2011) Decline in the abundance of coral trout (Plectropomus leopardus) in areas closed to fishing at the Houtman Abrolhos Islands, Western Australia. J Exp Mar Biol Ecol 406: 71−78 Morris AV, Roberts CM, Hawkins JP (2000) The threatened status
of groupers (Epinephelinae). Biodivers Conserv 9: 919−942 Nardi K, Jones GP, Moran MJ, Cheng YW (2004) Con trasting
effects of marine protected areas on the density of two exploited reef fishes at the sub-tropical Houtman Abrolhos Islands, Western Australia. Environ Conserv 31: 160−168 Nemeth RS (2005) Population characteristics of a re covering US Virgin Islands red hind spawning aggregation follow-ing protection. Mar Ecol Prog Ser 286: 81−97
O’Dor RK, Aitken JP, Babcock RC, Bolden SK, Seino S, Zeller DC, Jackson GD (2001) Using radio-acoustic posi-tioning and telemetry (RAPT) to define and assess mar-ine protected areas (MPAs). In: Sibert J, Nielsen J (eds) Electronic tagging and tracking in marine fisheries, Vol 1. Kluwer, Dordrecht, p 147−166
Pastor J, Verdoit-Jarraya M, Astruch P, Dalias N, Pasqual JN, Saragoni G, Lenfant P (2009) Acoustic tememetry survey of the dusky grouper (Epinephelus marginatus) in the Marine Reserve of Carbere-Banyulus: information on the territoriality of this emblematic species. C R Biol 332: 732−740 Pet JS, Mousa PJ, Muljadia AH, Sadovy YJ, Squire L (2005) Aggregations of Plectropomus areolatus and Epineph-elus fuscoguttatus(groupers, Serranidae) in the Komodo National Park, Indonesia: monitoring and implications for management. Environ Biol Fishes 74: 209−218 Queensland Government (2011) Annual status report 2010
coral reef fin fish fishery. The State of Queensland Department of Employment, Economic Development and Innovation
Rowley RJ (1994) Marine reserves in fisheries management. Aquat Conserv 4: 233−254
Russ GR (1991) Coral reef fisheries: effects and yields. In: Sale PF (ed) The ecology of fishes on coral reefs. Aca-demic Press, San Diego, CA, p 601−634
Russ GR, Alcala AC (1996a) Do marine reserves export adult fish biomass? Evidence from Apo Island, Central Philip-pines. Mar Ecol Prog Ser 132: 1−9
Russ GR, Alcala AC (1996b) Marine reserves: rates and pat-terns of recovery and decline of a large predatory fish. Ecol Appl 6: 947−961
Russ GR, Cheal AJ, Dolman AM, Emslie MJ and others (2008) Rapid increase in fish numbers follows creation of world’s largest marine reserve network. Curr Biol 18: R514−R515
Sadovy Y, Eklund A (1999) Synopsis of biological data on the Nassau Grouper, Epinephelus striatus(Bloch, 1792), and the jewfish, E. itajara(Lichtenstein, 1822). NOAA Tech-nical Report of the Fishery Bulletin FAO Fisheries
Synop-sis 157. US Department of Commerce, Seattle, WA Samoilys MA (1997a) Periodicity of spawning aggregations
of coral trout Plectropomus leopardus (Pisces: Ser-ranidae) on the northern Great Barrier Reef. Mar Ecol Prog Ser 160: 149−159
Samoilys MA (1997b) Movement in a large predatory fish: coral trout, Plectropomus leopardus(Pisces: Serranidae), on Heron Reef, Australia. Coral Reefs 16: 151−158 Samoilys MA, Squire LC (1994) Preliminary observation on
the spawning behaviour of coral trout, Plectropomus leopardus(Pisces: Serranidae), on the Great Barrier Reef. Bull Mar Sci 54: 332−342
Sluka R, Chiappone M, Sullivan KM (1994) Comparison of juvenile grouper populations in Southern Florida and the Central Bahamas. Bull Mar Sci 54: 871−880
St. John J, Russ GR, Brown IW, Squire LC (2001) The diet of the large coral reef serranid Plectropomus leopardusin two fishing zones on the Great Barrier Reef, Australia. Fish Bull 99: 180−192
Syms C, Kingsford MJ (2008) Coral reef habitats and assem-blages. In: The Great Barrier Reef: biology, environment and management. CSIRO Publishing, Collingwood, VIC, Australia, p 40−50
Thresher RE (1984) Reproduction in reef fishes, 1st edn. TFH Publications, Neptune City, NJ
Watson DL, Harvey ES, Kendrick GA, Nardi K, Anderson MJ (2007) Protection from fishing alters the species com-position of fish assemblages in a temperate tropical tran-sition zone. Mar Biol 152: 1197−1206
Williams AJ, Currey LM, Begg GA, Murchie CD, Ballagh AC (2008) Population biology of coral trout species in eastern Torres Strait: implications for fisheries manage-ment. Cont Shelf Res 28: 2129−2142
Williamson DH, Russ GR, Ayling AM (2004) No-take marine reserves increase abundance and biomass of reef fish on inshore fringing reefs of the Great Barrier Reef. Environ Conserv 31: 149−159
Zeller DC (1996) Patterns of movement of Plectropomus leopardus(Serranidae) in relation to spawning aggrega-tions and marine protected areas, as determined by ultrasonic telemetry. PhD thesis, James Cook University, Townsville
Zeller DC (1997) Home range and activity patterns of the coral trout Plectropomus leopardus (Serranidae). Mar Ecol Prog Ser 154: 65−77
Zeller DC (1998) Spawning aggregations: patterns of move-ment of the coral trout Plectropomus leopardus (Ser-ranidae) as determined by ultrasonic telemetry. Mar Ecol Prog Ser 162: 253−263
Zeller DC (1999) Ultrasonic telemetry: application in coral reef fisheries research. Fish Bull 97: 1058−1065
Zeller D (2002) Tidal current orientation of Plectropomus leopardus(Serranidae). Coral Reefs 21: 183−187 Zeller DC, Russ GR (1998) Marine reserves: patterns of adult
movement of the coral trout (Plectropomus leopardus
(Serranidae)). Can J Fish Aquat Sci 55: 917−924
Submitted: March 11, 2013; Accepted: November 11, 2013 Proofs received from author(s): December 10, 2013