1
Data Linking Demonstration
Project - Flying Start
Martin Heaven, Health Information Research Unit, Swansea
University/Data Linkage Fellow, Welsh Government
Sarah Lowe, Knowledge and Analytical Services, Welsh
Government
Views expressed in this report are those of the researcher and not necessarily those of the Welsh Government
For further information please contact: Sarah Lowe
Knowledge and Analytical Services Welsh Government
Cathays Park Cardiff
CF10 3NQ
Tel: 02920 826229
Email: [email protected]
Welsh Government Social Research, 2014 ISBN 978-1-4734-0907-1
Glossary of Acronyms 3
1. Introduction 5
2. Making health data available for research 10
3. Methodology 16
4. Address matching and defining populations 25
5. Findings 31
6. Discussion 60
Appendix 1 IGRP membership 64
Appendix 2 IGRP application 65
Appendix 3 Split File Process diagram 72
Appendix 4 List of possible future research projects 75
Appendix 5 Technical Guide 76
3
Glossary of acronyms
‘5 in 1’ The ‘5 in 1’ vaccine for Diphtheria, Tetanus, Pertussis, Polio and HIB. A&E Accident and Emergency (Data Set)
ALF Anonymised Linking Field CHS Child Health System (Data Set)
EASHR European Age Standardised Hospitalisation Rate EASMR European Age Standardised Mortality Rate EDDS Emergency Department Data Set
ESRC Economic and Social Research Council
FSE Flying Start Eligible (for the purposes of this report) HES Hospital Episode Statistics
HIB Haemophilus influenzae type B vaccine HIRU Health Information Research Unit IGRP Information Governance Review Panel
KS1 Key Stage 1 (educational attainment assessment) LA Local Authority
LSOA Lower Super Output Area
MCHC Multiple Chronic Health Conditions
MMR1 Measles, Mumps and Rubella (1 indicating 1st round of vaccination) MMR2 Measles, Mumps and Rubella (2 indicating 2nd round of vaccination) NMD Next Most Deprived (a comparison group in this project)
NWIS NHS Wales Information Service
NHSAR NHS Administrative Register, (now superseded by WDS) ONS Office for National Statistics
4 RALF Residential Anonymised Linking Field
RoW Rest of Wales (a comparison group in this project) SAIL Secure Anonymised Information Linkage
SQL Structured Query Language
WDS Welsh Demographics Service (GP registration history database) WG Welsh Government
5
1 Introduction
The aim and objectives of the demonstration project
1.1 This project is being delivered as part of the Welsh Government Programme to Maximise the Use of Existing Data. It aims to demonstrate the unique contribution data linking can make to the evidence base. The suite of three data linking
demonstration projects has examined the anonymised data linkage process from acquiring additional data to carrying out analysis on new data sets created by linking existing administrative data. The projects are intended to stimulate engagement of appropriate WG officials with regard to information governance and practical issues around acquiring, processing and analysing new linked data sets. The projects were delivered by a Knowledge Transfer Research Fellow jointly funded by WG and the Economic and Social Research Council (ESRC) working on a one-year fellowship. The projects were therefore designed to be small in scale and exploratory in nature. These constraints are reflected in their relatively limited scope and in both the practical and analytical decisions made throughout.
1.2 Flying Start is the Welsh Government’s flagship early years programme and
provides a path towards improving the life chances of children in some of our most disadvantages communities. This multi-disciplinary programme provides a
‘universal’ set of entitlements which all children under the age of 4, and their families within targeted geographical areas can access. The entitlements offer a range of support that will provide a quality early years provision for the child and a range of support for parents to build skills and resilience. The 4 key elements are:
quality part-time childcare for 2-3 year olds in Flying Start areas; an enhanced Health Visiting service (caseloads are capped at 1:110); access to Parenting Programmes; and
support for Early Language Development.
6 1.4 The Project also aims to demonstrate that routinely collected datasets, handled
appropriately, can provide the means to retrospectively establish baselines for monitoring the effect of an existing intervention, and to prospectively monitor changes in outcomes over time. The recipient population is oblivious to the
assessment process so there are no data collection biases and the cost of ‘keeping in touch’ is avoided altogether.
1.5 In order to achieve the aims outlined in 2.3, a number of intermediate objectives had to be met. Firstly, it was necessary to identify a number of outcome variables or ‘indicators’ in existing health and education datasets, so that baseline information about the Flying Start Eligible (FSE), Next Most Deprived (NMD), and Rest of Wales (RoW) populations could be generated (for information about the selection of
indicators, see Chapter 3). Changes in the indicators over time could then be identified between the pre- and post-intervention time periods. Eligible children and families can also be followed into the future, providing a low-cost solution to long-term monitoring of the outcomes for which data are – or become – available in SAIL. 1.6 The Project documents the step-by-step process of adding potentially identifiable
data (addresses) into an anonymised data repository and linking it, without compromising confidentiality, with data already held.
1.7 The suite of projects was designed to demonstrate data linkage methods but, in doing so, to use the experimental methods developed to deliver some tentative policy-relevant findings to contribute to the evidence base. In the case of this Project, we hoped to contribute to the evidence base for Flying Start. We would expect to see changes in the indicators for the FSE population if Flying Start is having an effect, however it was by no means certain that it would be possible to do so, given that a) changes over time are complex to study because other unrelated changes can be going on at the same time, and b) changes due to Flying Start interventions would need to reach a certain size before we can be confident they are ‘real’ changes.
7 of a demonstration project to identify and control for the effects of other
interventions.
1.9 The Project is experimental. Due to the limited project scope, the lessons learned about data quality and the challenges associated with the use of newly-linked data sets, as well as the developmental nature of the methods, the reader must note that the findings must be viewed with caution.
1.10 Given the limited scope of a demonstration project, it was accepted that it would not be possible to address every potential shortcoming of the data and/or analysis. Data is not available on individual receipt of the various component benefits of the Flying Start programme, so the key limitation of the project is that it analyses data based on a child’s eligibility for the service, not their or their family’s actual receipt of that service1.
1.11 The challenges of working with linked data sets, none of which were designed or collected with research purposes in mind, are already considerable. There are also considerable challenges associated with appropriately and meaningfully analysing data over time (longitudinally). It was therefore accepted from the beginning that the learning about methodology that would come out of these projects would be more important than any substantive research or statistical findings. One key challenge in undertaking the Project has been the selection of suitable outcome indicators e.g. from General Practice data. This is a complex task and there is no precedent to follow in developing an approach. For example, comparing immunisation uptake over time is made more difficult due to the fact that different age groups of children have been targeted over time. For further discussion of indicator selection, see Chapter 3.
1.12 Flying Start is a Welsh Government (WG) led initiative that aims to ‘make a decisive difference to the life chances of children aged less than four in the areas in which it runs’. It includes the provision of enhanced health visiting, childcare, parenting programmes and basic skills (language and play) programmes, with information 1
8 sharing and referral between all practitioners within the Flying Start delivery team. Family eligibility is determined by address – all families with a child aged less than 4 years living in the most deprived community school catchment areas within each Local Authority (LA) in Wales.
1.13 The programme was initiated in 2006/07 and became operational in 2007/08 when Local Authorities began the process of allocating the required staff and premises to provide the programme components. Survey-based evaluation was designed into the programme with reports available on Welsh Government website2. In 2012, the Welsh Government announced a commitment to double the number of children benefiting from the programme from 18,000 to 36,000. This will mean that almost a quarter of children in Wales, under the age of 4, will be receiving services through the programme by 2016. The expansion of the programme is being phased over a number of years to allow for the necessary infrastructure to be put in place,
including the recruitment and training of additional health visitors; childcare workers; staff to deliver parenting programmes; and the development of capital infrastructure, such as childcare settings, in new target areas. The Welsh Government has
allocated more than £88 million additional grant funding to support the delivery of this commitment up to 2016. In addition, £25 million has been approved for capital developments, including high quality childcare settings in all 22 local authorities, providing facilities in communities where currently none exist.. It should be noted, however, that all of the analyses in this report relate to the pre-expansion definitions of Flying Start eligible areas. The Project therefore analysed data for 2004 to 2012, comparing indicators for the pre-Flying Start period of 2004 to 2009 with period of 2010 to 2012 when Flying Start had been rolled out.
1.14 As a number of years will pass before children reach various key stages in
education, a key objective of the project is to develop a semi-automated process to provide annual reporting for the future.
1.15 The process, issues, problems and limitations encountered are documented in this Report. Chapter 3 describes the SAIL databank, the anonymisation of the Flying Start Eligible addresses and their use to ‘flag’ records in other anonymised
10
2
Making administrative data available for research
The development of SAIL
2.1 The NHS in Wales generates a large amount of data collected on a routine basis for the purposes of treating patients and making sure the health service runs properly. Almost none of it is collected for research or statistical purposes but it nevertheless has considerable potential to be used for research. The same is true of other public services, such as education, housing and social care. Data collected by the NHS in Wales is held complete with patient identifiers: NHS number, full name, address, postcode, date of birth and gender. Information Governance law therefore prohibits the use of data in this form for research outside the NHS.
2.2 To address this problem, the Welsh Government funded the creation and development of the Health Information Research Unit (HIRU) at Swansea University, from 2006. The aim of this unit was to develop a means by which routinely collected health data from many different sources could be utilised in a linked way, but in such a way that each dataset was rendered completely
anonymous. The process developed was called Secure Anonymised Information Linkage (SAIL); it led to the collation of a very large collection of anonymised health (and other) datasets stored in Swansea University and made available for research. Each anonymised dataset is stored separately and as far as possible in the form in which it is received from the data provider. The name of ‘SAIL’ has become
synonymous with both the large data repository and the HIRU. ‘SAIL’ will be used to refer to the databank at Swansea University throughout this Report.
11 anonymous linking field. Once the linking field has been created the identifying information is destroyed leaving only the linking field and the index. The index allows the anonymous linking field to be reattached to the analytical data. The analytical data can then be linked to other anonymised data sets without using any identifying variables.
2.4 For SAIL, the NHS Wales Information Service (NWIS) act as the ‘trusted third party’ organisation, routinely turning lists of personalised details into anonymised codes. NWIS utilise the Welsh Demographic Service (WDS) data as the ’population spine’ or ‘template’ for its anonymisation process. The WDS is a database of everyone registered with a GP in Wales from 1994 to the present day. It includes an anonymised residential address history – an index of numbers, one for each residence in Wales, known as the Residential Anonymised Linking Field (RALF). Individual people who have been registered with a GP in Wales, past and present, are represented in the WDS data as another index of unique numbers, known as the Anonymised Linking Field (ALF). In this way, it is possible to associate RALFs with ALFs, that is: homes with residents.
12 Information Governance Issues
2.6 SAIL follows the data protection guidance provided by the Data Commissioner’s Office, and operates within the Swansea University Data Protection policy which is in line with all the relevant UK laws. The anonymous nature of data held in SAIL is such that it is not governed by the Data Protection Act, and it has been agreed by the National Research Ethics Service that research carried out within SAIL does not require ethical review. However all research carried out within SAIL is still managed through a rigorous control structure to ensure that confidentiality is maintained and potentially disclosive outputs are not produced.
2.7 One of the controls in place is a requirement for all proposals involving the analysis of linked data within SAIL to obtain approval from the Information Governance Review Panel (IGRP). The IGRP is a panel of independent specialists in informatics governance and lay people that oversees all research taking place within SAIL. Current membership (June 2013) is listed in Appendix 1. An IGRP application contains an outline of the research rationale for creating the link(s), details of any new datasets that would be accessed, and precisely what variables would be required from the linked datasets. Researchers must indicate in the application that they have considered the handling of sensitive data in the research design.
Although the data sets are all held completely anonymously in SAIL, the selection of a very specific sub-group based on age and gender at small area (LSOA) level, looking at a specific condition could return small numbers. Small numbers in a published output could be put together with other local knowledge to establish who the statistic refers to. Researchers are given access to the data at the most detailed level required to complete their analysis, but need to ensure that nothing potentially identifiable is revealed in their reporting. IGRP applications must indicate how the analyst proposes to deal with small numbers (e.g. through grouping and
aggregation of cases).
13 could compromise the existing confidentiality of the datasets. As noted above, anonymisation of the addresses allows the flagging of anonymous records for the people resident in Flying Start eligible households but data was not available to allow the flagging of specific families who had taken up the benefits of the Flying Start programme. However, gaining IGRP approval still took eight weeks, mainly due to waiting for individual reviewers to respond. Researchers should be aware that gaining IGRP approval can be a time-consuming, iterative process requiring adjustments to their research proposal. Lessons learned during the implementation of this and the other demonstration projects will be presented in the Lessons
Learned report, which is to follow.
The SAIL Research Environment
2.9 A database “view” is a structured ‘image’ of information stored in the database, including only a subset of the complete dataset. A “view can include data from more than one database, and can be restricted to include specific rows and columns. In this way, the database administrators can very closely control the data with which each researcher is allowed to work. There is, in addition, no way that a researcher can alter the underlying data table providing the “view”.
2.10 The “view”, tailored specifically to meet the requirements of the researcher’s project, is loaded into the SAIL databank by the SAIL technical team. The SAIL technical team members provide the hardware and database management support for
research and are not data analysts. Separating the data management and research analyst functions prevents the need for technical team members to understand the data and for researchers to access underlying data tables or any intermediate stage data. Access to “views” is controlled and restricted to authorised approved
researchers. For the Flying Start project, access was initially restricted to the Author, who is a senior research analyst working in the SAIL databank. Later, access was sought for named WG staff for Quality Assurance purposes.
14 can be copied and pasted out of the gateway, saved to a port or drive on the remote computer, or sent to a printer.
2.12 All analysts who are provided with a SAIL gateway account are given access only after both they and their line manager have signed a detailed agreement outlining the researcher’s responsibilities and the agreed usage that can be made of that account. The agreement clearly places the responsibility with the researcher to ensure that no individual could be potentially identifiable from the research outputs. However, in addition, all potential outputs are scrutinised by a SAIL administrator to ensure potentially disclosive information does not leave the secure gateway.
2.13 The researcher is required to carry out the analysis within the gateway, in which suitable database, statistical, spreadsheet, word processing, mapping and
presentation software are available. The only outputs allowed are summarised or aggregate results. Proposed outputs are processed through the ‘request data out’ link within the gateway. This is the stage at which outputs are scrutinised by a senior research analyst in SAIL, checking for potential disclosure issues such as small numbers. The ‘data out’ process does not check that the analysis has been performed correctly and that results are correct, it merely scrutinises outputs for potentially disclosive situations.
2.14 It is not possible to put a process in place that would stop researchers taking
photographs of a computer screen, for example, or simply writing down results and not following the ‘data out’ procedure. Given this, the researcher must be trusted to adhere to the terms of the SAIL access agreement. However, when signing the access agreement, researchers and their line managers are agreeing to abide by the statement of procedures in the National Statistics Code of Practice: Protocol on Data Access and Confidentiality, in both letter and spirit, to the maximum extent that they apply. Breaches of these rules would result in penalties and legal action. As part of the creation of the UK Administrative Data Research Network, it is
15
3
Methodology
3.1 Flying Start areas were defined by WG from school catchments in deprived areas across Wales. A set of control areas was also defined by WG, based on the areas where the ‘Next Most Deprived’ (NMD) populations were located.
3.2 The Flying Start Eligible (FSE) addresses were generated by the WG Geography and Technology Team and sent to NWIS via Secure electronic transfer. As described in Section 3.1, above, NWIS generated the FSE RALFs and provided them to SAIL via a secure electronic data transfer. The NMD areas were provided to SAIL as a list of Lower Super Output Areas (LSOA); i.e. NWIS was not involved in flagging this Group. The NMD RALFs were established by a “LSOA to RALF” look-up table using the WDS as a template. Extracting both Grolook-ups of households from the complete list of households in Wales created a third Group – households in the “Rest of Wales” (RoW). RoW is a large Group of RALFs i.e. it relates to a large number of residences, and can be used to help identify any underlying change over time that was not associated with Flying Start.
3.3 Linkage of these three Groups of RALFs to the WDS data established which
Anonymous Linkage Fields (ALFs) – or people - were associated with the RALFs – or residences – on specific dates. The WDS holds the address history of the
registered population in the form of dates they moved into and out of RALFs. 3.4 As Flying Start became fully operational across Wales from 1st April 2009, this
Project has used data starting from 1st April 2004. This provided a five year period prior to the introduction of Flying Start to establish baseline rates and trends. Some children aged 3-4 years in 2004 would be born in 2000, which is the earliest year from which complete and robust recording of the health data is available.
16 anonymous people (ALFs) to addresses (RALFs) by virtue of the fact that they were registered as living at the same residence on the same date. So, for example, an unrelated adult ‘lodger’ might change the assumed household structure from ‘lone parent’ to ‘couple with children’. For the purposes of this document we will refer to the three Groups either as FSE, NMD and RoW or as ‘follow-up Groups’.
3.6 For the purposes of this Project, the process described above in Section 3.3 was repeated for each year from 2004 to 2012. This provided data for five years of
follow-up Groups prior to the official Flying Start start date of 1st April 2009, and four further years of follow-up Groups following the introduction of Flying Start.
17 Note on Future Reporting
The RoW is made up of families that contained children aged less than 4 years and who lived in relatively less deprived areas of Wales. The fact that they are living in less deprived areas makes them less useful as a ‘control’ group when attempting to identify the effects of Flying Start. The Next Most Deprived (NMD) Group represents a better ‘control’ group. However, the expansion of Flying Start from 31st March 2013 will introduce the Flying Start
benefits to many of the NMD families. After Flying Start is introduced to an expanded set of areas, many NMD families will become FSE and RoW will become the appropriate ‘control’ group.
3.8 In future years, re-running the analysis will include more recent data about the population of each follow-up Group, e.g. the children aged 3-4 years in the 2004 follow-up Groups will be 16 years old by 2016 and taking their GCSEs, the results of which will flow into the SAIL data set for comparison purposes.
Selection of indicators
3.9 The development of a multi-agency approach to Flying Start was considered key to the effectiveness of the programme and to be instrumental in supporting both children and families, enabling early identification, assessment and referral. Local Authorities in Wales were required to use the Flying Start funding to contribute to the delivery of a set of specific outcomes. Flying Start is designed to look at and improve the home environment as part of health visits, which in turn should manifest itself in e.g. reduced accidents in the home. Another strand is to encourage the use of health services where there is a real need as opposed to leaving the child suffer. Taken together, it is theorised that Flying Start may influence a range of health outcomes. In particular, the enhanced health visiting and access to parenting programmes were theorised by the Author to be likely to contribute to improved healthy behaviours, e.g. reduced smoking during pregnancy, and to improvements in the general health of the FSE population across a range of primary and
18 3.10 Potential health-related indicators for monitoring over time were chosen according
to:
Whether they matched a specific Flying Start indicator (see Table 3.1, below).
Whether they were theorised to align with Flying Start outcomes e.g. ‘Flying Start Children to be Healthy and Thriving’, even if they did not match a specific Flying Start indicator, or related to information Local Authorities were expected to collect as part of Flying Start performance management arrangements3.
Whether health events occurred in sufficient numbers (i.e. it would be difficult to demonstrate any significant change over time using events experienced by very small numbers of people). The project has utilised hospital data, which is an all Wales database within SAIL, and GP event data, which is based on a sample of participating GPs and covers around 47% of the population of Wales.
Appendix 5 describes in greater detail the indicators selected for the analysis. The list of Flying Start outcomes and indicators mapped against the Project indicators is shown in Table 3.1, below. The list of Project indicators is shown in Table 3.2, below. The findings are reported in Chapter 6.
19 Table 3.1 Flying Start Outcomes and Indicators mapped against Indicators
analysed for this Project
Flying Start Children are Healthy and Thriving
Indicator 1: Percentage of Flying Start children reaching or exceeding their developmental milestones at 2 years.
Although this has been collected since 2012-13 on regular monitoring forms, individual level information was not available for linking when this Project was undertaken.
Indicator 2: Percentage of Flying Start children reaching or exceeding their developmental milestones at 3 years.
Although this has been collected since 2012-13 on regular monitoring forms, individual level information was not available for linking when this Project was undertaken.
Indicator 3: Percentage of children fully immunised
at their fourth birthday As we discuss in greater detail below, further development will be required to finalise this indicator; for this Project, the following are reported:
Percentage of children receiving their MMR1 by 13 months of age and by 3.5 years of age
Percentage of children receiving their MMR2 by 3.5 years of age
Percentage of children receiving their first 5 in 1 vaccination by the age of 3 months Indicator 4: Percentage of Flying Start children
breastfed at stages up to 6 months. For this Project, percentage of mothers breast feeding ‘at birth’ and ‘at 8 weeks’ have been analysed as the closest available indicator. From 2012, the new data definitions for breastfeeding have been introduced, which will lead to the 10 day and 6 week data being improved for future reporting years.
Flying Start Families are Capable and coping
Indicator 1: Percentage of Flying Start Children presenting at A&E department as having unintentional injuries in the home
Hospital activity for babies aged <1 year: number of Injury and poisoning admissions. For future reporting years, injuries to
children aged under 4 years can be reported.
Indicator 2: Percentage of Flying Start children who
20
Need. underway, so that this indicator can be
added for future reporting years. Indicator 3: Percentage of Flying Start Children on
the Child Protection Register As for previous indicator, this can be added for future reporting years.
Flying Start Children are Reaching Potential
Indicator 1: Percentage of eligible children taking up Flying Start Childcare and who are registered and started in a Flying Start setting.
Data is not currently available for this indicator.
Indicator 2: Proportion of Flying Start children registered to start Foundation Phase as measured by the number of 3 year old Flying Start children on school rolls.
This indicator relates to Foundation Phase, which replaced KS1 from 2011/12. Data will become available on Foundation Phase in future reporting years
Indicator 3: Percentage of Flying Start children achieving Step 3 or above entry assessment in Foundation Phase.
This indicator relates to Foundation Phase, which replaced KS1 from 2009. Data will become available on Foundation Phase in future reporting years. For this Project, the indicator relates to the previous Key Stage 1 indicator:
21 Table 3.2 Summary of Indicators Reported for this Project
Source Dataset Indicator name and description*
National Community Child Health
Database
Maternal Smoking during pregnancy:
Percentage of mothers by category of smoking status (non-smoker, current smoker, ex-smoker, unknown)
Gestational age:
Percentage of pre-term (less than 37 weeks duration) births
* Teenage mothers:
Percentage of teenage mothers (aged <20 years) at birth of first child
Birth weight:
Percentage of low birth weight babies (<2,500 grams)
* Breast feeding at birth:
Percentage of mothers reporting ‘at birth’ that they planned to breast feed
* Breast Feeding at 8 weeks:
Percentage of mothers recorded as breast feeding their babies at 8 weeks
* Immunisations:
Percentage of children receiving MMR1 by 13 months and 3.5 years of age
* Immunisations:
Percentage of children receiving their MMR2 by 3.5 years of age
* Immunisations:
Percentage of children receiving first 5 in 1 vaccination by 3 months of age Welsh Demographic
Service Infant mortality rate: The number of babies who died before the age of one year per 1,000 live births**
Patient Episode
Database Wales Hospital activity indicators for infants aged <1 year: The number of:
Admissions for All Causes
Admissions for All Emergencies
Infectious disease emergency admissions
Respiratory condition emergency admissions
*Injury and poisoning admissions
Continued overleaf …
22 GP Practice Data Interactions with primary care for children aged 0-12 years
The number of interactions for:
Respiratory conditions
Infectious diseases
*Injuries and poisonings in children aged 0-12 years Preventive procedures4
National Pupil
Database Attainment at Key Stage 1: * Percentage of 7 year old children meeting the expectation that they would attain level 2 in each subject at KS1
* items relate to specific Flying Start Indicators or performance management targets. ** based on WDS death record, not verified using ONS death notification.
3.11 For some of the indicators listed in Table 3.1, relatively small changes were found between years. Other indicators display a high level of volatility over time because the numbers of events taking place in any single year are very small. To help in identifying whether there has been a significant change over time and whether it is associated with the introduction of Flying Start, where small changes or small numbers were found, the average percentages are compared for the two sets of grouped years 2004-08 and 2009-12.
3.12 Areas were not randomly assigned to the eligible (FSE) and control (NDM) groups. For the purposes of evaluation, the process of randomising areas (or individuals, in some studies) into either an intervention group or a control group is usually done in order to ensure, to a high degree of confidence, that there are no systematic
differences between the groups in terms of both observed and unobserved socio-demographic characteristics; the one difference between the groups would be receipt of the intervention, making it a relatively simple matter to identify any
intervention effect. In the absence of randomisation, it was to be expected that both observable and unobservable differences in characteristics would exist between the two groups.
3.13 The key difference we expected to see was that the FSE areas were selected to be the most deprived and the NDM areas the next most deprived community school catchment areas within each LA. At point of writing, no individual-level deprivation
4“Preventative Procedures” are routine examinations that can be carried out on children as they grow and develop e.g.
23 information and relatively little information about individual socio-demographic
characteristics was available in SAIL5. Nevertheless, analysis was undertaken to compare the Groups in terms of area deprivation (WIMD tenth) and their age and gender profile as the best available indicator of whether systematic differences existed between the two groups.
3.14 Where more detailed analysis of the differences between the two Groups cannot be completed, care must be taken when assessing whether any changes observed represent an effect of the intervention. Due to the limited project scope, the lessons learned about data quality, the developmental nature of the methods and the
limitations outlined above, all of the findings presented in this Report should be viewed with caution.
3.15 Work is continually underway at SAIL to improve the general understanding of the data it receives. With such large datasets it is impossible to entirely quality assure every aspect of a data set prior to its use in research. Even where the data are perfectly clean, the Project has been experimental in nature and strictly
circumscribed in scope and, had time permitted, would have benefited from additional testing of the extent to which findings were sensitive to the analytical assumptions made.
5 Through the creation of the Wales Administrative Research Centre, it is hoped to gain access to
24
4
Address matching and defining populations
Address Matching results
4.1 This section describes the results of the address-matching process and the
demographic characteristics of the resulting three Groups of anonymous families in Wales containing children aged less than 4 years, using 2009 as an example year. 4.2 Choosing the populations from the anonymised addresses was a two stage
process, starting with defining the full set of RALFs in the Flying Start Eligible, Next Most Deprived and Rest of Wales areas. From the full sets, the subsets of RALFs where eligible children (aged less than 4 years on target dates) were living were established.
4.3 Anonymisation of the FSE addresses by NWIS provided SAIL with 139,137 (99%) matched addresses and 1,215 (1%) non-matched addresses. This means that 99% of the Flying Start eligible addresses provided by WG had been successfully
supplied with a RALF to allow linkage to other address-level data in SAIL. However, a further 1.6% (2,000 households) did not have any people living in them who were registered in the WDS data set. This issue remains unexplained and further
investigation is underway with NWIS.
4.4 The Next Most Deprived (control) Group was defined by WG as a list of LSOAs. All RALFs in these LSOAs were selected from the anonymised WDS address dataset held by SAIL, so did not involve NWIS. The “LSOA to RALF” linkage provided a set of 131,408 RALFs, based on postcodes that were current at 1st April 2009. The RALF to ALF linkage then reduced the list of RALFs to include just those homes where eligible families were residing, based on the presence of at least one child aged less than 4 years on the 1st April of each year of the Project.
4.5 Comparison of FSE and NMD RALFs indicated an overlap, with 67 RALFs
25 of RALFs from which the populations were selected was 139,039 for FSE, 131,408 for NMD, which left 1,012,967 for the rest of Wales.
4.6 As part of the quality assurance for the analysis, the geographical distribution of the RALFs was calculated by counting the number of RALFs per LSOA and aggregating these up to Local Authority level. The resulting distribution is included in Appendix 6. The analysis confirmed that all Local Authority areas in Wales are represented in each of the three populations. Across Wales as a whole, similar numbers of RALFs are included in the selection of NMD as is the case for the FSE.
4.7 Subsets of these RALFS were then selected for each year from 2004 onwards. The full population (all ages) living in the selected eligible subsets of RALFs is included in each of the follow-up Groups.
Characteristics of the Project Groups
4.8 Population subgroups were defined for the years 2004 through to 2012 for
26
Figure 4.1 Population Pyramid for Families with Children Aged Less Than 4 Years by Project Group
4.9 All three population Groups contain large percentages of women aged 20-44 large percentages of men aged 25-44, small percentages of teenagers and relatively small percentages of people aged over 44 years. This is consistent with what we would expect for households containing a child aged less than 4 years. As we would also expect, all three Groups have similar proportions of children aged 0-5 years. However, the FSE Group contains a higher proportion of people aged 5 to 29 years compared with both the NMD and RoWs Groups, and smaller proportion of people aged 30 years and above. The FSE Group is therefore a ‘younger’ population compared with the RoW. This is not surprising, when the RoW, by definition, is made up of the least deprived households that nevertheless contain children aged less than 4 years, since we know that the average age at which women have children tends to increase as socio-economic status increases.
27 females in the FSE Group for 2009. Similar proportions occur in all the annual
follow-up Groups from 2004 to 2012. The size of the 2009 follow-up Group shows that the NMD Group has the smallest population, with just over 14,100 fewer people than the FSE Group. Figure 4.1b, below, shows the total population of Wales
[image:28.595.66.506.433.552.2]divided using the Project Group definitions and into the same population groupings. These are the total populations from which families with children aged 0-4 have been drawn.
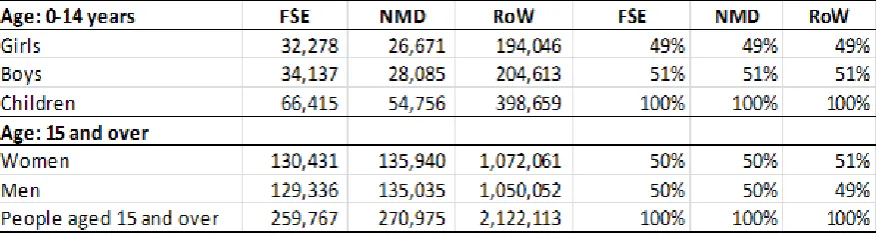
Table 4.1a Total population of Families with Children Aged Less Than 4 years in 2009, split by 0-14 year olds and those aged 15 years and older
Table 4.1b Total population of Wales in 2009 by Project Group, split by 0-14 year olds and those aged 15 years and older
4.11 The FSE Group (i.e. households containing a child aged less than 4 years)
represents 2.1% of the total population of Wales, the NMD Group represents about 1.6% and the RoW Group 10.9% of the total population of Wales. Households with children aged less than four years therefore make up about 15% of the total
28 4.12 The FSE, NMD and RoW Groups were compared in terms of the Welsh Index of
[image:29.595.65.426.326.549.2]Multiple Deprivation (WIMD). The 2008 version of WIMD was used because this was the closest to the time when the Flying Start programme started in 2009. Although more detailed analysis could be undertaken to compare the Groups in terms of the individual WIMDdomains, this was not possible within the limited scope of a demonstration project.The LSOAs of Wales were ranked by overall WIMD score and divided into equal tenths of population6. Figure 4.2, below, shows the proportion of the FSE, NMD and RoW Group populations that fall into each of these tenths. The data presented are for 2009, but a similar distribution is seen in the Groups from 2004 to 2012.
Figure 4.2 Total population of Families with Children Aged Less Than 4 years in 2009 by tenth of WIMD Score
4.13 As expected, a large proportion (58%) of the FSE Group is from the most deprived tenth of Wales, and 87% of the FSE population lies within the three most deprived tenths. The NMD population is more evenly distributed across the more deprived tenths, with only 18% in the most deprived tenth and just over half of its population (53%) in the three most deprived tenths. The RoW has only a 5% representation in the most deprived tenth and 24% in the three most deprived tenths. This does
6 The alternative way to split the Groups would be by tenths of deprivation score, which, because of the
distribution of scores would give a very small first and tenth decile of populations and make
29 indicate that the NMD are a more deprived group than the RoW, but that it is a significantly less deprived Group than the FSE Group.
4.14 Figure 4.2 illustrates that the selection of the FSE Group included some people living in areas classified as less deprived according to WIMD, and that some
families living in areas classed as being among the most deprived in Wales are not included in the FSE Group. Area based indicators such as WIMD assign the area characteristics to everyone living in that area, which is an over-simplification of the situation on the ground. In future studies, particularly if we were able to flag the actual families in receipt of Flying Start interventions, could also attempt to include some individual or household indication of deprivation. Such studies would give a much better idea of the true magnitude of the differences between the Groups, and therefore the effectiveness of the interventions.
4.15 This chapter has demonstrated the selection of a specific subsection of the
population of Wales (families with children aged less than 4 years). Three Project-specific comparator Groups have been established based on anonymised
30
5
Findings
5.1 The objectives of the Project were to demonstrate that linked, anonymised, routinely collected data can:
provide a retrospective baseline against which the impacts of an intervention can be measured;
be used to identify the impacts of an intervention by:
demonstrating differences amongst population subgroups; and demonstrating changes or trends in indicators over time.
This chapter compares the Flying Start Eligible, the Next Most Deprived, and the Rest of Wales population Groups in terms of the indicators listed in Table 3.1, above. Findings relate only to the specific, longitudinal Project Groups (or ‘cohorts’) created as described in Chapter 3, so are not designed to serve as a report on the health of the population of Wales and will not be comparable to whole-population estimates of e.g. health service use.
5.2 As discussed in Chapter 3, the analysis is longitudinal so we expect to see change over time in each indicator in the absence of any intervention. What we are looking for in terms of identifying an impact of Flying Start, is a, ‘excess’ change over time in the Flying Start Eligible (FSE) Group over and above any change that is observed to be happening anyway. In order to ‘control’ for the underlying change over time, we are using the Next Most Deprived (NMD) Group as our ‘control’ group. Since the NMD Group is, as discussed above in Chapter 4, slightly less deprived than the FSE Group, we expect to see relatively poorer findings for the FSE Group than for the NMD Group before the introduction of Flying Start. Since the majority of Flying Start services were being delivered by 2009, we are looking for an improvement in the indicators for the FSE Group that is greater than any improvement observed in the NMD Group and that begins in or after 2009.
31 indicators relate to the number of consultations for various conditions, this may mean that an increase in consultations is a positive impact of Flying Start. Where we might expect to see a mixture of increasing consultations due to better use of health services and decreasing consultations due to improvements in health, it may therefore be more difficult to identify a meaningful impact. However, any trends that are identified will nevertheless be meaningful.
5.4 The findings relate to two kinds of data. Firstly, to administrative health records relating to the whole population of Wales and secondly to administrative data on GP events, which relates, as discussed in Chapter 3, to about half the population of Wales.
5.5 We checked whether any ‘excess’ changes we did observe were big enough for us to be confident they did not happen purely by chance – such changes are referred to as ‘statistically significant’ or ‘significant’7. Other findings where a consistent effect over time was observed, but where that effect was not big enough to reach the level of statistical significance, are nevertheless worthy of note so are reported but using the phrase ‘the data suggests’. The analysis compared the average rate for each indicator in the FSE Group for the period before the introduction of Flying Start (2004-2008) with the average rate for the period after Flying Start began (2009-2012), adjusting for any underlying change in population health using the NMD Group.
5.6 As discussed in Chapter 3, some indicators suffer from small numbers and for others relatively small changes over time make it difficult to demonstrate a
statistically significant difference that can be attributed to Flying Start. In addition, where this Project has used data about eligibility for, rather than receipt of,
enhanced Flying Start services, it is likely that any true effect of Flying Start is being diluted by the presence in the analysis of those who were eligible but who did not receive services.
7 The significance testing used a 95% confidence interval, so we can be confident that such findings
32 5.7 Table 5.1, below, summarises the findings. As noted above, due to the experimental
nature of the methods, the limited scope of the project, all findings must be viewed with caution.
Table 5.1 Summary of Findings
Indicator Finding
Maternal Smoking in pregnancy Data was only 25% complete but the proportion of women giving up smoking during pregnancy increased significantly in the FSE Group after Flying Start. However the proportion who reported smoking also increased significantly in the FSE Group, suggesting that these findings may be at least partly explained by improved recording of smoking status. No significant effect of Flying Start can therefore be identified.
Percentage of pre-term births The percentage of pre-term births: the data
indicates a significant decrease in pre-term births in the FSE Group after the introduction of Flying Start. Percentage of teenage mothers (aged <20
years) at birth of first child The data indicates a significant decrease in first births to teenage mothers in the FSE Group after Flying Start. Although the decrease appeared to begin in 2008, a continuing trend downward from 2009 suggests some form of Flying Start effect. Percentage of low birth weight babies (<2,500
grams) A statistically significant reduction was observed in the number of low birth weight babies born to the FSE Group after 2009.
Breast feeding ‘at birth’ For both indicators, the data show a small increase in all Groups so no increase can be attributed to Flying Start. As with smoking, the level of recording of breast feeding also increased over time and may partly explain the rising rates.
Breast Feeding at 8 weeks:
Infant mortality No conclusive finding due to small numbers. Immunisation - % receiving ‘5 in 1’ by the age
of 3 months No observed impact of Flying Start.
Immunisation - % receiving first MMR: before 13 months
before 3.5 years of age No observed impact of Flying Start; No observed impact of Flying Start; Immunisations – percentage of children
receiving their second MMR by 3.5 years of age
33 Hospital activity for babies aged <1 year:
number of:
Admissions for All Emergencies
Infectious disease emergency admissions
Respiratory condition emergency admissions
Injury and poisoning admissions
Admissions for ‘signs and symptoms (not otherwise classified)’
A small overall decrease was found in all Groups, so when adjusting for the decrease in NMD it was not possible to identify any
noteworthy change in the FSE Group.
No clear pattern, but, the figures for 2012 show a reduction in the FSE Group not seen in the other two Groups. Further years of data would be required to establish if this is the beginning of a significant downward trend.
No clear pattern.
The data show a statistically significant decrease in the FSE Group.
Due to small numbers findings are inconclusive. Primary care interactions for children 0-12
years: number for:
Respiratory conditions
Infectious diseases Injuries and poisonings
Preventive procedures
The data is likely to be biased, including data for fewer GP practices in more deprived areas. Nevertheless:
there was a statistically significant increase in consultations in FSE compared with NMD and RoW; this may partly be explained by parents seeking help for conditions that might previously have gone untreated;
no clear pattern;
the data suggests a slightly greater decrease between 2004-08 and 2009-12 in the FSE Group compared with the NMD Group;
the data suggest that the number of consultations for the FSE Group increased after 2010 to bring them more in line with the numbers seen in the NMD Group.
Percentage of 7 year old children meeting the expectation that they would attain level 2 in each subject at KS1
Data was only available for 2004-08 so it was only possible to make baseline comparisons between the three Groups. Fewer children in the FSE Group attained the expected level at KS1 compared with NMD and RoW.
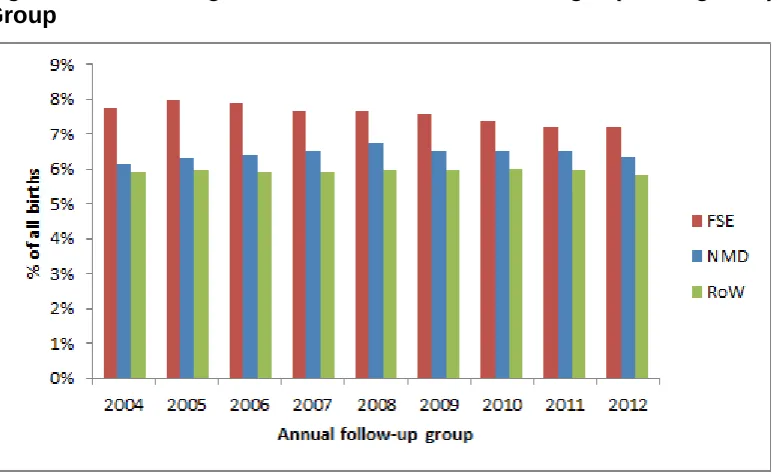
Indicators from the National Community Child Health Database (NCCHD) 5.8 These indicators relate to data collected from a number of sources during the
34 Maternal Smoking in Pregnancy
5.9 Maternal Smoking is based on a question asked by Community Midwives at the ‘initial assessment’ of a newly pregnant woman. Around 75% of the records do not have a recorded value (for further discussion, see Appendix 5). Because the data on smoking in pregnancy was only complete for around 25% of cases, we have no way of knowing whether, for example, smoking status was better recorded if women were smokers or ex-smokers so that all the ‘missing’ cases are more likely to be non-smokers. The analysis for this Section is based on all births (i.e. including those cases for whom the data is missing); this is because by selecting only those cases for whom smoking status was recorded, the graph would be telling us more about the differences in ‘missingness’ than about smoking status. However, the key point for this indicator is that, when this Project was undertaken, the data quality was not sufficient to allow us to be confident in making conclusions about any real
differences.
5.10 Figures 5.1 to 5.3, below, do show differences between the three Groups in the percentage of births where the mother was recorded as having been a smoker and a non-smoker. The percentage of FSE mothers who reported smoking during pregnancy was consistently twice that for the RoW, and the percentage in the NMD Group was consistently 2% to 3% higher than in the rest of Wales (see Figure 5.1). On average, there were 9% fewer non-smokers in the FSE Group than in the RoW Group and 4% fewer non-smokers in the NMD Group compared with the RoW Group (see Figure 5.2). This is as we would expect based on the relative
deprivation of these population Groups and what is known about smoking in Wales. 5.11 The percentage of births where the mother reported giving up smoking during the
35 this effect is likely to be explained by improved recording, so no significant effect of Flying Start can therefore be identified.
Figure 5.1 Percentage of babies whose mother reported smoking during pregnancy
Figure 5.2 Percentage of babies whose mother reported they were a non-smoker
[image:36.595.64.434.402.632.2]36 Figure 5.3 Percentage of Babies whose Mother Reported Giving Up Smoking
During Pregnancy by Project Group
Pre-term Births
5.12 The annual percentage of births occurring at a gestational age of less than 37 weeks for the three Groups over the period 2004 to 2012 is shown in Figure 5.4, below8. On average over the whole period around 1 percentage point more pre-term babies were born in the FSE Group than in the NMD and RoW Groups. Comparing the average percentages for the years 2004-08 with the years 2009-12, there is a larger reduction (0.5 percentage point) for the FSE Group compared with both the NMD and the RoW Groups (both show a 0.1 percentage point reduction). Using the reduction in the NMD Group to allow for underlying change in the population, the data indicates a significant decrease in pre-term births in the FSE Group from 2009 onwards.
8 These percentages are based on average figures of 227 pre-term births per annum in NMD, 317 in FSE
37 Figure 5.4 Percentage of Babies Born at a Gestational Age of <37 Weeks by Project Group
Teenage Mothers
5.13 The percentage of teenage mothers (aged less than 20 years) is shown in Figure 5.5, below. The graph shows that for 2004, the percentage of births to teenage mothers in the FSE Group was more than double that for the RoW Group, with the NMD Group lying midway between the two. The percentage has steadily reduced in all three Groups since 2009. The drop in births to teenage mothers when comparing the average for 2004-08 and for 2009-12 was 5.3% for the FSE Group, 1.7% for the NMD Group and 1.1% in the RoW Group.
5.14 There are two reasons for these changes. The number of births per annum was rising by about 2% per year (3% in FSE and NMD), and the number of teenage mothers was falling in Wales (by about 0.1% per year for NMD and RoW and 0.4% for FSE). Nevertheless, the data indicates a significant decrease in first births to teenage mothers in the FSE Group after the introduction of Flying Start. Although the decrease appeared to begin in 2008, a continuing trend downward from 2009 suggests there may be some form of Flying Start effect. However, it should be noted that teenage conceptions have also been falling in poor communities in England where there was no Flying Start9, so further analysis, possibly using further years of
38 data, would be required to examine the extent to which any Flying Start effect is being seen.
Figure 5.5 Percentage of Births to Teenage Mothers by Project Group
Low Birth Weight
5.15 The percentage of low birth weight babies born for each Group over time is shown in Figure 5.6, below. In the years 2004 to 2012 the Group with the highest
39 Figure 5.6 Percentage of Babies with Low Birth Weight (<2500 grams) by Project Group
5.16 As noted above, we are analysing relatively small percentage changes so in order to help in identifying a trend, the average percentage has been calculated for the years 2004-08 and 2009-12. For the FSE Group, the average percentage for the period 2009-12 was 0.4 percentage points lower than for the period 2004-08. A corresponding reduction is not seen in the NMD and RoW Groups. Allowing for the underlying population change seen in the NMD Group, a statistically significant reduction was observed in the number of low birth weight babies born to the FSE Group after 2009.
Breast Feeding ‘at Birth’
5.17 The percentage of babies whose mothers reported breast feeding ‘at birth’ was lower in the FSE Group than the NMD Group and both were lower than in the RoW Group across the whole Project period. In all three Groups there was a small increase in the average breast feeding rate in the period 2009-12 compared with 2004-08 (see Table 5.2, below) However, there were also increases in the
40 Table 5.2 Percentage Point Changes in Breast Feeding at Birth Between 2004-08 and 2009-12 by Project Group
FSE NMD RoW
No Yes Not
known No Yes known Not No Yes known Not
% % % % % % % % %
Average rate 2004-08 50 32 18 41 42 17 34 46 20
Average rate 2009-12 52 35 13 43 47 9 37 52 11
Percentage point
difference 2 3 -5 3 5 -8 3 6 -9
Breast Feeding: ‘at 8 weeks’
5.18 Breast feeding at 8 weeks is shown in Table 5.3, below. For all three Groups, the average percentage of women breastfeeding before Flying Start (2004-08) was slightly lower than the average following the introduction of Flying Start. The
proportion of missing data is also consistently higher than for ‘breast feeding at birth’ and the proportion of missing data has decreased for the same two time periods. So, as with breastfeeding at birth, we can’t be sure whether the change is real or due to better recording and will certainly be partly explained by better recording rather than real changes in breastfeeding practices.
Table 5.3 Percentage Point Changes in Breast Feeding at 8 Weeks between 2004-08 and 2009-12 by Project Group
FSE NMD RoW
No Yes Not
known No Yes known Not No Yes known Not
Average rate 2004-08 45 14 41 45 19 35 37 21 42
Average rate 2009-12 51 15 34 51 22 27 44 23 33
Percentage point
difference 5 2 -7 6 2 -9 7 2 -8
Infant Mortality
[image:41.595.54.556.515.637.2]41 calculation is commonly carried out in public health using ONS births data but WDS has been used because it is the data set that has been chosen to measure the population for the purposes of this Project.
5.20 As the number of infant deaths is (thankfully) small (averaging 9 children per year in Wales for the period 2004-12), a comparison has been made between figures for the 5-year period of 2004-08 and the 4-year period of 2009-12. Deaths were higher in the FSE Group than in the other two Groups. Although there was a small
reduction of 0.14 deaths per 1,000 live births in the FSE Group in the period after the introduction of Flying Start, the absolute numbers are very small and this issue is complicated by the issue of late death reporting10, so it is not possible to
demonstrate any effect of Flying Start on Infant Mortality.
Immunisation
5.21 Vaccines are administered on the basis of a rolling programme of different vaccine courses over time. Which course of vaccine a child received will depend on the timing of their vaccination and which programmes were being rolled out at the time (e.g. some children will have received their ‘first’ MMR vaccination from the course of treatment designated for ‘second’ MMR treatment). For each child, the ‘course’ of vaccine e.g. MMR, is recorded against the immunisation date, rather than the
specific jab e.g. MMR1 or MMR2. This introduces uncertainty into the calculation of immunisation rates by age, as described below. However, the evidence suggests that uptake of immunisations is lower in more deprived areas of Wales11.
5.22 For this Project, the ages by which vaccine uptake has been analysed were chosen as within the first year of life as a national target, and as 3.5 years as an
approximation for pre-school school status, on the basis that Flying Start objectives are about enhancing ‘preparedness for school’. For future reporting years,
immunisation uptake can be reported by single year of age and for all Flying Start Eligible children (i.e. all children ages under 4 years).
10 Deaths involving coroner’s inquest are not reported in ONS mortality records until after the coroner’s verdict. This can
delay death registrations by up to two years.
42 Diphtheria, Tetanus, Pertussis, Polio and H.I.B. (‘5 in 1’) Vaccine
5.23 The ‘5 in 1’ vaccine protects babies from Diphtheria, Tetanus, Pertussis, Polio and Haemophilus influenzae type B (HIB). It is one of the first vaccinations that babies receive. It is administered in three doses, at 2, 3, and 4 months. We have included babies in this analysis according to the earliest recorded date for a vaccination, and calculated their age on the date of immunisation, for the ‘5 in 1’ course that was introduced in 2004. Figure 5.7, below, shows the proportion of babies in each Group that had received this vaccination before the age of 3 months (or 90 days). The rates are very high (e.g. for 2012, 94%, 92% and 96% respectively in the NMD, FSE and RoW Groups). In 2004, the rates are low because the ‘5 in 1’ was introduced part way through the year, so some babies were treated using the previous
[image:43.595.69.469.420.718.2]vaccination. The graph shows a consistent difference of around 4% between FSE and the RoW from 2005 onwards. There is no observed impact of Flying Start on this indicator.
Figure 5.7 Percentage of Babies Receiving their First ‘5 in 1’ Vaccine within 3 Months of Birth by Project Group
43 Measles Mumps and Rubella (MMR) 1
5.24 The Measles Mumps and Rubella vaccine is administered in two stages, the first dose (MMR1) being ideally administered before the age of 13 months, and the second dose (MMR2) ideally being administered before the child goes to school, and certainly before the age of 5 years. Two main courses of vaccine have been identified in the data for each of these two doses, but a further ten codes were found, relating to measles, mumps and rubella immunisations singularly or in paired combinations. It is also apparent, as noted above, that the first vaccine some
children received was recorded as ‘MMR2’, so there are some confusing elements to the data. The analysis looks at the uptake of MMR1 and currently ignores the smaller numbers of children recorded as receiving other vaccination courses. 5.25 Figure 5.8, below, shows the percentage of babies receiving MMR1 by the age of
13 months. There has been considerable change in the percentage of children receiving this immunisation by age 13 months, dropping from over 20% to around 5% in the middle of the decade and rising sharply since 2010. This may reflect public distrust of the vaccination but could also be due to changes in the delivery of this vaccination over time such that children started to receive it at an earlier age. There certainly appears to have been a change in 2011 and 2012 when
44 Figure 5.8 Percentage of Babies Receiving their First MMR Vaccination before 13 Months by Project Group
5.26 The percentage of children receiving MMR1 by the age of 3.5 years (i.e. pre-school)
45 Figure 5.9 Percentage of Babies Receiving their First MMR Vaccination before 3.5 Years by Project Group
Measles Mumps and Rubella (MMR) 2
5.27 A similar process to that adopted for MMR1 was followed in analysing MMR2. This vaccination should occur before the child starts school. Taking the age of 3.5 years as the mid-point of 3 year olds, the percentage of children receiving MMR2 was calculated. The results are shown in Figure 5.10 below. In all three Groups, there was a rising trend in uptake until 2009 and then a reducing trend until 2012. It
should be noted that there were two other courses of immunisation called ‘additional MMR’ being administered at this time and it may be that some people were
immunised using these courses instead. Further analysis would be required to determine this and could not be completed within the limited scope of this Project. 5.28 However, using data that is limited to one of several possible immunisations, the
46 Figure 5.10 Percentage of Children Receiving their Second MMR Vaccination by 3.5 Years by Project Group
5.29 Between the ages of 3.5 and 5 years, the uptake in all three Groups was similar for each year, with over 90% of children being immunised with MMR2 (table not
shown). Hospital Activity
5.30 In Wales, there are around 16,000 hospital admissions every year of babies aged less than 1 year. The overall admission rate (i.e. for any cause and for all Wales) per 100 babies aged less than 1 year is provided in Appendix 5. The data show a step change after 2007 which appears to be due to changes in the recording of ‘other’ admissions, i.e. not emergency or elective spells of care, but maternity and transfers between hospitals.
5.31 For the purposes of this report, the analysis has concentrated on emergency admissions in babies aged less than 1 year,which reflect the acute events that Flying Start interventions would hope to reduce through the provision of
preventative support. Every year, there are around 11,000 emergency admissions
47 Figure 5.11 All Emergency Admissions of Babies Aged Less than 1 Year by Project Group
5.32 A slight reduction (2 percentage points) in emergency admissions for all causes was found in the FSE Group between 2009 and 2012. However, there was a greater reduction in the NMD Group (4.5 percentage points) over the same time period, so it was not possible to attribute any effect to Flying Start. It is possible that a greater reduction in the FSE Group might have been offset by a positive, increased use of services. It is also possible that where health issues arise e.g. out of hours, the NMD Group may have been more likely to consult a GP, while the FSE Group may have attended A&E. Further monitoring as time goes on may help us to understand these kinds of changes.
Emergency Admissions for Infectious Diseases
48 Figure 5.12 Emergency admissions for Infectious Diseases in Babies Aged Less Than 1 year, by Project Group
5.34 The admissions rate is higher among the FSE Group compared with the NMD Group; both are higher compared with the RoW until 2009, when the rate for the NMD and RoW became similar. The graph indicates a fairly constant trend over this time period for all three Groups with some annual fluctuation. Although no clear impact of Flying Start is suggested by the data, the figures for 2012 show a
reduction in the FSE Group not seen in the other two Groups. Further years of data would be required to establish if this is the beginning of a significant downward trend.
Hospital Admissions for Respiratory System Diseases
49 Figure 5.13 Emergency Admissions for Respiratory Conditions in Babies Aged Less Than 1 year by Project Group
5.36 Annual rates of admission for respiratory conditions are higher across the whole period of 2004 to 2012 for the FSE Group compared with the NMD Group; both are higher compared with the ‘Rest of Wales’ (RoW). The rates of admission are very variable over time, with, for example, admissions for both the FSE Group and the ‘rest of Wales’ rising between 2010 and 2011 then falling in 2012, while annual rates for the NMD Group fall from 2010 to 2011, then rise in 2012. Where these rates are so variable, it is difficult to identify any trend that might be worthy of note.
Injury and Poisoning
50 Figure 5.14 Emergency Admissions for Injuries and Poisoning in Babies Aged Less Than 1 year, by Project Group 2004-12
5.38 The main cause of injury and poisoning admissions was head injury (e.g. 55% in 2012). The numbers are relatively small so, as can be seen in Figure 5.14, above, the annual rate is a relatively volatile measure. The rate of admissions for ‘Injury and poisoning’ seems to have been decreasing to some degree across the whole Project Period in the FSE Group and there is a decrease in the annual rate of admissions from 2009-12 for all three Groups. Nevertheless, the decrease in the FSE Group between 2009 and 2012, even taking into account the underlying
population decrease seen in the NMD Group, was found to be statistically significant 5.39 The analysis for this Project was limited by the fact that if children up to age 4 years
had been included, only children born in 2008 or before would have been old enough (by 2012) to be included. For future reporting years, further work will be required to refine this indicator and to complete the analysis for children aged under 4 years; when sufficient data becomes available in future years, this would provide larger numbers and therefore more robust analysis.
Hospital Admissions: Symptoms, Signs and Abnormal Clinical Findings’