Rochester Institute of Technology
RIT Scholar Works
Theses
Thesis/Dissertation Collections
6-1-2000
A Theoretical model showing the effects of the fuel
induced gamma effect
Bryan Bordeleau
Follow this and additional works at:
http://scholarworks.rit.edu/theses
This Thesis is brought to you for free and open access by the Thesis/Dissertation Collections at RIT Scholar Works. It has been accepted for inclusion in Theses by an authorized administrator of RIT Scholar Works. For more information, please contactritscholarworks@rit.edu.
Recommended Citation
A
THEORETICAL MODEL SHOWING THE EFFECTS OF THE
FUEL INDUCED GAMMA EFFECT
Bryan A. Bordeleau
Mechanical Engineering Department
Rochester Institute of Technology
Rochester, NY
A Thesis Submitted in
Partial Fulfillment of the
Requirements for the
Degree of
MASTER OF SCIENCE
InMechanical Engineering
Approved by: Professor
_
Dr.
A.
Nye, Thesis Advisor
Professor
-Dr. F. Sciremammano
Industry Sponsor
_
L. Markle
Dr. S. Kandlikar, Dept. Head
Professor
DEPARTMENT OF MECHANICAL
ENGINEERING
COLLEGE OF
ENGINEERING
ROCHESTER
INSTITUTE OF TECHNOLOGY
2000
Copyright Information
This volumeisthepropertyofthe
Institute,
buttheliterary
rights oftheauthor mustberespected. Passages must notbecopied orcloselyparaphrased withoutthe previous
written consent ofthe author. Ifthereader obtainsany assistancefromthis volume,heor
she must give proper creditin hisorherown work.
The
following
persons,whose signatures attesttheiracceptance oftheaboverestrictions,haveusedthis thesis:
PERMISSION TO REPRODUCE
Thesis Title: "A Theoretical Model
Showing
theEffectsoftheFuel Induce GammaEffect"
I,
Bryan A.Bordeleau,
hereby
grant permission totheWallace MemorialLibrary
oftheRochester Institute of
Technology
toreproduce mythesisinwholeorinpart.Any
reproduction can notbeusedcommerciallyorforprofit.
Forward
Ithas beena
long
anddifficultprocesstocompletethis thesis.Many
long
hoursandlatenights have beenspentresearchingand writing, anditallhas beenworthit. This
period oftimehasalsobeen difficult forthose aroundme,especially formy friend and
loving
wife, Carrie. I'd like to thankher verymuch, for givingme allhersupport,love,
and
kindness,
andforhelping
meevery stepoftheway.Also Iwouldliketo thankmy MomandDad foralltheirsupport.
They
havegiven me guidance,encouragement,and understanding.
They
have instilled inmethedeterminationtosucceedinallthatI do.
Aspecialthanksgoestomygrandparents, whohave always supportedmy dreams
and goals.
Withoutthe
help
andknowledgeofLee Markle andPaulVanBrocklin,
atDelphiAutomotive
Systems,
thisproject wouldhavenever gotten offtheground.And
finally,
Iwantto thank"Doc"Nye,
forallhishelp
and guidance. WithoutNomenclature
Symbols
As
Surface Area[cm2]
b y-interceptof aline
[cm]
B Bore
[cm]
Bp
Bisection MethodproductC,
K Constantscp Specific heatat constant pressure
[kJ/kg-K]
Cv Specific heatat constant volume
[kJ/kg-K]
E Total
Energy
[kJ]
h Specific enthalpy
[kJ/kg]
or cylinderheight[cm]
hx
Heattransfercoefficient [kW/mK]
U
Latent heatof vaporization[kJ/kg]
m Mass
[kg]
M Molecularweight
[kg]
P Pressure
[kPa]
Q
Heattransfer[kJ]
Qxy
Heattransferbetween states x andy[kJ]
r Radius
[cm]
rv Compressionratio
R Gas constant
[kJ/kg-K]
Ru
Universal gas constant[kJ/kg-K]
T Temperature
[K]
u Specific internal energy
[kJ/kg]
U Internal energy
[kJ]
V Volume
[cm3]
w Work
[kJ]
x, y Graphicalcoordinates
[cm]
Acronyms BDC CA DI-G FIGE KE LIEF PE TDC
Bottom Dead Center
CrankAngle Degrees
Direct InjectionGasoline
Fuel Induced GammaEffect
Kinetic
Energy
Laser Induced ExciplexFluorescence
Potential
Energy
Greek Letters
A 'Hotto 7
Change
Otto cycleefficiency Specificheatratio
Subscripts
air In-cylinderair
ave Average
calc Calculated
clear Clearance
cyl Cylinder
data Experimental data
f Final
fuel Evaporated fuel
i Initial
loss Loss duetoleaks
max Maximum
min Minimum
resid Residual
s SlopeorSurface
tot Total
TableofContents
COPYRIGHT INFORMATION II
FORWARD IV
NOMENCLATURE V
Symbols v
Acronyms v
Greek Letters vi
Subscripts vi
ABSTRACT X
1. INTRODUCTION 1
2. THE THEORY AND HISTORY OF FUEL INJECTED INTERNAL COMBUSTION ENGINES 3
2.1 Thermodynamic Theory 3
2.1.1 The First LawofThermodynamics 3
2.1.2 Ideal Gases 4
2.1.3 Heat Transfer 8
2.1.4 Work 10
2.1.5 The Otto Cycle 11
2.2 Fuel Injection Devices 18
2.2.1 Carburation 18
2.2.2 Port Fuel Injection 19
2.2.3 Direct Injection 20
3. STATE-OF-THE-ART FUEL QUALITY MEASUREMENT TECHNIQUES 22
3.1 Fiber Optic Spark Plug Probe 22
3.2 The Optical Engine 23
3.3 The Argon Ion Laser Technique 23
3.4Laser-Induced Fluorescence 24
3.5 The Fuel Induced Gamma Effect 25
4. DEVELOPING ASIMPLE,INEXPENSIVE TECHNIQUE 26
5. THEEXPERIMENTALSETUPAND PROCEDURE 29
5.1 Setup 29
5.2 Procedure 31
6. DETAILED ANALYSIS OF THE FIGE MODEL 33
6.1 Introductionto theModel 33
6.2 DevelopingandCalibratingtheModel 33
6.2.1 Effective ClosingAngle 38
6.2.2 Mass Loss 38
6.2.3 HeatTransfer 43
6.2.4Residuals 48
6.2.5Puttingit AllTogether 49
6.3.1 Fuel InjectionandtheFIGE Process 52
6.3.2
Deriving
theEvaporatedMass Equation 537.RESULTS 58
7.1 FIGEDevelopment 58
7.2 FIGECalibration 61
7.3EvaporatedFuel Mass Calculation 64
8. CONCLUSIONSANDRECOMMENDATIONS 68
8.1 TheMotoringCase 69
8.2 The Fuel Injection Case 71
8.3 Evaporated Fuel Mass 72
REFERENCES 76
APPENDIX A. MASSLOSS CALCULATION 77
APPENDIX B. RESIDUAL MASS CALCULATIONS 78
TableofFigures
Figure 2. 1 ApVDiagramof10kg ofAir 7
Figure 2. 2Schematicof aPiston-Cylinder Assembly 15
Figure 2. 3 AFour-StrokeEnginepVDiagram 16
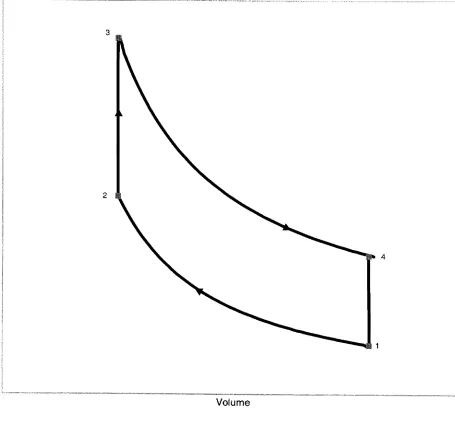
Figure 2. 4 The Otto Cycle 17
T7rnimr.fi ITTTrrn rirmnnrmnrrnnFtnwr)T,.,nn,M M
Figure 6. 2 Mass Lossas aFunctionofIn-CylinderPressure 42
Figure 6. 3 Heat Transfer Coefficientas aFunctionofCrank Angle 47
Figure6. 4 FIGE Process Flow Including Losses 51
Figure 7. 1 apVDiagramofFIGE Motoring Data Without Losses 59
Figure 7. 2 Percent ErrorinPressureas aFunctionofCylinder Volume 60
Figure 7.3 ApVDiagramofFIGEMotoring Data Including Losses 62
Figure 7.4 Percent ErrorinPressureas aFunctionofCylinder Volume Including Losses 63
Figure 7.5 ApVDiagramofFuel Injected FIGE Data 65
Figure7.6 Percent ErrorinPressureas aFunctionofCylinder VolumeforFuel Injection...66
Abstract
The Fuel Induced Gamma Effectuses pressuredatafromasingle-cylinder
direct-injectionengine andinformationaboutthe specificheatratio, gamma,oftheinjected fuel
topredicttheevaporatedfuelmassin thepiston-cylinder assembly. Thermodynamic
theory
andidealgaslaws are usedtocalculatetheoreticalpressure withinthecylinderandthispressureis thencomparedtothe actual pressure measuredintheengine. The
difference ingammabetweenthecalculated and actualstates ofthefuel isthen usedto
predicthowmuch fuel hasevaporatedinthe cylinder.
Thissimplistic approach also takesinto accountinformation abouttheresidualsin
the cylinder, massloss fromthe system, andheat losses.
Combining
thesefactorswiththermodynamic
theory
resultsin averyaccurate model which can predicttheevaporation1. Introduction
Thecost offuel has risen significantlyoverthepastfew decades. This has driven
theautomotive
industry
todevelop
cheaper and more efficientinternalcombustionengines. Onesuchdevelopment isthegasolinedirect-injectioninternal combustion
engine. This
technology
offersimproved fuel economy andfeweremissions.Also,
thepower outputofthis typeof engine will remainthesame as orpotentially improveover,
current portfuel-injectedengines. There aremanyaspects ofthis typeof combustion
technology
thatwill needtobeaddressedinorderfor ittomeetits fullpotential.Theconcept ofpredictingthe amount offuelpresent atthe timeofignition has
beenstudiedinrecent years. A simple,inexpensivetechniquethatisvalidformost
engine configurationshasyettobedeveloped. Thegoal ofthis study is tousetheoretical
equations and asimple engine setupto
develop
an evaporation profile oftheinjected fuel fromthetimeofinjection untilignitionoccurs.The Fuel Induced Gamma Effect technique,
FIGE,
was chosenforthis studybecauseofits simplicityandbecauseothertechniquesonlyprovided subjective results.
The FIGEprocess canbeused todeterminetheevaporation profile offuel injectedinto
anyengine. Itis notinfluenced
by
theinjection spraypatternor engine configuration.Previoustechniques usedcostly laser
imaging
equipment and were very difficultandtimeconsumingtoimplement. The FIGEtechniqueis simplebecauseitcanbeused onany
direct-injectionengine equippedwith a pressuretransducer.
Inthepresentwork,pressuredata fromasingle-cylinderdirect-injectionengine
andinformationaboutthe specificheatratio of
isooctane,
theinjectedfuel,
will beusedpredictthein-cylinderpressure ateverycrank angle. The specificheatratiois calculated
attheseconditions and comparedto thecalculated specificheatratiobasedontheengine
testresults. The difference intheseratiosis thenusedtocalculate themass of evaporated
fuelpresentinthe cylinder. Thesecalculations canbeperformedon a crank angle
by
crank anglebasis. Theresultis a graphical representation oftheevaporation profile. The
profile canthenbeusedto predictwhenignition should occur orthe liquidtovapor ratio
ofthefuelatthe timeofignitionif ignition does occur. This informationwill leadto
2.
TheTheory
andHistory
ofFuelInjectedInternal
Combustion Engines2.1
Thermodynamic
Theory
Internalcombustionengines usethecombustion offueltoconvert chemical
energy intomechanicalwork output. To accomplishthis, thechemicalenergymustfirst
beconvertedto theinternal energyofthegaseous medium. Thisinternalenergy,in turn,
isconvertedtomechanical work output. Theconversionin thefirststageis dependent
uponthe typeoffuelthatisused and canbequantifiedusingabombcalorimeterto
measure the
heating
value, orenthalpyofformation. Thermodynamicprocesses canbeusedtomodelthesecond stage; theseprocesses willbeexplainedin detail.
Furthermore,
once a combustion cycleis modeledusing thermodynamics, itcanbecomparedtoa real cycle. Ifthe theoreticalmodelaccuratelypredicts real engine
cycles, itcanbeusedtooptimize engine performance parameters. Atheoreticalmodel
willbe discussedtogive abetter understandingoftheprocessesinvolved inthe
combustion cycle.
Parametersimportanttoengineperformanceinclude air/fuelratio,
timing
offuelenteringthe cylinder,andignitiontiming. Engines haveuseddifferentsystemsto
introduce fuel intothecylinder,
including
carburetors,portfuelinjection,
anddirect fuelinjection. The
history
ofthesesystems will alsobe discussed later inthissection.2.1.1
The
First Law ofThermodynamics
A basic knowledgeofthermodynamic
theory
is necessarytocompletelypoint forthismaterial. The FirstLaw statesthat thetotal changeofenergywithin a
systemisequal tothenetenergytransferredtothe system
by
heattransferminusthenetworkdone
by
thesystem. Thiscanbewrittenin equationformasAE= Q-W
(2-1)
where
AE=AKE+APE+AU
(2-2)
andAKE is thechangein kineticenergy,APEisthechangeinpotentialenergy,AUisthe
changein internalenergy,
Q
is heattransfer tothe system, andW is theworkdoneby
thesystem.
Thechangeintotalenergyof asystem,
AE,
ismadeupofthreecontributions,asshown above. Thechangein kinetic energy isassociated withthemotion ofthesystem
as awhole,relativeto an external coordinateframe. Thechangeingravitational potential
energy is associated withtheposition ofthesystem as a wholeintheearth's gravitational
field. Internal energy isan extensivepropertyofthesystem andincludes all otherenergy
changes (Moranand
Shapiro,
1995).2.1.2 Ideal
Gases
Ideal gases areanintegralpart ofthestudyofthermodynamics andthusplayan
importantroleincombustion enginetheory. An ideal gasisafictitioussubstanceinthe
gaseous phase whose proportionaldependence at constant volume oftemperature on
pressure holds forallpressures (Moran and
Shapiro,
1995). The idealgas equation ofstate relatesthesequantities:
pV =mRT
where
r=r/m
(2-4>
and
Ru
isthe universal gas constant andM isthemolecularweight ofthesubstance."The idealgas equation of stateis obeyedapproximately
by
a real gas whose pressureisnottoolarge andwhosetemperatureisnottoolow
-that
is,
adilute gas"(Moranand
Shapiro,
1995). Inthecontext ofthis paper,allgasesbeing
studied willbeassumedtobeidealgases unless otherwise stated.
The ideal gas equation of state allows forthedetermination of one variablein
terms of all others. Since most processes occur with afixedmass ofgas,
knowing
two oftheremainingthreewilldeterminethe third.
By
choosingpressure and volume asindependentvariables, the temperaturecanbe determined. These states canbe
represented on a p-Vdiagram. Figure 2.1 shows a p-Vdiagram forair.
Fourtypesofprocesses canbeshown on a p-Vdiagram. Avertical line
representsa constant volumeprocess, whichis calledisochoric.
Similarly,
ahorizontallinerepresentsa constant pressureprocess,which iscalledisobaric. Thecurve
represented
by
anisothermalprocess (constanttemperature) dependsontheequation ofstate ofthesystem. Anadiabaticprocess,as will be discussed
later,
is oneinwhichthereis noheattransfertothesystem. Thecurveitproducesis entirely dependentonthe
system.
Another importantapplication oftheidealgas equation of state is fora constant
mass system. Fora constant masssystem, the
following
relationapplies^
=CwhereCisconstant. This isusefulin
determining
successive values ofp,V,
orTinaprocessbecause
PjVj =
PfVf
< CD 90
-1
S 801
%1
% 1 81
'P (T=300
K)
- - P (T=600
K)
70
-1
*60
1
*1
*1
9 50\
l
1 * 1 * 40 -1\
V 30 20 -10 -n*<sm
"*** ^^ SS85Hu msmm "8 8HS SSS jjjgf j
50 100 150
Volume(cm3)
200 250
[image:18.545.67.480.77.442.2]2.1.3
HeatTransfer
Heattransfer to andfroma system canbecalculatedinseveraldifferentways.
Those important to thecontent ofthispaper willbediscussedhere. Convectionis
describedas
being
theenergytransferbetweena surface and afluid movingoverthesurface (Incroperaand
Dewitt,
1996). The heattransferrateisproportionalto thedifference intemperaturebetweenthe surface,
Ts,
andthefluid,
T,
multipliedby
thearea,As. The proportionalityconstantistheconvectiveheattransfer coefficient, hj.
Writteninequation
form,
thisisQ
=hTAs(Ts-Tj
(2-7)
where
Q
istheheattransferby
convectionbetweenthesurface andthefluid.Inthis study,heattransfer
by
convection occursbetweenthe cylinder andtheair/fuelmixtureinthecombustion chamber. Asecond mode ofheattransfercanbe
defined
by
a changeintemperatureof a substancedueto the addition ofheatto thatsubstance. Before startingadiscussiononthis second mode ofheat transfer, it is helpful
todefineseveral parameters.
Thesum of specificinternal energyandtheproduct of pressure and specific
volumeisaquantityoftenrequiredforthermodynamiccalculations. Thisquantity,
h,
isdefinedas:
h=u+pv
(2-8)
andiscalled specificenthalpy. "Thespecificheatof asubstanceis theheatrequiredto
increasethetemperatureof1
kg
ofthesubstanceby
1 K" (Keller,Gettys,
andSkove,
1993). Theprocess
by
whicha substance changestemperaturewilldirectly
influenceitsconstantpressure,cp, andspecificheatatconstantvolume, cv. For ideal gases,cp andcv
aredefinedas follows:
3"
(2-9)
(2-10)
vdT
dh
Cp~dT~addition,
Cp~cv=R
(2-11)
Thequantitiescp(T) andcv(T)are functions oftemperature; ifthevariationis small over
thetemperaturerange
they
canbe assumedtobeconstant. Theconstant value canbecalculatedas follows:
\cv(T)dT
cv~
Tf
-Tth
(T)dT T,
cp-77
~T:(2-12)
(2-13)
(Moran and
Shapiro,
1995).The last quantitytobedefined istheratio of specific
heats,
y.y=-L
(2-14)
v
Anotherpoint worthnoting inthis section relatestomultiple gases. When several
gases arecombinedinan enclosedarea,theproperties ofthemixtureare acombination
sum ofthepartial pressures oftheindividualgases. As with all otherintensive
properties,thespecific heat isnota simple summation. The
following
formulaapplies:(2-15)
<t
~
v
i
wherezisthepropertyinquestion,the subscripttis thecombined valueforthatproperty
andthesubscriptiistheproperty foreachindividualgas.
When heat istransferred toa substance and causes atemperaturechange,itcanbe
defined usingspecificheats. If heat isadded
during
a constant pressureprocess, theamount ofheat is defined
by
Q
=mcpAT.(2-16)
Fora constant volume processthedefinitionis
Q
=mcvAT.(2-17)
Somereal processes occur so quicklythata negligible amount ofheatis added.
Thistypeof processis called adiabatic. Thecompression stroke of aninternal
combustion engine canbe approximated as
being
adiabatic.Keller, Gettys,
andSkove(1993)
haveshownthatforanadiabaticprocessusing anidealgaspV7=K
(2-18)
whereKisconstant.
2.1.4 Work
"Workis energy transferredbetween a system anditsenvironment
by
meansindependentofthetemperaturedifferencebetweenthem"
this study, the workdonewillbecaused
by
theexpansionoftheworkinggasin a pistoncylinderassembly. Inthiscase workis defined as
' 2
W =
jpdV
(2-19)
The workdone
by
a process accordingtothisequationisthe area underthecurve on ap-V diagram. Foranisobaricprocess, theworkwillbeequalto theproduct of pressure and
changeinvolume. The workdone
by
anidealgasduring
an adiabaticprocessisWr
PV 1ir
i
7-1
1-'
V.
^"'
V
n
(2-20)
Thesubscripts iand/denotetheinitial andfinal states,respectively.
Workcanbeeither positive or negative.
During
a volume expansion processwork will alwaysbepositive. Fora compression processthe oppositeistrue. As willbe
seen moreclearly in latersectionstheworkdone
during
a complete cycleis theareabetweentheexpansion and compression curves on a p-Vdiagram.
2.1.5
TheOtto
CycleThematerialpresented sofar inthispaperhas beenprovidedtoaidin
developing
thecriteria
forjudging
theperformanceof aninternalcombustion engine. To furtherthisdevelopmenttheAir-StandardOtto Cyclewillbepresented. TheOttocycleisa
theoretical modelused as abasis forcomparisontoa sparkignition engine.
Areciprocatinginternalcombustionengineisthesystemmodeled. Figure 2.2 is a
cylinderfittedwith valves and a spark plug. Several importantterms arelabeledonthe
schematic. The bore isthecylinderdiameter. The strokeis thedistance thepistontravels
from bottom deadcenter(maximumcylindervolume) to
top
dead center(minimumcylindervolume). Theminimum cylinder volume at
top
deadcenter(TDC)
iscalledtheclearance volume. As thepistonmovesfrom bottom dead center
(BDC)
toTDC itsweeps througha volume whichis known as thedisplacementvolume. Thecompression
ratio oftheengineisthevolume atBDC divided
by
thevolume atTDC. Thecrankmechanism converts thereciprocatingmotionofthepistoninto rotarymotion, whichis
theuseable work output.
The internalcombustion engines
being
modeled operate withfour distinctstrokesduring
twocomplete revolutions ofthecrankshaft. Some engines run onatwo-strokeprocess,butthesewill notbe discussed. Figure 2.3 shows a p-Vdiagram foratypical
four-strokeprocess. The start ofthecyclebegins withthepistonatTDC. The intake
valveopens andthepistonmoves
downward,
drawing
ina combustible charge oftheair/fuelmixture; thisistheintakeorinductionstroke. Withbothvalves closedthepiston
moves upwardcompressingthecharge, inthecompression stroke. This also raisesthe
temperature. Thecombustion processbegins
by firing
thespark plug. Thecombustioncreates a
high-temperature,
high-pressuregasmixture, whichexpands andforcesthepistondownward. This is definedas thepower stroke. ThepistonmovesbacktoTDC
withtheexhaust valveopen, purgingtheburntgasesfromthecylinder. This is knownas
theexhaust stroke.
TheAir-StandardOtto Cycleattempts tomodel thecompression and power
accurately,aninstantaneousheatadditionprocess occurring atTDCreplaces the
combustion process. The Ottocycleis shownin Figure 2.4 on a p-Vdiagram. The four
processesshown are asfollows:
1-2 isentropiccompression of airthrough thecompression ratio
2-3 heataddition at constant volume,
Q23
3-4 isentropicexpansionof airto original volume
4-1 heatrejection at constant volume, Q4i.
Efficiency
is definedasthework outputdividedby
theheatadditionduring
thecycle. Forthe Ottocycle the efficiency, rjotto, is
W
riotto=
(2-21)
FromtheFirst
Law,
AW=AQ,
neglectingchangesin kinetic and potential energy.
Therefore W=
Q23
-Q41,
sor)oao=^~
(2-22)
W?23Since airis
being
considered asanidealgas with constant specificheats,
Q23=mcv(T3-T2)
e41=/ncv(r4-r1)
(2-23)
Forthe twoisentropic processes, TVrl
isconstant; therefore
Z2-=ZL
=ry-i
(2-24)
7i
T4
and
r\otto^^
(2-25)
By
specifying thecompression ratio andusing a constant y, theefficiencyof a real enginecanbeapproximated.
The Otto Cycle has beenpresentedto aidintheunderstandingoftheprocesses
usedtomodel an internalcombustion engine. Themodelhelps to simplifythestudyof
parkPlug
vaive
TopDeac Center
Stroke
Bottom
Dead Center J,
Reciprocating
J
MotionCrank
Mechanisi
clearance
Volune
[image:26.545.142.344.59.270.2]iRotary
Motion3 w CO 0
[image:27.545.59.524.60.420.2]Volume
CD
CO CO
CD
[image:28.545.57.512.65.487.2]Volume
2.2 Fuel Injection Devices
Spark-ignitioninternalcombustionengines create power andtorque.
Introducing
differentamounts of a combustible mixtureintothecylindersoftheengine can regulate
thesequantities. A fuel injectoror a combination of acarburetorandthrottlevalve isused
tocontrol thismixture.
Completecombustionrequiresa stoichiometric mixture offuel and air. This
means thatan exact airtofuelratio isrequiredtoobtain complete combustion ofboth
products. Therearedifferenttypes ofdevicesthataidin obtainingtheproper mixture.
Thesearethecarburetor andthefuel injector. The fuel injectorinjects fueleither
directly
intothecylinder(direct
injection)
orinto aninletmanifold(indirector portfuel injection).Carburation and portfuel injectionwillbe
briefly
discussedto give generalbackground information. The detailsofdirect injectionwill alsobe discussedtofurther
theunderstandingofthemostdifficultand mostimportantaspect ofthisstudy.
2.2.1 Carburation
Thecarburetorwas one oftheearliestdevicesusedtointroduce fuel intothe
cylinder.
Initially
itwas a mechanicaldevice,
but has evolved and changedin design sinceitsintroduction.velocityoftheair
flowing
to thenarrowestsectionincreases;
asthecross-sectionincreases thevelocity decreases. Dueto theBernoullieffect,the increased velocity
causes a decrease inpressure. Fuel jetssubjectedto thislowerpressure supply fueltothe
engine. This is dependentupontherate of airflow andtheextent ofthedecreasein
pressure. Thethrottle valve again controlsthese quantities.
Thereare somedisadvantages to using carburetors. Carburetorsrelyon pressure
differences,
yet atmospheric pressureisnot a constant quantity.Any
variation will causediffering
supplies offuels for similarthrottleandloadconditions. Another disadvantageis thatmultiple carburetors areinstalled inordertooptimize aerodynamic performance.
Multiplecarburetorinstallationswillimproveaerodynamic performanceintheinlet
manifold,but thecarburetors thenhavetobe balanced. Eachwillhave toprovidethe
sameflowand mixture strength. AnotherproblemaccordingtoStone
is,
"it isquite usualforcarburetorstogive 5per cent variationinmixture strengthbetweencylinders, even
forsteady-state
operation"
(1992).
2.2.2 Port Fuel Injection
Fuelinjectors weredesignedtooptimizetheperformanceofinternalcombustion
engines. Thepressure
drop
inthe carburetordecreasespoweroutput andthevolumetricefficiencyoftheengine. Theoriginalinjector designwas anentirelymechanicaldevice
with complex two-dimensionalcams. Electroniccircuitshavereplacedthese.
Therearetwo types ofportfuel injection systems:
single-andmulti-point
usedtoinject fuel intothemanifold.
This,
though, canleadtolowerpower outputthanthemulti-pointinjectionsystem. Themulti-pointinjectionsystemismorecostly because
it
typically
hasoneinjectorper enginecylinder, butthesemultipleinjectors makeitmoreefficient. Althoughthetwo types are quite
different,
theoperatingprincipleis verymuchthesame. The differentialpressure acrosstheinjectorcontrolsthefuel flowratethrough
it. The fuel issprayedintotheinletmanifold, whereitcanthenbe introduced intothe
cylinder
during
theinductionprocess.Therearemany benefitstoportfuel injection overcarburation. These are
discussed
by
Newton, Garrett,
andSteeds(1996)
andinclude elimination oftheventuriandthrottle
body
heating,
reduction ofadverse effects offuelmovementinthefloatchamber, lower fuel consumption,higher torque, andincreasedpower output.While
usingacarburetor, fuel may"stick"to thewalls ofthecombustion chamber;thisis called
wall wetting. Thisfuel will notevaporate as quickly causing incompletecombustion,
which causeshigh levels of emissions. Forportfuel injectionwall wetting is less
prevalent. Inportfuel injection fuelenrichment at startup isnotneeded, this tooreduces
emissions.
2.2.3
Direct InjectionMany
automobile makers arelooking
intodeveloping
gasolinedirect injectionengines toreduce engineemissions,toimproveengineefficiency, andtoincreasepower
output. Thistechniqueuses aninjectionsystemto inject fuel
directly
intothecombustionengine. This high-pressure injectionresultsinrapid vaporization and smallerfuel droplet
size. Thesetwofactors improvethecombustionprocess, allowing formore complete
combustion; therefore power outputis increasedand emissions aredecreased.
Although direct injection has been readilyavailablein diesel enginesfor many
years,theconceptofdirect injection ingasoline engines is
fairly
new andhas only beenstudiedin depth for ashortperiod oftime. The leadersofthe automotive
industry
havenot yet standardizedthedirect injectionprocess; thereare manytechniques employedto
accomplishthistypeofinjection. Theelectronic injectorcanbemountedin different
locations
depending
ontheprocesstobeused.Also,
theinjectiontiming
canvarydepending
ontheprocess andtheloadsonthe engine.Therearemany advantagestodirect injection.
According
toFan,
etal.,theseinclude "higherthermal efficiency, highervolumetricefficiency,lower fuelconsumption,
better
driveability,
andbettercold startperformance"
(1999). The disadvantageof a
direct injectionsystem isthatiftheprocess isnot performed correctly,hydrocarbon
emissions willincrease.
In summary,it has beenshownthatthebenefits tofuel injection are much greater
thancarburation. Theprocess of
introducing
fuel intothecylinderhas beenchanged andmodifiedthroughoutits history. Fromtheearly inceptionofthecarburetortothemulti
pointinjectionsystemand nowtodirect
injection,
thefuelsystemhas developedgreatly.New
technology
has beenand willcontinuallyneedtobe developedtomaintain and3.
State-of-the-Art
Fuel
Quality MeasurementTechniques
Variousstudieshave beenperformedto measurefuel spraycharacteristicsfora
directinjection sparkignitionengine. Thesestudiesdeterminedthefuel qualityatthe
timeofignition. Fuel quality istheamount offuelvaporized and mixed with airbefore
ignition. The qualityatignition is a majorfactor
influencing
enginedesign.Varying
thisone parameter canlowerengineemissions,improve fuel economy, andincreasepower
output.
The state-of-the-arttechniques usedtomeasure fuel qualitywillbeexaminedin
thissection. Thetechniquesincludevapor probemeasurements, severallaser techniques,
and atechniquethatuses combustion chamber pressuremeasurements. Althoughthese
techniques areveryuseful,
they
willonly be discussed inminordetail inordertogive aconcisebackground forthis study.
3.1 Fiber
Optic
SparkPlug
ProbeAlger,
et al.(1999)
used afiberoptic sparkplugprobetomeasure vaporconcentration nearthespark plug.Theprobe consisted oftwochalcogenide optical
fibers,
one used as alight source
input,
theother as an output. These fiberswerefitted intoastainless steeltubethatprojectedintothecombustion chamberinplace ofthespark plug.
Insidethecombustionchamberthetubewasfittedwith a mirror. The sides ofthe tube
were machinedaway toallowthefuelvaportoflow
freely
throughthedevice.A lightsourcewas modulatedusing a signalchoppertoproduce asquarewave
theoutputfiber. The lightthatreflectedontothesecondfiber wasless intensethan that
comingfromthefirstfiber becausesome oftheradiation fromthelight was absorbed
by
thefuel vaporinthegap. This change couldthenbemeasuredand correlatedtovaporconcentration.
3.2 The Optical Engine
The majorityoftechniques thatused alaser formeasurement ofthefuel qualityat
ignition also used an optical engine. Theseengineshadsome portion removed and
replaced with a quartz window. Indifferent studies,
depending
onthemanufacturer,thequartz was thecylinderlinerorinthecombustionchamberhead. The designof each
devicewas alsodependent uponthetypeof experiment performed.
According
toC. WilliamRobinson,
thesedevices have beenaround sincethe1970's attheSandia National Laboratory. "The
top
ofthecombustion chamber wascovered with a window made of quartz orsapphire. This largewindow exposedthe
entire combustion chamber"(1996). The design alsoincludedwindows inthe side ofthe
cylindertoprovide accessforthelaser beams. This was, and still
is,
the typicalsetup fortheoptical engine usedincombustion research.
3.3
The Argon Ion LaserTechnique
In 1997 a single cylinderRicardo Hydraoptical engine was used atthe
University
ofWisconsin-Madison toevaluatein-cylinderspraycharacteristics. Thisengine was
(1997)
used an argonion laserand severalcylindrical lensestocreate alasersheet withinthecombustionchamber. The different lenses were usedtoorientthesheetthrough the
windows ineither ahorizontal orverticalfashion.
Withthelaser inplace, ParrishandFarrell
(1997)
couldtakesnapshots oftheinjection spray usinga sophisticated
imaging
system. These imageswere usedto studythespray characteristics. Theresults ofthestudy centered onthein-cylinder spray
distribution andin-cylindergasflow.
They
showedthatalthough asymmetric,hollow,
cone shapedspray wouldbeoptimal, thespraytendedtobemore asymmetricdueto the
highpressuresandhigh in-cylinder fuel flow velocities.
3. 4
Laser-Induced Fluorescence
A studyperformed
by Wolfgang
Ipp,
et al(1999)
usedlaser-induced(exciplex)
fluorescence,
orLIEF."By
means ofLIEFmeasurementstheliquid fuelphase andthefuelvapor were simultaneouslyacquired ontotwo separate
images,
sothat theinfluenceof ambient conditions onthefuelvapor phase and sprayevaporation was visualized".
Thisexperimental setupwas similarto,yet more complexthan,theone used
by
ParishandFarrell. A laserwas usedtoforma sheet, which causedthefluorescenceofthe fuel.
Thecomplexitycameintheformofchoosingthecorrectfuel tocausethefluorescenceof
thefuel in boththeliquid and vapor phases. Inthisstudythenon-fluorescing base
fuel,
isooctane dopedwithbenzeneand
triethylamine,
was used.Theresults showedthat thevapor phase followedtheliquid spraythroughout the
injectionprocess. The studyalsoshowedthat
by
varyingtheinjectiontemperature thefuelgave a visiblereductionoflarge fuel drops. Althoughthis techniquewas not 100%
effectiveinseparating theliquidand vaporphases,it was sufficientfortheevaluationof
thespraycharacteristics.
3.5 The
FuelInduced Gamma
EffectThe finaltechnique tobe discusseduses simple pressuretransducersinsteadof
high-tech measuring devices. The fuel induced gamma effect
(FIGE)
uses thepressuredifference betweenthefueled case andthemotoredcase withoutinjection. "The
techniquerelies onthesignificantdifferenceintheratio ofspecific
heats,
orgamma, offuel fromair or residual
gases"
(Witze,
1999). Witzealso established a parametertomeasurethechangeinpressureduetothevapor-phasefuel:
plGE
fueled
xlQQ P
unfueled
By
collectingpressuredatabeforeand afterinjection for differenttypesofinjection,
Witzequantifiedtheamountof vapor-phasefuel. He utilizeda plot oftheFIGEparameterfor different injectiontimingsandopened-and closed-valveinjection to
findtheoptimuminjectiontiming. Theoptimum occurred whereFIGEwas at a
maximum,which wasthepointwhere thefuel vaporizedthemost.
Thesetechniques are allveryusefulin measuring fuelquality. Some arevery
expensive and require expertiseinthefield. Othersare simple and canbedoneon
standard enginetestsetups withminoradjustments. To
date,
these arethemostwidelyused and mosttechnicallyadvancedtechniques intheautomotive
industry
formeasuring4. Developinga
Simple,
Inexpensive Technique
Many
techniques thatattempttomeasure theamount of vapor phasefuelpresentinthecombustion chamberatthe timeofignitionarecostlyanddifficultto implement.
Thegoal ofthis studyis toresearchand
develop
asimple,inexpensive,
theoreticaltechnique thatwill provide adequate results. This techniquewillbe basedontheFIGE
technique developed
by
Witze. The specificheatratio of air and fuelwillbeusedtodeterminetheamountof vapor phasefuel present
during
thecompression stroke andthisinformationwill beusedtopredicttheignitiontiming.
As the
difficulty
of atechniqueincreases,
thecostofimplementing
that techniquetends to increase. Asimpletechniquewilluse existing,inexpensivetechnologies to
collectdata. This will allow engineers and scientists moretime to verifytheaccuracyof
thedataandtofinda solutionto theproblem. Thealternative wouldbe timespent on
developing
newtoolsand equipmentto collectdata.Thegoalis toprovide adequate results,butwhatdoesthismean? Whatare
adequate results? Inordertodefinetheadequacyofthe results,it is necessarytoknow
whattheresults willbeusedfor. Theresults ofthis studywillbeusedtooptimizethe
combustion processin a gasolinedirect-injection spark-ignition engine. This
optimization willimprovefuel economyandincreasepower output while
lowering
theemissionsfromtheengine.
Injection
timing
willaidinthe improvementandoptimizationofthese threeparameters.
Therefore,
adequate results willdeterminetheinjectiontiming. ThemodelMinoradjustments couldbemade on atestenginetomorecloselyoptimizethe
parameters.
AmodifiedFuel Induced GammaEffecttechniquewillbe introduced inthis
study. There aremanyadvantagesofusing thistechniqueoverthe techniquespreviously
studied. Twoimportantbenefits are cost andaccuracyoftheresults. For manyofthe
earlierstudies,itwas veryexpensiveto
develop
and usethetechniques. Thecost of atechniquedependsonmany things,
including
equipmentcosts,knowledgebase,
andlaborcosts.
Mostoftheearliertechniques used acostly laser formeasurements. Thelaser
also requiredtheresearch anddevelopmentoftheproperlensestofocus thelaser beam
intothenecessarypattern.
Then,
state-of-the-art-imagingequipment was usedtophotograph animageofthespraypattern; this toowas veryexpensive. The only wayto
take thenecessaryphotographs wasto
design, build,
andtestan optical engine. Itisevidentthis that thecost of
implementing
thesetechniqueswas very high.The accuracyoftheprevioustechniques was adequate, although most ofthe
studies showed resultsthat tended tobesubjective. Thesparkplugprobeonlygave
resultsinthearea ofthesparkplug. Allofthelasertechniques gave atwo-dimensional
imageofathree-dimensionalspraypattern. These 2Dpatternsweretheninterpretedto
find 3Dresults. In severaloftheexperimentsthespraypattern wasimaged usingthree
orthogonal viewstoimproveontheaccuracyofthe results, althoughtherequirementof
laser
lighting
onlyallowed one viewtobephotographedat atime. Thismeansthattheaccuracyoftheresults were
highly
dependentupontherepeatabilityoftheinjected fuelThere are several usesforasimple, inexpensivetechniqueto measure vapor phase
fuel in adirect-injectionspark-ignitionengine. Suchatechniquewill providethemeans
toquicklyandeasily
develop
new engines andtoverifyresults fromprevious studies.Thiswillgreatlyincreasetheknowledge baseoftheautomotiveindustry.
Thetheoretical nature ofthemodifiedFIGEtechniquewill allowtheinputof
differentvariablesin such awaythatdifferentengines canbetestedbeforeever
being
built. Iftheresults were promising,a model couldbe builtto test theaccuracyofthe
designandimprovements couldbemade fromthatpoint. This willbemore cost
effectivethan
designing
andbuilding
an engine andthentesting
ittoseeif itwill work.By
usingtheengine setupsthatweredevelopedfortheothertechniques, theresults of aFIGEmodel canbeverified. The oldertechniques may havegiven perfect
results,buttherewas no wayof
knowing
howgoodtheseresults were. Anotherverificationmethod will provideabasis for comparingresults.
Asstatedearlier, theresultsfound inthisstudywill addto theknowledge baseof
the automotiveindustry. Asthisknowledgebasegrows,theproducts thatare made will
be
increasingly
better.They
will uselessfuel,
provide morepower,andbe less harmful5. The
Experimental Setup
and ProcedureThis studyrequiredexperimentation anddataacquisitionfortwoimportant
reasons: tocreate a pressure-volume model of an engine cylinder cycle andtoevaluate
thefinal results ofthismodel. The datacollectedhadtoconsist of values pertinentto the
model,most
importantly
pressure as afunctionofcylinder volume. Itwas alsonecessarytocollect several extra,butnecessary, data
including
initialtemperatureofthesystemandthemass oftheexhaust gases. All ofthedata forthis studywas collected atthe
Customer Solutions CenteratTechnical Center
Rochester,
adivisionofDelphiAutomotive Systems. TheteamatDelphiused well-knownprocesses anddatacollection
techniques forthestudy. Thisallowedthemtheabilitytouseexistingtestsetups with
onlyminor changes. Adetailedexplanationofthesetupand procedurefollows.
5.1
Setup
All oftheexperimentsnecessarytoconductthisstudywere performed on a
Ricardo Single CylinderResearchEngine. Thisenginehada
top
entryreversetumblepistonimpingementDirect InjectionGasoline
(DI-G)
combustion chamber. Thevalvetrainconsisted oftwointakevalves andtwoexhaust valves with overheaddirect acting
mechanicalbuckets. The Delphi MicroDI-G
injector,
which required 10 MPaoffuelpressure, was locatedontheside ofthecombustion chamber. Theenginedisplacement
was 0.3225 L. The dimensionsoftheengine'scylinder were74mmand75mmforthe
bore andstroke,respectively. Severalother relevant engine constants are shownin Table
Max Cyl. Surface
Temp
(K)
533Min Cyl. Surface
Temp (K)
483Engine Speed
(RPM)
1300Cylinder Bore
(mm)
74Piston Head Area
(cm2)
43ClearanceArea (cm
)
54.97ClearanceVolume
(cm3)
31.12Total Volume
(cm3)
356.26Atmospheric Pressure
(kPa)
101 [image:41.545.116.341.52.213.2]Injected Fuel Isooctane
Table 5.1 Engine Constants
Theenginewas testedin Delphi'stestcell
#7,
whichhadthenecessary equipmentfor dataacquisition. ACussins
Technology
enginedynamometerwith coolant and oiltemperaturecontrol was used asthe testbed. Thecombustionair supplywas
thermodynamically
controlled. A30to 122Ftemperaturerange couldbeachieved.The
humidity
couldbecontrolledbetween and 120F dewpoint. Thepressure wascontrolledfrom 70 to 110kPa
(absolute)
with aflowrate ofupto 100 CFM. A5-gallonHaskel Cartthatcouldbepressurizedfrom 0to 12 MPa
(absolute)
suppliedthefuel.Emissionsof
N2, NOx, CO, CO2,
andO2
were measuredusingthePeirburg
technique. This techniquetakestheentire exhaust gas fromtheengine anddilutes itwith
airtoprevent chemical reactions andcondensationinthesample. Samplesthatcorrelate
tovarious
driving
conditions andperiodsoftimearetaken and collectedinbags. Anexhaust emissionbenchis usedtocombinethesample analysisdataandthevolumeof
the sample. The resultingcalculation givesthemass of each component emittedfromthe
testengine.
An inline highpressureMicro Motion sensor measuredthefuelpressure. A
pressure. DSP ACAPversion5.0wasusedforhigh-speeddataacquisitionand
combustionchamber analysis.MicrosoftExcel 97andMicrosoft Visual Basic were used
toretrieve and analyzethedata.
Severalfactorsremained constantthroughout the
testing
process. Theenginespeed was setto 1300rpm. Itis importantto notethat theengine speed variedslightly
throughoutthe
testing
cycle, althoughthevariation was never greaterthan0.5%. Themean speed remained constant at 1300rpm,and was considered constantthroughout this
study. A loadof330 kPa (netmean effectivepressure)was placed ontheengine. The
coolanttemperaturewaskeptat a constant90Cwiththeinletairtemperatureat25C.
Each dataset consisted of 10enginecyclesinwhich cylinder pressuredatawastakenon
a crank anglebasis. Aspart ofthedataset,thecylinder volumecorrespondingto the
crank angle was calculated.
5.2 Procedure
Early
injectiontiming
was studiedbecausetheevaporation ofthefuelwouldbemore evident atthisstageofinjection. Asa result oflowertemperatures atthe
beginning
ofcompression,evaporationwould occur more slowly. Thetestprocedure wastostart
theengine and motoritwhile
injecting
fuel until asteadystate was reached. Atthatpoint, fuelinjectioncontinued andtenfour-stokecycles ofdatawere collected. Asingle
injectionoccurred
during
each ofthesecycles. The injectorwasthen turned off;motoringcontinued and a seconddatasetconsistingoftencycles wascollected. Thetwo
There were tworeasons forcollectingdata inthis fashion. The firstwasto
minimizetheinitialvalue errorsbetweenthe twodatasets. At steadystate, theinitial
cylindertemperaturefor boththemotoringcase and injectioncase wouldbe nearly
identical,
reducing anyeffects of mismatcheddata.Also,
the airinthecylinderafterinjection contained residualsfromcombustion.
Any
difference inpressuredata betweenthe twodatasets caused
by
theseresidual gases was minimized. Thesecond reasonforcollecting data inthismanner wastominimizetheeffects offalse pressure readings. The
pressure ateverypoint was calculated
by
eliminatingthehighestandlowestpressurevalues ofthe tencycles forthatpoint andthen
taking
the average oftheremainingeightreadings. Thisprovided a
"smoothed"
dataset, which couldbemoreaccuratelymodeled.
This smoothing would alsotakeinto accountthefactthat
during
motoring,residualswouldbecleanedfrom thesystem andthemixture wouldtend tobehave likepure air.
Isooctaneactslikeanidealgasinthevaporphase,itwasreadilyavailableinthe
testcell,anditsgammadata iswell
documented;
thereforeitwasthefuel injected into6.
DetailedAnalysis
of theFIGE Model6.1
Introduction
to theModel
Asstatedin Section
4,
thegoalofthis study istofindaninexpensivetechniquetoobtainthemass offuelthathas evaporatedinan engine cylinder priortocombustion. In
ordertoaccomplishthistask,theFuelInducedGamma Effect
(FIGE)
model was created.Thissection willcompletely describetheFIGEmodel.
The FIGEmodel uses thespecificheatratio ofthe air andgaseous fuel (isooctane
inthisstudy)toextractthemass offuelfrompressure and volumedata. Theoretical
equations for ideal gases are usedtomodelthepressure with respecttocylinder volume.
By
comparingtheexpected pressure valuesfromthemodelto theactual valuesfromtheexperiments, adifference is found.
Taking
into account several otherfactorsthatcausepressurevariations, themass ofthefuel canbecorrelatedto thedifferences inpressure.
Thecreationofthemodeltookseveral steps.
First,
themodelhadtobecalibratedtobesurethatitperformedaccurately. Torefinethemodel,factorssuch as mass
loss,
heat transfer,and residualsinthecylinder were added.Then fuelcalculations were
performedtocompletethemodel.
Finally,
themodel wastestedforaccuracy. Thesesteps willbeexplainedin detailthroughout theremainder ofthis section.
6.2
Developing
andCalibrating
the ModelTheFIGEmodelis based upon equations2-5 and 2-18. Theseequations relate
the pressure, volume, andtemperatureofthe air/fuelvapor mixtures to theratioof
compression stroke ofthecylinder was needed. Thesevalues weretakenfromthedata
set provided
by
Delphi and remained constantthroughout theentire study. Twootherdatapoints were neededtobeginmodeling; theseweretheinitialpressure and theinitial
temperatureofthegases inthecylinder. The initial pressure,
Pt,
was extractedfromthedataset atthecorrespondingvolume, V}.
The initialtemperature,
7*,-,
was moredifficulttomeasure. Thiswas becausetherewas no convenientwaytoplace athermocouple insidethe cylinder. Theairinthe
cylinder atbottom deadcenter comesprimarily fromtheintake stroke. The intakeair
comes
directly
fromthe atmosphere,orinthiscase the testcell. Thereforetheinitialtemperaturewas assumedtobetheregulatedtestcelltemperature.
Agraphical representation ofthepressure with respecttovolume wasnecessary
tocreate themodel andcorrelate thedata. Agraphical model wascreated
by
calculatingthepressure atincrementalvolume steps (or ateverycrank angle). Foreachstepthere
was aninitialvalue, orthecurrentvalue ofthe parameter, as well as afinal value, orthe
value atthenextstep. Thesewillbe denoted
by
thesubscriptsiand/,respectively.Thefirst step in calculatingthepressure at point
2,
thefinal volume,wastoassumeafinal temperature,Tf. Forconvenience,thefinal temperaturewas assumedtobe
equaltotheinitial temperature, 7,.
Only
motoring datawasused; forthedevelopmentand calibration ofthemodelthereforetherewas nofuel inthecylinder.
Knowing
both7,
and
Tf,
an average specificheatratio, yave,couldbecalculatedusingequations 2-12through
2-14,
whereC/,(r)=
7.929xl0"14r4
+
9.453xl0~772
-0.00047+1.048
(6-1)
cv(T)=7.929
xl0~1474
+
9.453xl0~772
Theseequationsforspecificheatof air werederived from Table A.4Thermophysical
PropertiesofGasesatAtmosphericPressure (Incroperaand
Dewitt,
1996)
usingthe"LINEST"
functionin Excel.
Then,
by
rearranging2-18,
afinalpressure,F/
couldbecalculated asfollows:
Ptv7
=PfVj
(6-3a)
rv\Y~
Pf=Pi
v%
(6-3b)
where yaveisthevalue calculatedfromequation2-14.
This
Pf
was calculatedusingan assumed value ofTf,
sotherewasuncertainty inthefinalvalue. Averification of
Tf
was needed. Thiswasdone usingequation 2-6.Solving
forTf,
Tf
=J T
(6-4)
1
PV
However,
this calculated7/
maynot equalthe temperatureassumed atthebeginning
oftheprocess.
Now,
7/
replacedtheassumedfinaltemperatureandtheprocess wasrepeateduntiltheassumedfinaltemperatureandthecalculatedfinaltemperaturewere
equal. ThisistheFIGEprocess. Figure6.1 shows theflow ofthisprocess. The FIGE
processwas continuedforeachcrank angle untilthepiston reachedTDC.
Thisprocessis thebasis forthemodel.
Next,
themodel hadtobecalibratedtomatchthedatacollectedatDelphi. Thecalibration couldonly be done
by
matching thedataon a point
by
pointbasis toseeiftheoverallfitwas sufficient. Themeans ofdoing
this wasto findthepercentdeviation fromtheactual value of each calculatedpressure.
%E=
P P
1
calc *data
p 1
data
where
Pcaic
isthecalculated pressure andPdata
isthedatapressure. Thestandarddeviationofthepercentdeviationwascalculatedusing Excel'
s
"STDEV"
function.
By
addingvariousparametersto the model, thestandarddeviation wasminimized,resulting in the
best-fitmodel. The
following
sections willdetail theseparameters andhowthey
wereAssume Ta
Calculate
Pf
usingeqn. 6 3b
Calculate
Ta
usingeqn. 6-4
Yes
Goto next
Volume
step
Let
Ta
=Tf
[image:48.545.137.344.49.399.2]No
6.2.1 Effective
Closing
Angle
Anengine cycleisacomplex cycletomodel;many factors havetobeconsidered
to besurethatthemodel resemblesthephysical cycle. Onesuchfactorthatis important
is thecrank angle at whichthe intakevalvecloses, whichis theeffectiveclosingangle.
Thisis important becausecompressiondoesnotbeginuntilthisvalve is
fully
closed.Asthepiston comes to theBDCposition attheend oftheintakestroke, theintake
valve should close. In realitythisdoesnot occurbecauseof
timing delays,
pressureinthesystem, and various otherfactors.
Instead,
the valve closes shortlyafterBDCandcompressionbegins.
Inorderforthemodeltoperformproperly, thepressureattheeffectiveclosing
anglehadtobeusedastheinitialpressure.Thiscrank angle was usedforthe starting
point ofthemodel. Theeffectiveclosinganglehadtobe determinedor calculated. This
turnedouttobeaverysimpletask.
Using
thedatathathad beencollectedit,
was seenthatafterBDCthepressure remains
fairly
constantfora number of crank angledegrees.Beyondthispointthepressurebegantoincrease. Althoughnotexact, theeffective
closingangle couldbeassumedtobeattheend ofthis constant pressure process. The
effectiveclosingangleis nota constant value andhadtobe determined foreach
subsequentdataset.
6.2.2 Mass Loss
Arealization was madevery early inthis studythat thereare noidealorperfect
inwhich quantitiesof airandfuelwill be lostthroughtheringseals aroundthepiston.
There aretwowaystoapproachcalculatingtheresultingmassloss. The first istousethe
pressuredifferentialsbetweenthecombustionchamber and atmospheric pressure
conditions alongwithinformationaboutthecross-sectional areathroughwhichtheair
andfuelwill leak. Thesecondis toderiveempirical resultsfromthecollecteddata. The
secondmethod, the simpler ofthetwo,waschosenbecause itwould give adequate results
forthis study. The firstmethod couldbedeveloped into afull-scale studyand wouldbe
difficulttopursue.
Several factors hadto beconsideredinorder toderive an equationformassloss.
Thefirstwas a conceptual ideaofhowthe equation shouldbehave. The initialthought
wasthatastheinternalpressure
increased,
whiletheatmospheric pressure remainedconstant,thepressuredifferential increasedandthemass losswouldincrease.
However,
thiswas notaccurate andactuallytheopposite was true, as will beshown.
As thepressure
increased,
theinternaltemperature alsoincreased. Theresult ofthis increasedtemperaturewas anexpansion ofthe
ring
seals.Combining
thisexpansionwiththeincreasedpressure, theareathroughwhich gases couldescape, andthus themass
loss,
decreased. As aresult,asthepressure increasedthemassloss decreasedtoa pointwheretherewas essentiallyno mass loss.
Theproblemthenwastodeterminethemassloss asafunction of pressure. This
wasderived using boththecollecteddataand a variation oftheFIGEprocessas shown
above. Foreach pressuredatapoint collected acorrespondingtemperature was
calculatedusingequation6-4:
PfVfTi
Tf
=J J
(6-4)
PV-Using
thisandtheinitialtemperature,
yairwas calculated. Thenequation6-3 was usedtocalculatePcaic- Withequation2-3 andthefinal values, mcaicandnidatacouldbecalculated
using
Pcaic
andPf,
respectively.By
subtractingthedatamassfromthatofthe calculated,themassloss wasfound. The Visual Basiccodeforthiscalculationis shown in
Appendix A. Figure 6.2 showstheresults ofthiscalculation as afunctionofthedata
pressure.
Excel'
s "LINEST"functionwas usedtogeneratethebest-fitequation to these
results. This isshown here forclarity:
mloss =-3.75x 10"13
P?
+2.58xlO-10^
+1.22xl0"7(6-6)
As canbeseen in Figure
6.2,
beyond approximately 1000 kPathemassloss becamenegative. Itwas atthispointthat themassloss wasassumedtobezero.
Atlowerpressuresthemassloss diagramshows order of magnitude variations in
themassloss. Thisis a result of variationsin thedata andthecalculations performed on
thisdata. The ideal dataset would conformto theidealgasequations, but dueto thedata
collectionprocedures andthenatureofthesystemthisdidnothappen. Theprocess,
being
a pointtopointcalculation, wouldover-estimatethemassloss forone point and atthenext correctforthisextra massand under-estimatethelosses.
By
applyingabest-fitcurveto thecalculated mass
loss,
the errors wouldbeaveraged andtheresultingcurvewouldgive abetterapproximationofthemassloss.
Thisequation, althoughderivedwithmotoring dataonly, was usedforall
subsequentcalculations. There may have beenminimal errorsintroducedbecauseofthis,
buttheireffect wouldbe slightbecause the totalmasslosswas smallcomparedto the
Asecond part ofthemasslossproblem washowto calculatethefuelmassloss.
Thesolution was
fairly
simpleand relied on several assumptionsthatheldtruethroughout thisstudy. The firstwasthat theonly losscame fromvapor; thereforeno
liquid fuel leftthesystem.
Secondly,
whenthefuelevaporateditinstantaneously
mixedwiththeairinthesystem, makingahomogeneousmixture.
Using
these assumptions, themasslosscouldbecalculated. Inthecase ofmotoringthecalculationis simply
mair=mi-mloss
(6"7)
When injectionoccurred, thecalculationbecame more complicatedbecausemioss
wasthe totalmass loss fromthesystem. Thelossneededtobe divided into two
constituents, namely fueland air. Sincethemixture was assumedtobe
homogeneous,
themasslossof each substance wouldbeproportionaltoitspercentage ofthe totalmass.
So,
rmx^
ymtot j
(6-8)
wherethe subscript xdenotesthesubstance andmtotisthe totalmass ofthe vaporinthe
1.5
?.*?
0.5
?? ?
-? ?
?-? Mass Loss
Poly. (Mass
Loss)
E,
CO COOB
16100
-1
[image:53.545.51.517.118.478.2]J-Pressure
(kPa)
6.2.3
Heat TransferAnother factorthatwouldinfluencethe behaviorofthesystemistheheat
transferredbetweenthepiston-cylinderassemblyandthemixture ofliquid fueland
vapor. This heattransferwould cause a changeintemperature ofthe mixture,whichis
animportantparameterintheFIGEprocess. This heattransferproblem was complexfor
tworeasons. Calculationoftheheattransfercoefficientforthecylinder-vaporinterface
was thefirstcomplexity. The second was thatthesystem wasdynamic andthesurface
area was always changing.
The Engineers atDelphi madethecalculationoftheheattransfercoefficient
muchless complex.
They
evaluatedthisparameterfora similar enginein a previousstudy and providedtheresults. Figure 6.3 showsthe results, ortheheattransfer
coefficient with respectto thecrank angle oftheengine. Excelwas usedtocalculate
equation
6-9,
abest-fitapproximation ofthedata;
thiswillbeusedin theremainder ofthe study.
hT
=0.09,
CA<240hT
=2.32X10"7CA3
- 0.00017
CA2
+0.041752CA-
3.39289,
(6-9)
CA>240
whereCA is definedasthecrank anglein degrees.
Before
looking
intothedynamicnature ofthe system,itwasnecessarytoknowtheparameters neededtosolvetheheattransferproblem. Equations2-7 and2-16show
everythingneededto evaluatethechangein temperatureofthefuelvapormixture.
Q
=hTAs(Ts-Tj
(2-7)
The
following
equationistheresult ofcombiningtheseequations andsolving for A7:AT=hTAATs-T)
(6io)
mcp
Thetwounknownfactors werethesurfacearea,
As,
andthe surfacetemperatures, 7*. Thecalculation ofthese variables wasdifficult becauseofthedynamicsofthe system.
Thesurface areaconsistedofthreeregions,two of which were static whilethe
thirdwasdynamic. The area ofthepistonheadwas measuredtobe approximately 43
cm . Thesecondconstant area region was thatofthearea abovethe
top
ofthestrokeintheclearance volume region. The surface areainthisregion wasapproximately 55cm2.
Thesevalues were measured and provided
by
the testengineers atDelphi.Thefinal surface area wasthatofthe walls ofthecylinder. As thevolume ofthe
cylinderchanged, thissurface area also changed. In ordertocalculatethis surface area
some basicgeometric equations of a cylinder were needed. These were:
V=7tr2h
(6-11)
As
=2nrh(6-12)
where Visthecylindervolume, ris thecylinderradius,h is theheightofthecylinder and
As
isthelateral surface area ofthecylinder. Alsonotethatthevolumeintheenginecylinder, that
is,
thevolumeassociated withthecylinder wall surface area,isV
cyl =Vi~Vclear
(6-13)
where
V,
is theknowntotalvolume ofthesystem andVciear
istheclearance volume.By
relating equations6-11 and6-12totheengineandletting
Bequaltheboreofthe engine,itwas clearthat
B r=
Theseequations werecombinedto get
Vt
~Vclear =As
^
(6-15)
Solving
for As:A AWi_^clear)
(6_16)
B
So,
with anygivenvolume,thesurface area couldbecalculated.Eachsurface areathenhadtobeassociated with atemperature. Forthestatic
areasthetemperature was easyto
find;
theengine couldbeprobed withthermocouples intheseareas. Delphiprovidedthesereadings. Thepistonheadareatemperaturewas483
Kandthecylinderheadareatemperaturewas 533 K.
Twoassumptionshadtobemadetocalculatethewalltemperature. The firstwas
that the abovetwo temperatureswere theminimum and maximumincylinder surface
temperatures,respectively. Thesecond assumption was that the temperaturevaried
linearly
from theminimumtothemaximumalongthewall. Fromtheseassumptions,thesurfacetemperatureequation wasderived.
Using
thebasicequation of aline,
y=mx+b
(6-17)
surfacetemperature with respecttovolume couldbecalculated asfollows:
Ts=msV{+b
(6-18)
providedthattheslope ofthe
line,
ms,andthe temperatureintercept,
b,
wereknown.Theslope varied
linearly
fromtheminimumtemperature atthe totalvolumeto themaximum?max
?min
(619)
V , -V
clear rtot
Using
thiscalculated slopetheinterceptcouldbecalculated:b=
Tm^-{msVclear)
(6-20)
Therefore,
theminimum cylinder walltemperaturecouldbecalculated asafunctionofvolume.
Sincethetemperaturevaried
linearly
alongthe wall, the average walltemperaturewas
(mvV,+fc)+7max
Combining
theseequations with equation6-10,
the value of A7 couldbe foundat eachvolumeincrement. Thentheinitial temperaturewas calculatedasfollows:
0.5
0.45
0.4
* 0.35
E
5
_> 0.3
c o
O 0.2b
h-0)
+
CO c m 0.2
i_
H
CO
X 0.15
0.1
0.05
175 195 215 235 255 275 295
Crank Angle
(degrees)
315 335 355 375
6.2.4 Residuals
Once again, thesystem usedinthis studywas notanidealsystem. Ifitwere,
completecombustionofthefuelwould occur. Duetothenature ofthe system,only
partialcombustionoccurred and exhaust and residual gases were expelledfromthe
engine.
Unfortunately,
all oftheseresiduals were not purgedfromtheengineduring
theexhaust stroke. Theresult was a mixture of air and residual gasesinthecylinder. This
hadtobecompensatedfor intheFIGEmodel calculations.
The first step in calculatingtheresidual gases wastomeasurethe amountof
residualsintheexhaust. Thiswasaccomplished
by
usingthePierburg
processduring
theproceduretocollect theemissions fromtheengine. Theresult ofthisprocess was the
mass of each residualfortheentiretestcycle. Inordertoreachthefinal goal of
calculatingthespecificheatratioforthe residuals, thepercentage ofthe totalresidual
mass was calculatedforeach residual gas. Theseincluded
N2, NO, CO, CO2,
andO2.Thespecificheatratio of a substance at a giventemperaturewascalculatedusing
thespecificheatvalues ofthesubstanceatthat temperature.
So,
a percentage oftotalmass was knownforeach residual gas; thispercentage was assumedtoremainconstant
throughout thestudy.
Therefore,
by knowing
the totalmass of residuals withinthecylinder, the specificheatratiofortheresi