M E T H O D O L O G Y
Open Access
Linking land cover and species distribution
models to project potential ranges of malaria
vectors: an example using
Anopheles arabiensis
in
Sudan and Upper Egypt
Douglas O Fuller
1*, Michael S Parenti
2, Ali N Hassan
3and John C Beier
4Abstract
Background:Anopheles arabiensisis a particularly opportunistic feeder and efficient vector ofPlasmodium falciparumin Africa and may invade areas outside its normal range, including areas separated by expanses of barren desert. The purpose of this paper is to demonstrate how spatial models can project future irrigated cropland and potential, new suitable habitat for vectors such asAn. arabiensis.
Methods:Two different but complementary spatial models were linked to demonstrate their synergy for assessing re-invasion potential ofAn. arabiensisinto Upper Egypt as a function of irrigated cropland expansion by 2050. The first model (The Land Change Modeler) was used to simulate changes in irrigated cropland using a Markov Chain approach, while the second model (MaxEnt) uses species occurrence points, land cover and other environmental layers to project probability of species presence. Two basic change scenarios were analysed, one involving a more conservative business-as-usual (BAU) assumption and second with a high probability of desert-to-cropland transition (Green Nile) to assess a broad range of potential outcomes by 2050.
Results:The results reveal a difference of 82,000 sq km in potentialAn. arabiensisrange between the BAU and Green Nile scenarios. The BAU scenario revealed a highly fragmented set of small, potential habitat patches separated by relatively large distances (maximum distance = 64.02 km, mean = 12.72 km, SD = 9.92), while the Green Nile scenario produced a landscape characterized by large patches separated by relatively shorter gaps (maximum distance = 49.38, km, mean = 4.51 km, SD = 7.89) that may be bridged by the vector.
Conclusions:This study provides a first demonstration of how land change and species distribution models may be linked to project potential changes in vector habitat distribution and invasion potential. While gaps between potential habitat patches remained large in the Green Nile scenario, the models reveal large areas of future habitat connectivity that may facilitate the re-invasion ofAn. arabiensisfrom Sudan into Upper Egypt. The methods used are broadly applicable to other land cover changes as they influence vector distribution, particularly those related to tropical deforestation and urbanization processes.
Keywords:Anopheles arabiensis, Sudan and Upper Egypt, Species invasion potential, Irrigation, Land change Modeler, MaxEnt
* Correspondence:[email protected] 1
Department of Geography and Regional Studies, University of Miami, Coral Gables, FL 33124-2221, USA
Full list of author information is available at the end of the article
Background
Unintentional introductions of mosquito vectors into environmentally suitable areas outside their normal ranges have led to establishment of breeding populations and subsequent outbreaks of human malaria and other important mosquito-borne diseases [1-7]. Establishment of founder populations depends on many variables, in-cluding abiotic similarity between source and invaded sites, absence of predators and parasites that may limit vector populations within their normal ranges, lack of rigorous control measures within invaded territories and sufficient sources of blood meals. In addition, mosquito invasion events have been facilitated by human migra-tion, global trade, and international travel and tourism [7,8]. While much recent literature has focused on the spread of invasive species, such asAedes aegypti, Aedes albopictus, Aedes atropalpus that breed in containers, climate change coupled with ecosystem disturbance may also favour the spread of various anophelines to areas where malaria has been eliminated or was previously ab-sent [5,9]. Specific invasion events associated with not-able outbreaks of malaria include the long-distance dispersal of Anopheles gambiae from West Africa to north-east Brazil in 1930, which over a nine-year period produced a major increase in human malaria cases hav-ing an estimated 20-25% death rate [1,6]. Further, in 1943 a major malaria epidemic occurred in Egypt asso-ciated with the spread of An. arabiensis (a member of theAn. gambiaespecies complex) from Sudan along the Nile Valley [1,10]. This particular outbreak produced some 130,000 deaths within a two-year period until suc-cessful control and vector elimination measures were implemented in late 1944 [1]. At that time, the limits of the infestation were known and confined to irrigated areas well to the north of the current study area in Asyut Governorate. This facilitated efficient application of lar-vicidal agents that were used in the successful eradica-tion campaign [1].
Although rainfall and temperature exert critical con-trols over the life cycles of both mosquitoes and Plasmo-dium, changes in land use and land cover may also facilitate (or prevent) the spread of malaria vectors [11-14]. Deforestation in tropical lowland (<500 m a s l) environments has received emphasis in the recent litera-ture, particularly associated with frontier malaria in Latin America where forest has been converted to pas-ture or farmland. For example, numerous studies have established a link between deforestation and abundance ofAnopheles darlingi, which is one of the most import-ant malaria vectors found near tropical forest fringes in the Neotropics [12,15-17]. Irrigation in highly seasonal or arid and semi-arid environments also facilitates estab-lishment and spread of malaria vectors [13,18,19]. Patz et al. [13] postulate that the development of irrigation
and other human-induced changes in surface hydrology that result in slow-moving water are likely to be more significant for vector breeding in regions where malaria is either absent or hypo-endemic, such as in North Africa or India. Over the past several decades irrigated cropland has greatly increased in the Middle East and North Africa, with irrigated area covering an estimated 26 million hec-tares (ha) in 1998. By 2030 irrigated area in the region is projected to increase by 25% to meet local and global food demand [20]. Therefore, it is reasonable that future irriga-tion development will pose a major risk of malaria out-breaks as vectors may disperse from source regions to newly irrigated areas.
Opportunities exist for gaining a more comprehensive understanding of the interactions between environmen-tal change and vector invasion potential using different types of space-time models that can simulate environ-mental change or species distribution [21,22]. Such models can take into account key factors that help to in-crease or isolate vector populations such as climate, physical barriers or corridors such as large rivers, lakes or seas, mountains, vegetation type and distance be-tween suitable habitats [10]. While species distribution models (SDMs) have provided new insights into areas where malaria vectors are likely to encounter suitable habitats, most SDM applications for mapping malaria vectors have emphasized climate as the principal factor that controls potential habitat suitability [18,21-25]. However, some SDMs can accommodate land cover in-formation in discrete form (i.e. land cover classes) and this creates the possibility to link land change models (LCMs) with SDMs to map potential vector distribution driven by anthropogenic changes such as urbanization, irrigation and deforestation. This study demonstrates how LCMs and SDMs can be linked to project future changes in the potential range of An. arabiensis asso-ciated with expansion of irrigated cropland in the Nile Valley of Sudan and Upper Egypt.
conditions in the latter part of this century [27-29]. While the flow of the Nile is influenced primarily by rainfall and water management upstream, coupled GCM-hydrological models indicate that stream flow at Aswan is likely to decline from 2040–2100 and, there-fore, water capture, diversion and irrigation are likely to become even more important strategies to ensure ad-equate food production in Egypt and Sudan [29]. While the climate literature lacks specificity about future sur-face wind directions and speed associated with warming in the 21st century, increased variability and storm events associated with atmospheric warming [28] may enhance opportunities for long-distance dispersal of the vector.
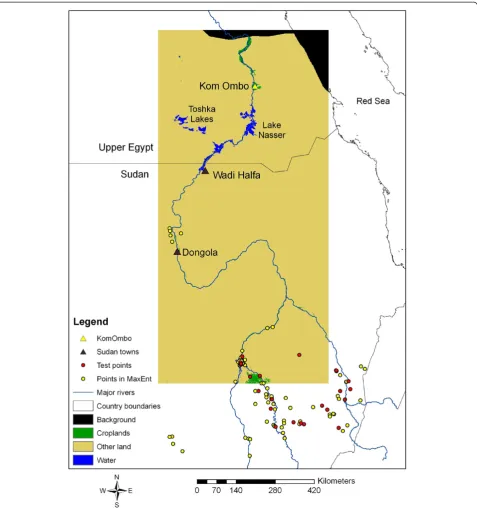
Anopheles arabiensis is particularly adaptive to envir-onmental change and is known to have a wide range of feeding and resting patterns and can adapt quickly to control measures such as indoor residual spraying [30]. Its larval habitats are similar to those ofAn. gambiae al-though An. arabiensis is able to use a wide range of aquatic habitats, including slow flowing, partially shaded streams and a variety of large and small natural and man-made habitats [30]. The northern edge of the dis-tribution of An. arabiensis is downriver beyond Don-gola, approximately 300 km south of the border with Egypt, but occasional incursions of the species have been found as far north as Wadi Halfa [10] (Figure 1). The main hypothesis of this investigation is that the re-invasion of An. arabiensis has been limited by wide expanses of hyperarid desert, low human population density, and limited human movement between Egypt and Sudan. In addition, the Ministries of Health in both Egypt and Sudan conduct annual surveillance in the border area and intensively spray with residual insecti-cides potential breeding habitats and dwellings, which may also limit dispersal from south to north. However, expansion of densely irrigated cropland from Lake Nasser, the Toshka Lakes and Kom Ombo northward may provide foci for establishment and future range expansion (Figure 1).
Methods
Model descriptions
Two well-known models were selected for analysis: the Land Change Modeler (LCM), which was used for pro-jecting future changes in irrigated cropland extent, and MaxEnt, for projecting future changes in potential An. arabiensis distribution. The LCM is available either as an extension to the popular ArcGIS software or as a module within Idrisi, a widely used raster-based GIS package. Land cover projections of the LCM were fed into MaxEnt to project a range of potential distributions. The LCM employs a set of spatial data layers associated with land cover changes, such as rivers, roads,
settlements, which distinguishes it from agent-based models, which are generally based on behavioural aspects of agents of change and attempt to model deci-sions often made at the local level [22,31,32]. Consistent with other studies that address future environmental conditions in North Africa [20,28,29], the year 2050 was selected as the endpoint of the simulations using both a business-as-usual (BAU) and a Green Nile Sce-nario, which assumes high probability of desert land changing to irrigated cropland (details below). LCM establishes the quantity of change by evaluating the empirical Markov matrix based on comparison between the initial and second land cover maps in time and then assumes this same transition probability as it pro-jects into the future [33]. The BAU scenario simply assumes that transition probabilities derived from past changes remain constant through time and are derived from the changes observed between two land cover maps. The LCM allows users to vary the transition probabilities and so the transition probabilities were modified for a set of LCM runs to examine how in-creasing the probability of land changing from desert to irrigated cropland would change spatial allocation (i.e. the Green Nile scenario) of irrigated cropland, which is clearly more suitable habitat for this vector species than barren desert. For the LCM simulations, a neural net-work approach was selected to develop a transition probability layer based on prior experience with this particular algorithm in the context of land change modeling [34].
Although many SDMs have been developed, MaxEnt was selected since it is robust, it accepts categorical data, and it produces accuracies that typically compare with or exceed other SDMs [35,36]. This SDM uses a machine-learning approach with a set of user-specified covariates that include species occurrence points, used to develop a set of training samples, and spatial layers representing environmental variables (generally denoted as z) to produce predicted probability surfaces (denoted here as p(s)) in raster format. The model employs a maximum entropy approach that integrates model cov-ariate selection and controls for overfitting by using smoothing and identifies how the covariates contribute to the model. The model minimizes relative entropy, a measure of dispersion or uncertainty associated with a random variable, through a Gibbs distribution, which is an exponential family model:
f1ð Þ ¼z f zð Þe ð Þz
where f1(z) is the probability density of covariates
parameter that weighs the contribution of each covari-ate using a log likelihood approach [36]. For a complete explanation of MaxEnt, readers are referred to Elith et al. [37]. For all MaxEnt runs, the default settings were utilized as generally followed in other SDM intercomparison studies that involve this particu-lar model [35].
Application of the land change models and MaxEnt models
[image:4.595.60.538.88.598.2]Two land cover maps from 2001 and 2009 were obtained, which were derived from classification of Mod-erate Resolution Imaging Spectroradiometer (MODIS) imagery produced as the 500 m MCD12Q1 data obtained from a NASA website [38]. The International
Geosphere-Biosphere Programme (IGBP) land cover scheme was selected, which includes 17 classes, includ-ing two that contain croplands that were combined to form a single cropland class (Figure 1). All other land cover types except water were reclassified to form a sin-gle class referred to as “other lands,” which was domi-nated by the barren or sparsely vegetated classes in the IGBP scheme. The study area shown in Figure 1 was selected to cover the Nile River corridor north of the 200 mm rainfall line as determined from rasterized cli-mate data (described below). Previous analysis of the MCD12Q1 product for the study area showed excellent agreement with Landsat imagery gridded to 30 m spatial resolution as well as MODIS 250 m imagery of the nor-malized difference vegetation index (NDVI), thus provid-ing high confidence in the accuracy of the land cover maps used in the LCM [26]. Three distance layers from water bodies, major roads [39] and irrigated cropland were created as proximate drivers in the LCM.
In addition to land cover data, climate data was also used, including mean monthly minimum/maximum temperature and precipitation, obtained from the WorldClim database gridded to approximately 1 km resolution [40]. NDVI was also derived from MODIS imagery gridded to 1 km resolution and were also obtained for the period 2001–2010 from the same NASA website that supplied the MCD12Q1 products and a range of summary statistics was calculated includ-ing mean annual NDVI, annual range and standard devi-ation images. As NDVI provides a proxy measure of surface moisture, these images were also used in MaxEnt as environmental covariates. Table 1 summarizes the covariates used in both the LCM and MaxEnt models.
Sixty-four different MaxEnt experiments were con-ducted using different combinations of land cover, NDVI, climate layers and an elevation layer derived from the Shuttle Radar Topography Mission (SRTM) 90 m data [41]. This number of experiments provided a suffi-cient sample to evaluate model performance with differ-ent combinations of covariates. An experimdiffer-ent was
defined as a unique set of environmental covariates in which different combinations of covariates were input to the model. Fifty of these experiments involved 2001 con-ditions to evaluate how the SDM performed for near-current conditions and the remaining experiments involved inclusion of the BAU and Green Nile projec-tions. Species occurrence points were obtained from the Malaria Atlas Project (MAP) [42] and the points were gridded to 1 km resolution to match the resolution of the climate data. The points include collections of both immature and adult forms obtained since 1985, have a spatial precision of 10-3 degrees and are approximately concurrent with the NDVI and climate layers used in the analysis (Sinka, pers comm). Of the total 104 unique occurrence points that fell within the study area, 25 oc-currence points were randomly selected to independ-ently check the results of each model experiment (Figure 1). According to the MAP database, most collec-tions consisted of adults resting inside houses. Note that many of the points fell to the south of the Nile Corridor in Sudan, which was necessary to obtain a reliable statis-tical representation of the environmental conditions associated with presence of An. arabiensis. The inde-pendent test points were used to calculate statistics such as the mean p(s) and standard deviation for each model experiment to evaluate the accuracy of different experiments.
[image:5.595.57.538.590.733.2]Several different bias layers were created to de-bias the data for unrepresentative (i.e. highly clustered) sam-pling of specimens. After a number of trials with differ-ent bias layers, a bias layer was selected based on examination of the point distribution in Figure 1, which shows a clear tendency for collections near rivers, as well as informed assumptions based on the authors’ field survey experience; i.e. that the probability of sam-pling for An. arabiensis declines as a function of dis-tance from major roads and coasts. To create this particular bias layer, a procedure developed by Fuller et al. [25] was applied. Thus, each experiment was eval-uated both qualitatively by comparing the MaxEnt
Table 1 List of covariates used in the Land Change Modeler and MaxEnt
Spatial Model Covariates/Drivers [Sources] Derived Layer(s) Used in Model Projections
Land Change Modeler (LCM)
Land cover classification 2001 [38] Distance from water bodies
Land cover classification 2009 [38] Distance from irrigated cropland
Major roads and rivers [39] Distance from roads
MaxEnt Mean monthly maximum and minimum temperature [40]
Current and future land cover projections from the LCM scenarios
Mean monthly precipitation [40] Annual range (maximum-minimum) of NDVI values
Shuttle Radar Topography Mission (SRTM) [41]
An. arabiensispoints [42]
outputs with known distribution and by extracting probability values using the independent test points selected randomly from the data set.
The lowest presence threshold (LPT) method was used for setting thresholds to evaluate presence/absence from the MaxEnt experiments. This method uses the lowest predicted value associated with any one of the observed occurrence points and it can be interpreted ecologically as pixels predicted as being at least as suitable as those where a species presence has been recorded [43]. It is thus considered a highly conservative way to map the minimum predicted distribution. In addition, the LPT approach reduces omission error to zero in the training data set [43]. A 2050“Green Nile” scenario was created by manipulating the Markov transition matrix such that the probability of a pixel classified as“other land” chan-ging to a pixel classified as “cropland” was increased to 0.200, while no change (other land not changing to any other land cover category) was assigned a probability of 0.800. The same transition probability in the BAU
scenario derived from overlay of the 2001 and 2009 MODIS land cover maps was 0.028, thus the Green Nile scenario assumed nearly an order of magnitude increase in probability of other land becoming this land cover type.
[image:6.595.59.537.339.715.2]Land cover layers for 2001, the BAU and the Green Nile scenarios were then passed to the MaxEnt SDM to see how habitat suitability may change by 2050 as a function of potential changes in irrigated cropland. A Monte Carlo approach was used to simulate 2050 NDVI by taking the mean and standard deviation of 2009 NDVI range (maximum-minimum) extracted for irri-gated lands (mean = 0.577, SD = 0.098). NDVI range was used because it provides a convenient summary statistic that relates to crop phenology. The NDVI distribution for irrigated cropland was estimated by evaluating the image histogram of 2009 NDVI values for irrigated land and by extracting 2,230 randomly sampled points that fell on irrigated cropland. The probability distribution was evaluated using the Chi Square statistic, which was
significant for a normal distribution (Chi-Square = 57.46, DF = 4, p = 0.00). The resultant LPT-based maps were then analysed using a set of GIS operations to quantify key landscape characteristics including the number of suitable habitat patches, their area and distances be-tween patches within a 25-km buffer around water bod-ies. This analysis served to provide basic information on the spatial configuration of projected cropland, including gaps, patch size, corridor length, etc., from which one may infer re-invasion potential through the Nile Valley under different scenarios. Such data may also be useful in guiding parameterization of new metapopulation models that consider habitat patch dynamics of malaria vectors in areas of low transmission [44].
Results
For 2001 land cover experiments, mean probability of species presence, p(s), obtained from the test points, ranged from 0.27 for one experiment that included monthly minimum and maximum temperature only to 0.64 and those that included NDVI range, SRTM and land cover, respectively. The mean p(s) value for all experiments that included either monthly temperature or precipitation covariates was 0.51 (SD = 0.11), whereas the mean for experiments that included only land cover, NDVI or elevation was 0.57 (SD = 0.05). It was noted that experiments that included temperature generally produced anomalously high p(s) values in desert areas far from water bodies, which further suggests that cli-mate data failed to enhance the model outputs. This may have been due to the uniformly hot, arid condi-tions that characterize northern Sudan and Upper Egypt.
Figure 2 shows the 2050 LCM outputs for both the BAU and Green Nile scenarios and reveals two extremes with only modest growth of irrigated cropland along the Nile noticeable relative to 2001 land cover shown in Figure 1. This is probably a more realistic sce-nario compared to Figure 2b, which represents an ex-treme case that would involve high investment in costly irrigation infrastructure and a high degree of political stability to realize even by mid-century. The projected distribution of irrigated cropland in this figure resem-bles the buffer around water bodies (Figure 3) and shows how the LCM produced range expansion by ad-jacency effects along major fronts as opposed to expan-sion through long-distance dispersal via establishment at disjunct foci.
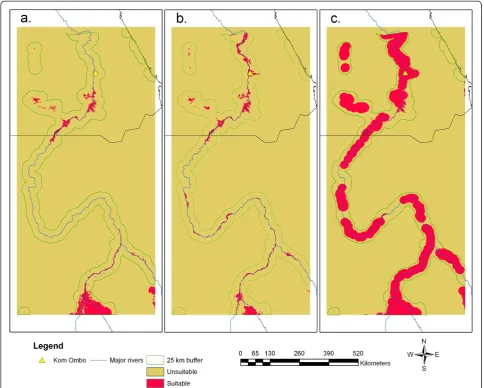
Figure 3a reveals potential distribution in 2001 based on 2001 land cover, SRTM, and NDVI range (mean p (s) = 0.60, SD = 0.23, LPT = 0.23), whereas Figures 3b and 3c show the 2050 results when Figures 2a and 2b were input to the SDM. The LPT values were 0.45 and 0.29 for the BAU and Green Nile scenarios, respectively. All
three projections reveal potentially suitable habitat around the Toshka Lakes, which have experienced mod-est expansion of irrigation and have been targeted by the Egyptian Government as an area for major agricultural development [26]. In addition, Figure 3 reveals an area of potentially suitable habitat associated with Lake Nas-ser in Upper Egypt, which is consistent with understand-ing of the vector’s larval habitat characteristics [30]. The maps depicting future scenarios (Figures 3b and 3c) cor-respond closely to the distribution of irrigated cropland in the BAU and Green Nile scenarios. Figures 3b and 3c also show the strong influence that land cover may have on SDM projections. It is important to note that the LPT approach used to threshold these future projections implies that test points representingAn. arabiensis habi-tat locations are shabi-tatic and that the species will remain present in these spots by 2050.
which typically move 350–650 m day-1 within suitable habitats [45]. Of course, the dispersal capacity for this species may be greatly facilitated through chance events related to downwind dispersal, human action, particu-larly transportation of eggs and immature forms through future transportation and trade linkages, which are planned for development [10,46]. It should be noted that the models used in this demonstration were not parame-terized to account for growth of linear connections
between patches although this may be possible in future scenario development.
Conclusions
[image:8.595.56.541.89.477.2]This study provides a first demonstration of how land change and species distribution models may be linked to advance understanding of potential distributions of mal-aria vectors as a result of anthropogenically driven changes in land cover and use, in this case related to
Figure 3Potential distribution ofAnopheles arabiensisobtained from the SDM, MaxEnt including a. the 2001 distribution, b. BAU projection; c. Green Nile scenario.The 25 km buffer around water bodies is also shown.
Table 2 Summary landscape statistics for the three projections of potential range
Metric 2001 2050 BAU 2050 Green Nile
Total area of suitable habitat in km2 15,484 11,633 93,646
Number of patches 315 324 35
Mean patch area in sq km (SD) 5,103.34 (3,993.26) 896.26 (653.14) 14,331.17 (7,886.03)
Mean inter-patch distance in km within 25 km buffer of water bodies (SD) 19.38 (27.65) 12.72 (9.92) 4.51 (7.89)
[image:8.595.66.538.647.733.2]irrigation and agricultural expansion. With a few excep-tions, the spatial projections of potentially suitable range (Figure 3) generally produced results consistent with understanding of the bionomics of An. arabiensis. Figure 3 also reveals three large gaps along the Nile corridor in Sudan where quarantine efforts may be tar-geted in the future. Further, the projected ranges for the three maps show potential habitat patches associated with flowing and man-made water bodies and sparsely vegetated areas within the Nile Valley, indicating the broad range of environments associated with the species [30]. Generally, such maps produced by linked LCM-SDMs are suitable for inferring potential re-invasion in so far as they allow quantification of distances from current or future occurrence sites, connectivity corridors and potentially suitable habitats of particular sizes that may be related to the flight range of this species as well as other vectors. Future validation of land cover change projections may be supported by use of moderate reso-lution satellite imagery such as MODIS 250 m images that clearly reveal irrigated patches of cropland. In addition, mosquito collection data from on-going and fu-ture surveillance efforts may also be employed to check the accuracy of potential range projections using a stand-ard error matrix approach.
Although little is known about long-distance dispersal inAn. arabiensis, many studies have demonstrated long-distance, wind-aided dispersal of adult female mosqui-toes over distances ranging from tens to hundreds of km [46]. Thus, the distances between potential habitat patches shown in Table 2 appear to be surmountable if chance establishment were to occur through the action of wind or human agents. Consistent with this conclu-sion, several reports indicate that anopheline vectors, in-cluding Anopheles multicolor, Anopheles sergentii and Anopheles algeriensis, have already been found in the area around the Toshka Lakes and other areas experien-cing land use and cover changes, such as along the Gulf of Suez,where the presence ofAnopheles pharoensishas been recorded recently [47-49].
The results in this study should be considered as heuristic in that they serve to illustrate the potential of using LCM outputs to drive SDMs as a way to explore different potential distribution scenarios related to irri-gation in arid environments. The outputs of SDMs driven by LCM projections may be connected further to mathematical models such as metapopulation models that consider patch size and connectivity to simulate colonization, extinction, as well as pathogen transmis-sion and epidemic processes [44]. In addition, future applications of LCMs may include growth of linear con-nections, particularly establishment of new roads and irri-gation canals that are likely to occur in the near future. The LCM used in this demonstration is capable of
projecting such changes, although limited GIS data on minor road and canal networks precluded this sort of ana-lysis in this study. However, experimentation with the LCM used here in other contexts [34] suggests that par-ameterizing the growth of linear networks can prove very challenging.
Although it was originally hypothesized that climate layers would enhance the SDM results, low average p(s) values for test points and anomalously high p(s) values in hyperarid areas far from major rivers indicated that inclusion of climate data produced unrealistic SDM out-puts. In light of the important invasion event in the 1940s when the species must have been widespread in the Nile Valley of Egypt, it is concluded that temperature seasonality and isothermality are not limiting factors anywhere in the Nile Valley and that rainfall is generally too low to support establishment in Upper Egypt. There-fore, irrigation as evidenced by cropland and NDVI was used as the main variable that would affect future distri-bution of the vector. This result also suggests that at this scale of investigation (as shown in Figure 1), 1 km cli-mate data are unlikely to improve SDM projections and may even worsen them if applied to regions that do not possess major climate gradients.
Irrigation from surface and ground water is likely to continue to be a major driver of environmental change in North Africa and the Middle East in order to meet growing regional and global demand for food and realize export potential. Moreover, other tropical regions within South Asia, Sub-Saharan Africa and Latin America are likely to experience expansion of irrigation infrastructure as well in the coming decades [20]. Beyond irrigation, deforestation for agricultural expansion is another major concern wherein LCMs and SDMs may be linked, par-ticularly where forest is being transformed into pastures and farmland in the Amazon Basin. Additional applica-tions involving LCMs and SDMs include habitat frag-mentation, urbanization, road building, and wetland modification, to name but a few [13]. However, while LCMs have potential to project land cover changes asso-ciated with these processes, these applications within the context of vector-borne disease studies remain largely underexploited.
include a range of different land change and species dis-tribution models to explore further the variability of LCM and SDM outputs in different contexts. The results of such investigations may be useful for deterministic models that evaluate pathogen transmission and epi-demic potential within and between homogeneous and non-homogeneous habitat patches and help to guide more realistic model formulation by accounting for mul-tiple patches of variable size and inter-patch distances. Further, the approach used here may be routinely ap-plied to assess potential impacts of future irrigation/agri-cultural development projects in arid areas. Most countries currently have legislation ensuring that future irrigation development projects are subject to environ-mental assessments and, therefore, linking LCMs and SDMs can assist countries in managing negative impacts related to vectors and vector-borne diseases in conjunc-tion with other data and tools employed in environmen-tal and disease impact assessments.
Competing interests
The authors declare that they have no competing interests.
Authors’contributions
DOF conceived and wrote the paper as well as conducted the modeling, MP processed the environmental and other GIS data layers used in both models and contributed to the writing, ANH provided GIS data andAnopheles distribution information and helped to write the paper. JCB helped to conceive and write the paper. All authors have read and approved the final version.
Acknowledgements
The authors are grateful to Dr Marianne Sinka for providing the species occurrence points and related information about theAn. arabiensispoints from the MAP database. In addition, we thank the anonymous reviewers for their thoughtful comments and suggestions on the manuscript. Support for this research is provided by a grant from the National Institutes of Health (award R01GM093345) to the University of Miami, FL, USA
Author details
1Department of Geography and Regional Studies, University of Miami, Coral Gables, FL 33124-2221, USA.2GIS Division, McGinley and Associates Inc., Las Vegas, NV 89118, USA.3Department of Basic Environmental Sciences, Institute of Environmental Studies & Research, Ain Shams University, Cairo, Egypt.4Department of Epidemiology and Public Health, University of Miami Miller School of Medicine, Miami, FL 33136, USA.
Received: 18 June 2012 Accepted: 31 July 2012 Published: 6 August 2012
References
1. Soper FL:Paris Green in the eradication ofAnopheles gambiae: Brazil, 1940; Egypt, 1945.J Am Mosquito Control Assoc1966,26:470–476. 2. Van Den Hurk AF, Craig SB, Tulsiani SM, Jansen CC:Emerging tropical
diseases in Australia. Part 4. Mosquito borne diseases.Ann Trop Med Hyg 2010,104:623–640.
3. Kampel H, Werner D:Arthropod vectors and their growing importance in Europe.Prog Parasitol [Parasitol Res Monographs]2011,2:259–282. 4. Derraik JGB, Slaney D, Nye ER, Weinstein P:Chikungunya virus: A novel
and potentially serious threat to New Zealand and the South Pacific Islands.AmJTrop Med Hyg2010,4:755–759.
5. Chaves LF, Koenraadt CJM:Climate change and highland malaria: Fresh air for a hot debate.Quart Rev Biol2010,85:27–55.
6. Parmakelis A, Russello MA, Caccone A, Marcondes CB, Costa J, Forattini OP, Sallum MAM, Richard C, Wilkerson RC, Powell JR:Historical analysis of a
near disaster:Anopheles gambiaein Brazil.AmJTrop Med Hyg2008,
78:176–178.
7. Lounibos LP:Invasions by insect vectors of human disease.Ann Rev Entomol2002,47:233–266.
8. Cohen AN:Success factors in the establishment of human-dispersed organisms. InDispersal Ecology. Edited by Bullock JM, Kenward RE, Hails RS. Oxford, UK: Blackwell Publishing; 1992:374–394.
9. Pinault LL, Hunter FF:New highland distribution records of multiple
Anophelesspecies in the Ecuadorian Andes.Malar J2011,10:236. 10. Malcolm CA, El Sayed B, Babiker A, Girod R, Fontenille D, Knols BGJ, Nugud AH,
Benedict MQ:Field site selection: getting it right first time around.Malar J 2009,8(Suppl2):S9.
11. Stresman GH:Beyond temperature and precipitation: Ecological risk factors that modify malaria transmission.Acta Trop2010,116:167–172. 12. Vittor AY, Pan W, Gilman RH, Tielsch J, Glass G, Shields T, Sanches-Lozano W,
Pinedo W, Salas-Cobos E, Flores S, Patz JA:Linking deforestation to malaria in the Amazon: Characterization of the breeding habitat of the principal malaria vector:Anopheles darlingi.AmJTrop Med Hyg2009,81:5–12. 13. Patz JA, Daszak P, Tabor GM, Aguirre AA, Pearl M, Epstein J, Wolfe ND,
Kilpatrick AM, Foufopoulos J, Molyneux D, Bradley DJ, Members of the Working Group on Land Use Change and Disease Emergence:Unhealthy landscapes: policy recommendations on land use change and infectious disease emergence.Environ Health Persp2004,112:1092–1098.
14. Patz JA, Graczyk TK, Geller N, Vittor A:Effects of environmental change on emerging parasitic diseases.Int J Parasit2000,30:1395–1405.
15. Thomson MC, Ericksen, Ben Mohamed A, Connor SJ:Land-use change and infectious disease in West Africa. Ecosystems and Land Use Change. In Ecosystems and Land use Change. Edited by DeFries RS, Asner GP, Houghton RA. Washington, DC: American Geophysical Union; 2004:169–187. 16. Herrera S, Quiñones ML, Quintero JP, Corredor V, Fuller DO, Mateus JC,
Calzada JE, Gutierrez JB, Llanos A, Soto E, Menendez C, Wuk Y, Alonso P, Carrasquilla G, Galinski M, Beier JC, Arevalo-Herrera M:Prospects for malaria elimination in non-Amazonian regions of Latin America.Acta Trop2012,
121:315–323.
17. Barros FSM, Arruda ME, Gurgel HC, Honorio NA:Spatial clustering and longitudinal variation ofAnopheles darlingi(Diptera: Culicidae) larvae in a river of the Amazon: the importance of the forest fringe and of obstructions to flow in frontier malaria.Bull Entomol Res2011,
101:643–658.
18. Sinka ME, Rubio-Palis Y, Manguin S, Patil AP, Temperley WH, Gething PW, van Boeckel T, Kabaria CW, Harbach RE, Hay SI:The dominant Anopheles vectors of human malaria in the Americas: occurrence data, distribution maps and bionomic précis.Parasit Vectors2010,3:72.
19. Dia I, Ba H, Mohamed SAO, Diallo D, Lo B, Diallo M:Distribution, host preference and infection rates of malaria vectors in Mauritania.
Parasit Vectors2009,2:1–4.
20. Turral H, Svendsen M, Faure JM:Investing in irrigation: Reviewing the past and looking to the future.Ag Water Manag2010,97:551–560.
21. Foley DH, Rueda LM, Peterson AT, Wilkerson RC:Potential distribution of two species in the medically importantAnopheles minimuscomplex (Diptera: Culicidae).J Med Entomol2008,45:852–860.
22. Lambin EF, Tran A, Vanwambeke SO, Linard C, Soti V:Pathogenic landscapes: interactions between land, people, disease vectors, and their animal hosts.Int J Heath Geogr2010,9:54.
23. Foley DH, Klein TA, Kim HC, Brown T, Wilkerson RC, Rueda LM:Validation of ecological niche models for potential malaria vectors in the Republic of Korea.J Am Mosquito Contr Assoc2010,26:210–213.
24. Townsend PA:Shifting suitability for malaria vectors across Africa with warming climates.BMC Infect Dis2009,9:59.
25. Fuller DO, Ahumada M, Quiñones ML, Herrera S, Beier JC:Near-present and future distribution ofAnopheles albimanusin Mesoamerica and the Caribbean Basin modeled with climate and topographic data.Int J Health Geogr2012,11:13.
26. Fuller DO, Parenti MS, Gad A, Beier JC:Land cover in Upper Egypt assessed using regional and global land cover products derived from MODIS imagery.Remote Sensing Lett2012,3:171–180.
27. Wasimi SA:Climate change in the Middle East and North Africa (MENA) region and implications for water resources project planning and management.Int J Clim Change Strat Manag2010,2:297–320. 28. Intergovernmental Panel on Climate Change (IPCC):Fourth Assessment
publications_and_data/publications_ipcc_fourth_assessment_report_ synthesis_report.htm. Accessed 23 July 2012.
29. Beyene T, Lettenmeier DP, Kabat P:Hydrological impacts of climate change on the Nile River Basin: implications of the 2007 IPCC scenarios.
Clim Change2010,100:433–461.
30. Sinka ME, Bangs MJ, Manguin S, Coetzee M, Mbogo CM, Hemingway J, Patil AP, Temperley WH, Gething PW, Kabaria CW, Okara RM, Van Boeckel T, Godfray HCJ, Harbach RE, Hay SI:The dominant Anopheles vectors of human malaria in Africa, Europe and the Middle East: occurrence data, distribution maps and bionomic précis.Parasit Vectors2010,3:117.
31. Deadman P, Robinson D, Moran E, Brondizio E:Colonist household decisionmaking and land-use change in the Amazon Rainforest: an agent-based simulation.Environ Plann B: Plann Design2004,31:693–709. 32. Pontius RG, Walker R, Yao-Kumah R, Arima E, Aldrich S, Caldas M, Vergara D:
Accuracy assessment for a simulation model of Amazonian deforestation.Ann Assoc Am Geographers2007,97:677–695. 33. Eastman R:Idrisi: The Selva Edition. Worcester, MA: Clark Labs; 2012. 34. Fuller DO, Hardiono M, Meijaard E:Deforestation projections for
carbon-rich peat swamp forests of Central Kalimantan, Indonesia.Environ Manag 2011,48:436–447.
35. Elith J, Leathwick JR:Species distribution models: Ecological explanation and prediction across space and time.Annual Rev Ecol, Evol System2009,
40:677–697.
36. Elith J, Graham C:Do They? How do they? Why do they differ?–on finding reasons for differing performances of species distribution models.Ecography2009,30:129–151.
37. Elith J, Phillips SJ, Hastie T, Dudίk M, Chee YE, Yates CJ:A statistical explanation of MaxEnt for ecologists.Divers Distrib2011,17:43–57. 38. National Aeronautics and Space Administration (NASA):EOSDIS, NASA’s Earth
Observing System Data and Information System, Reverb | Echo.; 2012. http:// www.reverb.echo.nasa.gov/reverb/. Accessed 23 July 2012.
39. ClarkLabs; http://www.clarklabs.org/products/other-features.cfm. Accessed 24 Jul 2012.
40. WorldClim–Global Climate Data: free climate data for ecological modeling and GIS. 2012. http://www.worldclim.org. Accessed 23 July 2012. 41. Global Land Cover Facility (GLCF). 2012. http://glcf.umiacs.umd.edu. Accessed
24 July 2012.
42. MAP: Malaria Atlas Project. 2012. http://www.map.ox.ac.uk. Accessed 23 July 2012.
43. Pearson RG, Raxworthy CJ, Nakamura M, Peterson Townshend A:Predicting species distributions from small numbers of occurrence records: a test case using cryptic geckos in Madagascar.J Biogeogr2007,34:102–117. 44. Prosper O, Ruktanonchai N, Martcheva M:Assessing the role of spatial
heterogeneity and human movement in malaria dynamics and control.
J Theoret Biol2012,303:1–14.
45. Constantini C, Li S-G, Della Torre A, Sagnon N, Colluzi M, Taylor CE:Density, survival and dispersal ofAnopheles gambiaecomplex mosquitoes in a West African Sudan savanna village.Med Vet Entomol1996,10:203–219. 46. Service MW:Mosquito (Diptera: Culicidae) dispersal–The long and the
short of it.J Med Entomol1997,34:579–588.
47. Hassan AN:Environmental change and associated mosquito ecology along the Gulf of Suez, Egypt.J Egypt Acad Soc Environ Develop (A-Entomology)2001,1:53–71.
48. Hassan AN, Swilam MM, El Ashry HE:Mosquito fauna of new water resources development projects in Egypt: Toshka and El Salam Canal.
J Environ Sci2005,9:787–800.
49. El-Bahnasawy MM, Saleh NM, Khalil MF, Morsy TA:The impact of three anopheline mosquito species in Toshka, on the introduction of chloroquine resistantP. falciparumto Egypt.J Egypt Soc Parasitol2011,
41:573–592.
doi:10.1186/1475-2875-11-264
Cite this article as:Fulleret al.:Linking land cover and species distribution models to project potential ranges of malaria vectors: an example usingAnopheles arabiensisin Sudan and Upper Egypt.Malaria
Journal201211:264.
Submit your next manuscript to BioMed Central and take full advantage of:
• Convenient online submission
• Thorough peer review
• No space constraints or color figure charges
• Immediate publication on acceptance
• Inclusion in PubMed, CAS, Scopus and Google Scholar
• Research which is freely available for redistribution