R E S E A R C H A R T I C L E
Open Access
Salmonella blood stream infections in a tertiary
care setting in Ghana
Appiah-Korang Labi
1, Noah Obeng-Nkrumah
2*, Naa Okaikor Addison
1and Eric Sampene Donkor
2Abstract
Background:Despite the clinical significance ofSalmonellainfections, surveillance data worldwide remains limited and is more so exemplified by the lack of reports from Africa especially in eastern, central and western Africa. This study reports on Salmonella serotypes as significant causes of blood stream infections (BSI) and multidrug antibiotic resistance at Korle-Bu Teaching Hospital in Accra, Ghana.
Methods:Antibiogram patterns, seasonal variations in disease incidence and predisposing factors for infection with Salmonella serotypes were analyzed retrospectively over a 4-year period from January 2010 to December 2013. Blood cultures were processed with BACTEC 9240 blood culture system. Speciation was done with BBL Crystal Enteric/Nonfermenter identification system®, and with slide agglutination using specific antisera. Antimicrobial susceptibility testing was carried out by the Kirby-Bauer disc diffusion method according to Clinical and Laboratory Standard Institute guidelines.
Results:We report a 6.5% (n = 181/2768) prevalence of Salmonella bacteraemia at the Korle-Bu Teaching Hospital; with a preponderance of non-typhoidal salmonellae (NTS) over typhoidal salmonella (TS) (n = 115/181, 63.5% versus n = 66/181, 36.5%; P-value <0.002). Children under 5 years bore the brunt of the disease (n = 93/174, 53.4%). Resistance to ciprofloxacin (n = 1/127, 0.7%), amikacin (n = 3/81, 3.7%), and cefotaxime (n = 6/99, 6.1%) remained low, despite high levels of multidrug resistant Salmonella phenotypes (n = 81/181, 44.2%). In multivariate analysis, and among patients with Salmonella BSI, those < 1 year old had reduced risk of non-typhoidal infections [Odds ratio, 0.51; 95% confidence interval (95% CI), 0.16-0.92, P-value 0.021]. Similarly, patients with cefuroxime resistant strans were at increased risk of having multidrug resistant Salmonella BSI (OR, 8.97; 95% CI, 3.62-24.15; P-value, 0.001).
Conclusions:Salmonellae, predominantly NTS, account for a reasonable low proportion of positive blood cultures in our tertiary care setting; but with significant multidrug resistant phenotypes and low ciprofloxacin and cefotaxime resistance.
Keywords:Ghana, Salmonella, Antibiotic, Resistance, Risk factors
Background
Invasive salmonellosis remains a global public health problem. Global estimates in 2000 showed that typhoid fever accounted for 21, 000 000 illnesses and 216, 000 deaths, whilst 5, 412 744 illnesses were attributable to paratyphoid fever [1]. The epidemiology of invasive sal-monellosis varies worldwide. In Europe, non-typhoidal Salmonella (NTS) mainly SalmonellaEnteritidis predom-inate but are rarely associated with systemic disease other than diarrhoea except for severely immunocompromised
patients) [2]. In South East Asia, the predominant organ-ism isSalmonellaTyphi [1,3], whilst in Africa NTS pre-dominates [1,4-8]. The disease is common in developing countries and concomitant with poor public health and low socio economic indices [9,3]. Thus the bulk of the dis-ease burden is seen in South East Asia, Africa and Latin America [3]. Its’epidemiology is also affected by seasonal variations [2,10]. In India peak incidence of Salmonella Typhi occurs between April-June (dry season) followed by July-September (monsoon season). In Africa the epidemi-ology of invasive salmonellosis has been linked with malaria infections [4,8,11,12].
* Correspondence:successfulnoahforchrist@yahoo.com
2
Microbiology Department, University of Ghana Medical School, P.O. Box 4326, Accra, West Africa, Ghana
Full list of author information is available at the end of the article
In Ghana, there is paucity of epidemiological data on invasive salmonellosis with a few studies suggesting high disease burden in children. A recent report found invasive non-typhoidal salmonellosis in 10% of hospitalized chil-dren [5], whilst another study documented a prevalence of 57% in infant bactereamia [4].
Salmonellaspecies are increasingly evolving antimicro-bial resistance to several commonly used antimicroantimicro-bial agents. This phenomenon which started with a report of chloramphenicol resistantSalmonellaTyphi from India in 1972 [13] has increased to the extent that multi-drug re-sistant strains are now circulating globally [14]. This is the result of indiscriminate use of antibiotics in areas of high transmission or endemicity [14]. The problem of MDR Salmonella increases the challenge in the management of the disease in endemic regions by increasing morbidity and mortality as well as cost of treatment.
Surveillance data worldwide remains limited (2), and is more so exemplified by the lack of data from Africa espe-cially in eastern, central and western Africa (1). Such data is relevant in decision making by public health officials for disease prevention and control programmes (1). In Ghana the situation is no different. In this study, we have docu-mented the epidemiology of invasive salmonellosis in a tertiary hospital setting in Ghana. Our primary outcomes were to report the prevalence, circulating serotypes, anti-microbial resistance patterns, seasonal variations in disease incidence and some predisposing factors for this infection.
Methods
Study setting
The retrospective study was conducted in Korle-Bu Teach-ing Hospital (KBTH), a 2000-bed tertiary teachTeach-ing hospital with about 200 admissions per day [15]. The hospital covers all medical specialties and provides referral health-care services to an estimated population of 24 million Ghanaians. The central outpatient department records about 29,757 patient turnout per month [15]. The bacteri-ology unit of the Microbibacteri-ology Department of KBTH pro-cesses over 40,000 clinical cultures annually.
Study design
From January 2010 through December 2013, we studied all clinical bloodstream isolates of salmonellae collected at the bacteriology unit of the Central Microbiology Labora-tory in KBTH. Two sampling approaches were used. First, all Salmonella isolates recovered from blood cultures of patients visiting the microbiology laboratory of KBTH were characterized and analysed. Second, we reviewed laboratory records of all patients with Salmonella BSI for microbiological data. Salmonella species were selected based on the following criteria: (i) confirmed as the causa-tive agent of the infection for which blood cultures were
performed, and (ii) identified as first isolate per patient within study period. Multiple isolates per patient were con-sidered only if antibiogram was different than previous, and their bacteraemia episodes were more than 3 months separate.
Patients’record review
To provide accurate information, patients and isolates data were abstracted in the following two steps, (i) manual work through of laboratory records, and (ii) physician-assisted medical reconciliation of data. Data were retro-spectively reviewed and compared. When bacteraemic episodes with Salmonella were identified, we categorized those with typhoid and non-typhoid isolates. Data were retrospectively reviewed and compared. Subsequently, univariate and multivariate analysis were conducted to compare patients with Salmonella BSI caused by typhoidal strains to their counterparts with non-typhodal isolates using patients’data from laboratory records as independ-ent predictor variables. Similar analysis were also con-ducted to compare a second case group comprising patients with BSI caused by MDR Salmonella to those with non-MDR Salmonella BSI. Each patient was included only once for each outcome. Patients’groups were com-pared regarding the following: demographics (age, gender), sickle cell disease, month and year of infection as well as patients’hospital and assigned department of care. We also collected data on variables related to infections: types of Salmonellaspecies and antibiogram.
Specimen, culture and identification
During the study period, and as part of hospital routing care, 23,708 patients submitted blood cultures for bacterio-logical investigations. Speceimens were processed with BACTEC 9240 blood culture system (Becton Dickinson, NJ, USA) according to manufacturer’s instructions. A total of 2,768 blood cultures were positive for various infec-tions. Subcultures were made on blood, chocolate and MacConkey agar; and were incubated aerobically at 37°C for 20 hours. Typical lactose non-fermenting colonies were speciated with standard bacteriologic reactions and BBL Crystal Enteric/Nonfermenter identification system® (Becton Dickinson, NJ, USA). Salmonellae were confirmed with slide agglutination using specific antisera (Himedia Laboratories, India).
Susceptibility testing
Institute (CLSI) guidelines [16]. The reference strain E. coli ATCC 25922 was included as quality control in the susceptibility assays. According to the international stand-ard definitions for acquired resistance, and relative to the panel of antibiotics tested, multidrug resistant (MDR) phenotype was defined asin vitronon-susceptibility to≥1 agent in≥3 antimicrobial categories [17]: penicillins, cepha-losporins, beta-lactamase inhibitor combinations, fluoroqui-nolones, aminoglycosides, chloramphenicol, folate pathway inhibitors, tetracyclines, macrolides and glycopeptides.
Statistics
Data from laboratory investigations were captured into Microsoft ACCESS to generate a database, and exported into Statistical Package for Social Sciences (SPSS, Version 20.0) for data editing and statistical analyses. Continuous data were compared using student’s t-test, analyses of vari-ance (ANOVA) or Mann–Whitney U test, (respectively for normalized and non-parametric distributions), with point estimates of statistical significance indicated by with 2 tailed P-values <0.05. Categorical data were compared across study parameters using Chi-square with Maracuilo’s post hoc tests for multiple comparisons, or the Fisher’s exact test. Correlations were assessed with Pearson co-efficient (r) or Spearman’s rho (rs) or their coefficient of
determination (r2 or rs2) where appropriate. Univariate
comparisons were computed with Chi-square tests and un-adjusted Odds ratios (OR) at 95% confidence interval (CI). From univariate analyses, variable with a P-value <0.05 were analysed in a multivariate logistic regression models to identify independent risk factors. Predictive accuracy of the models was evaluated by Hosmer and Lemeshow goodness-of-fit test with P-value >0.05 suggesting that the model predicts accurately on average. The area under the ROC (Receiver Operating Characteristic) Curve > 0.7 was used to analyse the discriminatory capability of bacterea-mia with typhoidal salmonella or MDR salmonellae versus their respective controls.
Ethical considerations
Ethical approval was not required as the study was regarded as part of routine surveillance measures for infection control by the Ethical and Protocol Review Committee of University of Ghana Medical School, College of Health Sciences. Considering the retrospective nature of the study, we could not obtain patients consent for use of clinical data. Nevertheless, on receipt of isolates and patients’ data, we de-identified all patients to ensure anonymity. We also allot-ted arbitrary numbers to all isolates assigned to the study.
Results
Pravalence of salmonellae
During the study period, 23,708 blood cultures were sub-mitted for bacteriological investigations. A total of 2,768
blood cultures were positive for various infections. From these, 181 (6.5%) non-duplicate salmonellae were recov-ered in 2010 (n = 37/749, 4.9%), 2011 (n = 53/701, 7.5%), 2012 (n = 63/796, 7.9%), and 2013 (n = 28/432, 6.5%). Thus 181 patients were included in this study (98 males and 83 females), with a mean age of 9.5 years (interquartile range, 6 years). The prevalence of TS and NTS were respectively 2.4% [n = 66/2768; 95% confidence interval (CI), 1.93-3.13] and 4.10% (n = 115/2768; 95% CI, 3.10-4.51); with the total number of TS being significantly lower than that of NTS (n = 66/181, 36.5% versus 115/181, 63.5%; P-value <0.002). Overall, we did not observe correlation between salmonel-lae prevalence and study years [rs(2) = 0.4, P-value = 0.617].
Table 1 shows the distribution ofSalmonellaspecies across study years.SalmonellaEnteritidis (n = 93/181, 51.1%), and S. Typhi (n = 48/181, 26.5%) were the predominant sero-type. Others were S. Typhumurium (n = 22/181, 11.5%) andS. Paratyphi (n = 18/181, 9.9%). Marascuilo’s post hoc test was conducted to compare the proportions of salmon-ellae recovered across the 4 study years. Over the study period the yearly populations of each salmonella serotype had similar proportion of defects except forS. Enteritidis for which more isolates were recovered in 2013 compared to 2010 (P-value = 0.018), and in 2011 compared to 2013 (P-value = 0.019).
Cefuroxime resistant phenotypes
As a crude measure to determine beta-lactamase produ-cing phenotypes, we examined the resistance pattern of the salmonellae to cefuroxime (30 μg) (Table 1). The 4-year prevalence of cefuroxime resistance was similar among TS and NTS (n = 11/66, 16.7% versus n = 21/115, 18.2% respectively; P-value = 0.786). Marascuilo’s comparisons showed homogeneity in the proportion of cefuroxime resistant strains across the four yearly populations of typhoidal salmonellae (P-value = 0.1115). Conversely, although we recorded significant difference (P-value = 0.0161) in the proportion of cefuroxime resistance for the yearly populations of non-typhoidal salmonellae, no differ-ence between any two particular years was significant (marascuilo’s post hoc > 0.05 for all pairwise comparisons). For TS and NTS, the Spearman’s ranked test showed no correlations between cefuroxime prevalence and study years [TS, rs(2) =−0.6, P-value = 0.438; NTS, rs(2) =−0.8;
P-value = 0.231].
Seasonal variations in prevalence of salmonellae
highest TS prevalence peaks were observed in March (2.2%) and May (2.0%) for 2010; and in May (2.3%) for 2011. April (2.2%), May (2.75%) and August (2.2%) re-corded the highest bactereamic episodes in 2012; whereas Sepetember (1.6%) and November (1.6%) accounted for the highest prevalence in 2013. Altogether, non-typhoidal salmonellae (NTS) appeared to be more fairly distributed across the months and over the years. For the particular years under study, we sought to examine the correlation between months and the number of salmonellae isolated. The number of TS recovered in 2013, unllike the other years, showed some significant degree of covariation with months; and the direction of covariation was positive. More so, 51.9% of the variance in the number of TS was coupled with advancing months (rs= 0.799; rs2= 0.519;
P-value = 0.001). On the contrary, no significant trend in correlation was observed between the number of non-typhoidal Salmonella (NTS) and months of isolation for any particular year.
Antibiotic susceptibility results
The in vitro susceptibility results of salmonellae to po-tentially useful antimicrobial agents are shown in Table 2. Overall, ampicillin, chloramphenicol and tetracycline were the least effective antibiotics with over 70% of TS and NTS resistant to each antimicrobial. For TS, no re-sistance was found to cefotaxime and the ciprofloxacin; whereas gentamicin, amoxicillin/clavulanate and amika-cin were respectively ineffective against 4.1% (n = 1/24), 8.3% (n = 1/12) and 9.1% (n = 1/11) of the isolates. Simi-larly, NTS were mostly susceptible to the ciprofloxacin
(n = 134/135, 99.2%), amikacin (n = 70/71, 98.6%), cefo-taxime (n = 93/99, 93.9%), and gentamicin (n = 84/93, 90.3%). The percentage resistance between TS and NTS were similar for all tested antibiotics except cotrimoxa-zole —with a smaller percentage of TS than NTS being resistant to this antimicrobial (TS, 15.5%, n = 27/174 versus NTS, 62.1%, n = 54/87; P-value = 0.002). Chloramphenicol was the only antibiotic to which salmonellae resistance appears to be increasing; we noted a positive correlation between time over 4 years and percentage of NTS resistant to this antimicrobial (rs= +1, P-value = 0.0001).
Multidrug resistance salmonellae
Eighty-one (44.8%) salmonellae expressed multidrug resist-ant phenotypes. The multidrug resistresist-ant strains (MDRs) were significantly more in NTS (n = 59/115, 51.3%) com-pared to TS (n = 22/66, 33.3%); with cefuroxime resistant phenotypes more abundant in TS (n = 9/22, 40.9%) than in NTS (n = 18/59, 30.5%). Some MDRs (TS, n = 4/22, 18.2%; NTS, n = 11/59, 18.6%) remained resistant to all except one class of the antimicrobials tested. These were suscep-tible to gentamicin (TS, n = 3/4, 75%; NTS, n = 9/11, 81.8%), amikacin (TS, n = 4/4, 100%; NTS, n = 11/11, 100%), the ciprofloxacin (TS, n = 4/4, 100%; NTS, n = 6/6, 100%), and cefotaxime (TS, n = 4/4, 100%; n = 6/11, 54.5%).
Age distribution of salmonellae strains
[image:4.595.57.540.113.312.2]In Figure 2, we examined the age-specific incidence of TS and NTS across study patients using locally weighted scat-ter plot smoothing (LOWESS) fit lines. Two observations are noteworthy. First, the results show similarities in the Table 1 A four- year distribution of salmonellae recovered from blood cultures submitted to microbiology laboratory of Korle-Bu Teaching Hospital
Isolates Number ofSalmonellaspeciesa(%)
Total (n = 181)
Crx-res. 2010 2011 2012 2013 P-valueb
Total (n = 37)
Crx res. Total
(n = 53)
Crx res. Total
(n = 63)
Crx res. Total
(n = 28)
Crx res.
Typhoidal Salmonella
66 (36.5)a 11 (16.7)a 14 (37.8) 4 (28.5) 12 (22.4) 4 (30.7) 27 (44.8) 2 (7.4) 13 (22.4) 1 (7.6) 0.1322
S.Typhi 48 (26.54) 7 (14.5) 8 (21.6) 2 (25.0) 7 (14.8) 2 (25.0) 25 (61.9) 2 (3.3) 8 (28.5) 1 (12.5) 0.8056
S.ParatyphiA 12 (6.6) 4 (33.3) 3 (8.1) 2 (66.6) 3 (5.5) 2 (66.7) 1 (1.6) 0 5 (17.8) 0 0.0441
S.ParatyphiB 6 (3.3) 0 3 (8.1) 0 2 (3.7) 0 1 (1.6) 0 0 0 0.1988
Non-typhoidal Salmonella
115 (63.5)b 21 (18.2)a 23 (62.1) 5 (21.7) 41 (77.3) 11 (23.4) 36 (57.1) 4 (11.1) 15 (53.5) 1 (6.7) 0.1322
S.Enteritidis 93 (51.2) 18 (19.3) 16 (25.2) 4 (25.0) 33 (61.1) 9 (27.2) 29 (46.0) 4 (13.8) 15 (53.5) 1 (6.7) 0.129c 2010*2013, P = 0.018; 2011*2013, P = 0.019
S.Typhumurium 22 (12.2) 3 (13.6) 7 (18.9) 1 (14.2) 8 (14.0) 2 (25.0) 7 (6.1) 0 0 0
-aCrx res, cefuroxime resistant;bP-value determined with Marascuilo’s comparisons post hoc tests for multiple proportions;cP,
P-value for significant pairwise comparisons between study years;
incidence of TS and NTS with age. Second, the occur-rence of Salmonella bacteraemia show contrasting pat-terns for patients at extremes of ages. Specifically, TS and NTS bactereamias increased with age and were highest in children below 5 years, but declined gradually over ages 5 through 32, remaining fairly constant among the over 33 to 72-year-olds. A Pearson Product–moment Correlation was run to determine the relationship between incidence of Salmonella bactereamia and age. Whereas a negative correlation was observed between incidence of TS and age, only 21.5% of the incidence variance was accounted for by increases in patients’ age (r =−0.464; r2= 0.2153; P-value = 0.0297). In contrast, no demonstrable measure of covariation was recorded between NTS and age (r =−0.1795; r2= 0.0322; P-value = 0.2613). Overall, the highest number of culture positive cases for TS and NTS was observed in children 1 year of age (TS, n = 7/66,
10.6%; NTS, n = 20/115, 17.4%), and the least from amongst adults >33 years.
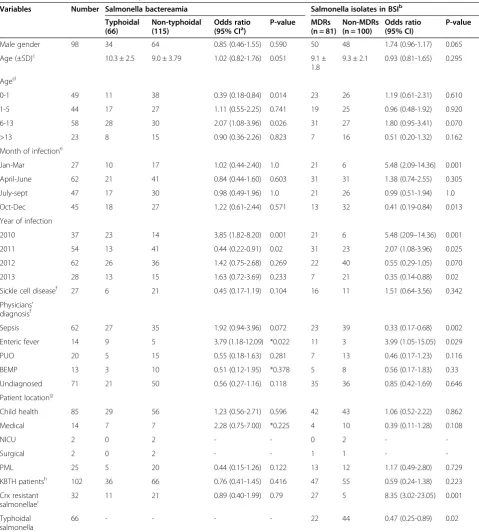
Predictors of Salmonella bactareamia
[image:5.595.59.540.88.462.2]In Table 3, patients with typhoidal bactreamia were matched to those with non-typhoidal bactreamia to iden-tify variables that increase the likelihood of developing TS BSI. Similar analysis were performed to determine factors associated with increased risk of Salmonella BSI by MDR salmonellae. Notable findings from univariate compari-sons were that patients with typhoidal salmonellae were less likely to be children under 1 year old [Odds ratio (OR), 0.39; 95% confidence interval (CI), 0.18-0.84; P-value, 0.014]; and were less often infected with MDR strains (OR, 0.47; 95% CI, 0.25-0.89; P-value, 0.001). The MDR salmonellae were more frequently cefuroxime resist-ant (OR, 8.35; 95% CI, 3.02-23.05; P-value, 0.001). Patients
Table 2 Antibiotic susceptibility patterns of typhoidal and non-typhoidal salmonellea recovered from blood cultures
Antibiotics Proportion of resistantSalmonellaspecies (%)
Total P-value 2010 2011 2012 2013 Correlation coefficientc,d
TSa NTSb TS NTS TS NTS TS NTS TS NTS TS NTS
Ampicillin 27/43 (62.7) 81/103 (78.6) 0.0466 12/14 (85.7) 20/23 (83.3) 9/13 (69.2) 28/37 (75.6) 3/13 (23.1) 23/30 (76.6) 3/10 (30.0) 10/13 (76.9) rs=−0.8,
P = 0.2
rs=−0.2,
P = 0.8
cefuroxime 11/63 (17.4) 21/104 (20.2) 0.6636 4/14 (28.5) 5/20 (25.0)) 4/13 (30.7) 11/38 (28.9) 2/26 (76.9) 4/31 (12.9) 1/10 (10.0) 1/15 (66.7) rs=−0.2,
P = 0.8
rs0.4,
P = 0.6
Cefotaxime 0 6/99 (6.1) - 0 1/23 (4.5) 0 3/41 (7.3) 0 2/35 (57.1) 0 0 - rs=−0.2,
P = 0.8
Amoxicillin/ Clavulante 1/12 (8.3) 11/20 (55.5) <0.01 NT 2/5 (40.0) NT 6/7 (85.7) 1/12 (8.3) 3/8 (37.5) 0 0 - rs=−0.8,
P = 0.2
Gentamicin 1/24 (4.1) 9/91 (9.9) 0.3892 0 2/23 (9.1) 0 5/35 (14.3) 1/24 (4..2) 2/33 (6.6) 0 0 rs= 0.26,
P = 0.74
rs=−0.8,
P = 0.2
Amikacin 1/11 (9.1) 2/71 (2.8) 0.3025 0 0 0 1/38 (2.6) 0 1/33 (3.3) 1/11 (9.1) 0 rs= 0.77,
P = 0.23
rs=0.26,
P = 0.75
Chloramphenicol 27/44 (61.4) 66/90 (73.3) 0.1579 10/13 (76.9) 10/19 (52.6) 12/13 (92.3) 25/33 (75.7) 5/18 (27.7) 22/27 (81.5) NT 9/11 (81.8) - rs=1
P = 0.001
Cotrimoxazole 24/174 (13.8) 54/87 (65.5) 0.0002 8/145 (5.5) 10/18 (55.5) 7/13 (53.8) 19/36 (52.7) 8/10 (80.0) 17/21 (80.9) 1/6 (16.7) 8/12 (66.7) rs=0.4,
P = 0.6
rs= 0.6,
P = 0.4
Tetracycline 26/37 (70.3) 60/83 (72.3) 0.8204 9/14 (64.2) 14/17 (82.3) 9/13 (69.2) 22/32 (68.8) 8/10 (80.0) 16/23 (69.5) 0 8/11 (72.7) rs=−0.2,
P = 0.8
rs=−0.2,
P = 0.8
Ciprofloxacin 0 1/ 135 (0.7) - 0 0 0 1/135 (0.7) 0 0 0 0 -
-a
TS, typhoidal salmonellae;b
NTS, non-typhoidal salmonellae;c
rs,Spearman’s Correlaltion Coefficient, measures the overall significant increase or decrease in antibiotic resistance level over the 4-year period;d
P, P-values at <0.05 are significant.
The number of salmonellae tested for susceptibility differ for each antibiotic. Results are thus recorded as proportions (number of resistant strains per total isolates tested for a particular antibiotic) with percentages in parenthesis.
Infectious
Diseases
(2014) 14:3857
Page
6
of
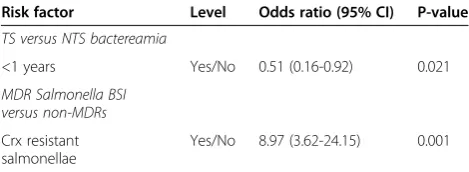
with typhoidal bactereamia had been more often pre-sumptively diagnosed with sepsis (OR, 1.92; 95% CI, 0.94-3.96; P-value, 0.072) or enteric fever (OR, 3.79; 95% CI, 1.18-12.09; P-value, 0.021). The MDR salmonellae were more often recovered from patients presumptively diag-nosed with enteric fever (OR, 3.99; 95% CI, 1.05-15.05; P-value, 0.029). Non-MDRs were more frequently ob-served among patients suspected of sepsis (n = 39/64, 60.9% versus n = 23/67, 34.3%; P-vaue, 0.002). Table 4 shows risk factors from multivariate analysis for Salmonella BSI infection with typhoidal strains pared to non-typhoidal isolates and with MDRs com-pared to non-MDRs. In the end, among patients with Salmonella BSI, those < 1 year old had reduced risk of non-typhoidal infections [Odds ratio, 0.51; 95% confi-dence interval (95% CI), 0.16-0.92, P-value 0.021]. Simi-larly, patients with cefuroxime resistant strans were at increased risk of having MDR Salmonella BSI (OR, 8.97; 95% CI, 3.62-24.15; P-value, 0.001).
Discussion
When poor public health prevails in low socio-economic settings, it is natural to speculate that it will have an impact on the health status of the people. This may manifest itself as an increase in the incidence of diseases, including Salmonella infections. Over the last decade, several studies have demonstrated the clinical significance of salmonellae causing infections in hospi-tals. Despite this rise, there are very few reports from West Africa, and Ghana in particular, on the occur-rence of Salmonella infections.
To our knowledge this is the first study conducted in Ghana across children and adult populations to docu-ment the prevalence, circulating serotypes, antimicrobial
resistance patterns, and seasonal variations in disease in-cidence, as well as predisposing factors for blood stream infections with salmonellae. Our study reveals an overall low prevalence (6.5%) of Salmonella bactereamia among patients in KBTH from January 2010 through December 2013. Approximately 64% (n = 115/181) of the isolates were non-typhoidal Salmonella. Our finding of salmon-ellae in KBTH is lower compared with that documented elsewhere in Ghana (50%) [18], but higher than those reported in other salmonellae-affected institutions in India (0.69%) [10], and Tanzania (4.7%) [8]. The Korle-bu Teaching Hospital from which these isolates were recovered serves as a referral centre for primary and secondary health care facilities mostly from the Southern sector of Ghana. Thus most of these patients are likely to have been treated with prior antibiotics which is likely to reduce the culture yields.
[image:7.595.57.539.89.264.2]There was a significant (P = 0.0002) prevalence of NTS (4.1%) compared to TS (2.4%) over the study period. The predominance of NTS over TS could be explained in part by the preponderance of children in our study population (86.8%, n = 151/174). In 2002, the estimated prevalence of TS (27.6%) predominated over that of NTS (40.7%) in patients with bacterial bloodstream infections in rural hospitals in Ghana [18]. The figures were lower (NTS, 18.8%; TS, 31.3%) 7 years later in the same study, but still higher for TS contrary to the results described in this study. In our study most patients were children, while patients who had their diagnostic sam-ples collected in the previous rural study were primarily adults with a reported interquartile range of 26 years. Using comparable methodology, our finding is much closer to the 59% NTS and 25% TS previously reported among bacteraemia children in this institution [19]. In a
Table 3 Baseline characteristics of patients
Variables Number Salmonella bactereamia Salmonella isolates in BSIb
Typhoidal (66)
Non-typhoidal (115)
Odds ratio
(95% CIa) P-value MDRs(n = 81) Non-MDRs(n = 100) Odds ratio(95% CI) P-value
Male gender 98 34 64 0.85 (0.46-1.55) 0.590 50 48 1.74 (0.96-1.17) 0.065
Age (±SD)c 10.3 ± 2.5 9.0 ± 3.79 1.02 (0.82-1.76) 0.051 9.1 ± 1.8
9.3 ± 2.1 0.93 (0.81-1.65) 0.295
Aged
0-1 49 11 38 0.39 (0.18-0.84) 0.014 23 26 1.19 (0.61-2.31) 0.610
1-5 44 17 27 1.11 (0.55-2.25) 0.741 19 25 0.96 (0.48-1.92) 0.920
6-13 58 28 30 2.07 (1.08-3.96) 0.026 31 27 1.80 (0.95-3.41) 0.070
>13 23 8 15 0.90 (0.36-2.26) 0.823 7 16 0.51 (0.20-1.32) 0.162
Month of infectione
Jan-Mar 27 10 17 1.02 (0.44-2.40) 1.0 21 6 5.48 (2.09-14.36) 0.001
April-June 62 21 41 0.84 (0.44-1.60) 0.603 31 31 1.38 (0.74-2.55) 0.305
July-sept 47 17 30 0.98 (0.49-1.96) 1.0 21 26 0.99 (0.51-1.94) 1.0
Oct-Dec 45 18 27 1.22 (0.61-2.44) 0.571 13 32 0.41 (0.19-0.84) 0.013
Year of infection
2010 37 23 14 3.85 (1.82-8.20) 0.001 21 6 5.48 (209–14.36) 0.001
2011 54 13 41 0.44 (0.22-0.91) 0.02 31 23 2.07 (1.08-3.96) 0.025
2012 62 26 36 1.42 (0.75-2.68) 0.269 22 40 0.55 (0.29-1.05) 0.070
2013 28 13 15 1.63 (0.72-3.69) 0.233 7 21 0.35 (0.14-0.88) 0.02
Sickle cell diseasef 27 6 21 0.45 (0.17-1.19) 0.104 16 11 1.51 (0.64-3.56) 0.342
Physicians’ diagnosisf
Sepsis 62 27 35 1.92 (0.94-3.96) 0.072 23 39 0.33 (0.17-0.68) 0.002
Enteric fever 14 9 5 3.79 (1.18-12.09) *0.022 11 3 3.99 (1.05-15.05) 0.029
PUO 20 5 15 0.55 (0.18-1.63) 0.281 7 13 0.46 (0.17-1.23) 0.116
BEMP 13 3 10 0.51 (0.12-1.95) *0.378 5 8 0.56 (0.17-1.83) 0.33
Undiagnosed 71 21 50 0.56 (0.27-1.16) 0.118 35 36 0.85 (0.42-1.69) 0.646
Patient locationg
Child health 85 29 56 1.23 (0.56-2.71) 0.596 42 43 1.06 (0.52-2.22) 0.862
Medical 14 7 7 2.28 (0.75-7.00) *0.225 4 10 0.39 (0.11-1.28) 0.108
NICU 2 0 2 - - 0 2 -
-Surgical 2 0 2 - - 1 1 -
-PML 25 5 20 0.44 (0.15-1.26) 0.122 13 12 1.17 (0.49-2.80) 0.729
KBTH patientsh 102 36 66 0.76 (0.41-1.45) 0.416 47 55 0.59 (0.24-1.38) 0.223
Crx resistant
salmonellaei 32 11 21 0.89 (0.40-1.99) 0.79 27 5 8.35 (3.02-23.05) 0.001
Typhoidal salmonella
66 - - - - 22 44 0.47 (0.25-0.89) 0.02
a
CI, confidence interval;b
BSI, blood stream infections; MDR, multidrg resistant strains;c
SD, standard deviation;d
Recorded for 64 TS and 110 NTS, and 75 MDR and
96 non-MDRs;e
Jan-Mar, January to March; Sep,september; Oct-Dec, October to December;f
Recorded for 47 TS and 85 NTS, and 67 MDRs and 64 non-MDRs; PUO,
pyrexia of unknown origin; BEMP, bone infections, endocarditis, meningitis, pneumonia;g
Recorded for 42 TS and 87 NTS, and 63 MDRs and 66 non-MDRs; NICU,
neonatal intensive care unit; PML, Princess-Marie Louis Children hospital;h
KBTH, Korle-Bu Teaching Hospital, recorded for 42 TS and 87 NTS, and 63 MDRs and 66
non-MDRs;i
Crx, cefuroxime, tested for 63 TS and 104 NTS, and 80 MDRs and 87 non-MDRs.
separate Ghanaian study that included 99 villages and 1,456 hospitalized children <15 years of age, the preva-lence of TS, driven largely by S. Typhi, was 2.4% [20]. We cannot directly compare our figures with those ob-served in that study because they did not assess NTS; nevertheless, they seem to provide a similar qualitative picture, in that the incidence of typhoidal fever is low in children. Elsewhere in Africa, NTS has been shown to be a prominent cause of blood stream infections in chil-dren [7,21-23]. The interrelationship between severe malaria, NTS, and HIV infection has been described [24]. However, a much more consistent association has been suggested between bactereamia due to NTS and se-vere malaria [24,25]. In this study, we are unable to de-termine the proportion of patients with HIV. But given that children in Ghana are prone to develop malaria due to the endemicity of the disease in this region, our find-ing is perhaps be more explained by the association of malaria with NTS.
Our study shows that TS and NTS bactereamia increased with age and were highest in children below 5 years, but declined gradually after the age of five years. This is corrob-orated by other studies in Ghana [20]. The high prevalence of Salmonella bloodstream infections in children under five could be explained by the relative poor hygiene observed by children within this group. We also observed that chil-dren under 1 year were less likely to be infected with TS and were less often infected with MDR strains; this is at variance with another study in Ghana which showed that the frequency of TS was low in children <2 years [20].
Peak isolation of Salmonella bloodstream infections occurred between the periods of March and November. This period marks the rainy season in Ghana [26], a time when floods occur leading to contamination of water bodies and an increase in the risk of developing Salmonella infections. Similar associations have been found in India [10] and Malawi [23] where the increase in incidence of invasive Salmonella infections has been associated with the rainy season.
Overall resistance of NTS and TS to ampicillin, tetra-cycline and chloramphenicol was over 70%. Such high resistance rates of Ghanaian salmonellae for ampicillin, chloramphenicol and tetracycline have been recently
described by Marks et al. [27]. There are other reports in Ghana where high resistance of salmonellae to these agents have been documented [5,18,20]. High resistance of salmonellae to antimicrobial agents have also been docu-mented elsewhere in subsaharan Africa [23,28,27]. In this current study, resistance of NTS and TS to ciprofloxacin and cefotaxime (recommended agents for treatment in Ghana) [29] was very low compared to reports from India where high resistance of about 13% to ciprofloxacin have been documented [30]. The low resistance ciprofloxacin and cefotaxime in Ghana have been coroborrated by others [18,20,31]. The relatively recent introduction of these agents as treatment options for invasive Salmonellosis may have contributed to such low resistance. Morover, resist-ance to these agents on the African continent is not wide-spread but is said to be an emerging problem [27].
There are some potential limitations of this study that should be discussed briefly. Blood stream infections from Korle-Bu were identified as including TS and NTS which constituted 6.5% of blood culture positive isolates. Whereas this may reflect the relative incidence of organisms in a Ghanaian tertiary care setting biased by its referral policies, we were unable to determine if these were nosocomial in-cidents or community acquired infections because of insuf-ficient data on inpatient and outpatient status. Another issue worth mentioning is the unavailability of data on nalidixic acid screening for the detection of reduced susceptibility of fluoroquinolone. To test forin vivo fluoro-quinolone resistance,in vitronalidixic acid is more appro-priate. Quinolone-therapy will fail in spite of apparent ciprofloxacin sensitivity if first resistance mutations have occurred leading toin-vitronalidixic acid resistance. Note also that by being retrospective, some patients had been stratified with predetermined definitions to which we were unable to fully assess clinical history for correlations that might contribute to the risk of TS or NTS infections. Pa-tient clinical outcome data would have been very helpful in the contextual interpretation of the multi-drug resistant strain infections. Despite these shortcomings, our findings offer baseline information needed to create the awareness of salmonellae blood stream infections in Ghanaian hospi-tals, and also the need for surveillance and control.
Conclusions
[image:9.595.56.291.101.187.2]In conclusion, we report a 6.5% prevalence of Salmonella bacteraemia at the Korle-Bu Teaching Hospital; with a pre-ponderance of NTS over TS. Children under five bear the brunt of the disease. Resistance to ciprofloxacin and cefo-taxime, the recommended antimicrobial agents for treat-ment remains low; although multi drug resistance to other agents is high. In Ghana where Salmonella infections are endemic, it is important to maintain surveillance of the dis-ease to allow for appropriate and timely interventions when required.
Table 4 Risk factors for Salmonella bactreamia
Risk factor Level Odds ratio (95% CI) P-value
TS versus NTS bactereamia
<1 years Yes/No 0.51 (0.16-0.92) 0.021
MDR Salmonella BSI versus non-MDRs
Crx resistant salmonellae
Yes/No 8.97 (3.62-24.15) 0.001
Abbreviations
μg:Microgram; ANOVA: Analysis of variance; ATCC: American Type Culture Collection; BEMP: Bone infections, endocarditis, meningitis, pneumonia; BSI: Blood stream infections; CI: Confidence interval; CLSI: Clinical and Laboratory Standards Institute; r2or r
s
2: Coeeficient of determination; Crx res.: Cefuroxime resistance; ESD: Eric Sampene-Donkor; Jan-Mar: January to March; KBTH: Korle-Bu Teaching Hospital; LAK: Labi Appiah-Korang; LOWESS: locally weighted scatter plot smoothing; MDR: Multidrug resistance; NICU: Neonatal intensive care unit; NJ: New Jersey; NOA: Naa Okaikor Addison; NON: Noah Obeng-Nkrumah; NTS: Non-typhoidal Salmonella; Oct-Dec: October to December; OR: Odds ratio; r: Pearson product–moment correlation coefficient; PMI: Princess-Marie Louis Children hospital; PUO: Pyrexia of unknown origin; ROC: Receiver Operating Characteristic; SD: Standard deviation; Sept: September; rs: Spearman’s rank correlation cooefficient; TS: Typhoidal Salmonella; USA: United States of America.
Competing interests
The authors declare that they have no competing interests.
Authors’contributions
LAK conceived the study; participated in its design, coordination, and collation of laboratory data; and helped to draft the manuscript. NON participated in the study design, coordination and collation of laboratory data; performed the statistical analysis; and helped to draft the manuscript. NOA participated in the study design and coordination and helped to draft the manuscript. ESD participated in the study design and coordination and helped to draft the manuscript. All authors read and approved the final manuscript.
Acknowledgements
We are grateful to staff of the Microbiology Department of the Korle-Bu Teaching Hospital for their support.
Author details
1Department of Microbiology, Korle-Bu Teaching Hospital, P.O. Box 88, Accra,
West Africa, Ghana.2Microbiology Department, University of Ghana Medical School, P.O. Box 4326, Accra, West Africa, Ghana.
Received: 22 September 2014 Accepted: 11 December 2014
References
1. Crump JA, Luby SP, Mintz ED:The global burden of typhoid fever. Bull World Health Organ2004,82:346–353.
2. Ekdahl K, De Jong B, Wollin R, Andersson Y:Travel-associated non-typhoidal salmonellosis: geographical and seasonal differences and serotype distribution.Clin Microbiol Infect2005,11:138–144.
3. Darton TC, Blohmke CJ, Pollard AJ:Typhoid epidemiology, diagnostics and the human challenge model.Curr Opin Gastroenterol2014,30:7–17. 4. Evans JA, Adusei A, Timmann C, May J, Mack D, Agbenyega T, Horstmann
RD, Frimpong E:High mortality of infant bacteraemia clinically indistinguishable from severe malaria.QJM2004,97:591–597. 5. Schwarz NG, Sarpong N, Hünger F, Marks F, Acquah SE, Agyekum A,
Nkrumah B, Loag W, Hagen RM, Evans JA, Dekker D, Fobil JN, Meyer CG, May J, Adu-Sarkodie Y:Systemic bacteraemia in children presenting with clinical pneumonia and the impact of non-typhoid salmonella (NTS). BMC Infect Dis2010,10:319.
6. Phoba M-F, Boeck HD, Ifeka BB, Dawili J, Lunguya O, Vanhoof R, Muyembe J-J, Geet CV, Bertrand S, Jacobs J:Epidemic increase in Salmonella bloodstream infection in children, Bwamanda, the Democratic Republic of Congo.Eur J Clin Microbiol Infect Dis2014,33:79–87.
7. Morpeth SC, Ramadhani HO, Crump JA:Invasive Non-Typhi Salmonella Disease in Africa.Clin Infect Dis2009,49:606–611.
8. Biggs HM, Lester R, Nadjm B, Mtove G, Todd JE, Kinabo GD, Philemon R, Amos B, Morrissey AB, Reyburn H, Crump JA:Invasive Salmonella infections in areas of high and low malaria transmission intensity in Tanzania. Clin Infect Dis2013,58(5):638–647.
9. Kothari A, Pruthi A, Chugh TD:The Burden of Enteric Fever.J Infect Dev Ctries 2008,2(4):253–259.
10. Mohanty S, Renuka K, Sood S, Das BK, Kapil A:Antibiogram pattern and seasonality of Salmonella serotypes in a North Indian tertiary care hospital. Epidemiol Infect2006,134:961–966.
11. Were T, Davenport GC, Hittner JB, Ouma C, Vulule JM, Ong’echa JM, Perkins DJ: Bacteremia in Kenyan Children Presenting with Malaria.J Clin Microbiol 2011,49:671–676.
12. MacLennan CA:Out of Africa: Links Between Invasive Nontyphoidal Salmonella Disease, Typhoid Fever, and Malaria.Clin Infect Dis2013, doi:10.1093/cid/cit803.
13. Paniker CKJ, Vimala KN:Transferable Chloramphenicol Resistance in Salmonella typhi.Nature1972,239:109–110.
14. Ackers M, Puhr ND, Tauxe RV, Mintz ED:Laboratory-based surveillance of salmonella serotype typhi infections in the united states: Antimicrobial resistance on the rise.JAMA2000,283:2668–2673.
15. Korle-Bu Teaching Hospital:Annual Report Korle-Bu Teaching Hospital.Accra, Ghana: Korle-Bu Teaching Hospital; 2011.
16. Cockerill FR, Wikler MA, Alder J, Dudley MN, Eliopoulos GM, Ferraro MJ, Hardy DJ, Hecht DW, Hindler JA, Patel JB, Powell M, Swenson JM, Thompson Jnr RB, Traczewski MM, Turnidge JD, Weinstein MP, Zimmer BM: CLSI.Performance standards for antimicrobial susceptibility testing; Twenty-second informational supplement. CLSI document M100-S22.Volume 32. Wayne, PA: Clinical and Laboratory Standard Institute, 2012.
17. Magiorakos A, Srinivasan A, Carey RB, Carmeli Y, Falagas ME, Giske CG, Harbarth S, Hindler JF:bacteria: an international expert proposal for interim standard definitions for acquired resistance.Clin Microbiol Infect2012,18:268–281. 18. Groß U, Amuzu SK, de Ciman R, Kassimova I, Groß L, Rabsch W, Rosenberg U,
Schulze M, Stich A, Zimmermann O:Bacteremia and Antimicrobial Drug Resistance over Time, Ghana.Emerg Infect Dis2011,17:1879–1882. 19. Wilkens J, Newman MJ, Commey JO, Seifert H:Salmonella bloodstream
infection in Ghanaian children.Clin Microbiol Infect1997,3:616–620. 20. Marks F, Adu-Sarkodie Y, Hünger F, Sarpong N, Ekuban S, Agyekum A, Nkrumah B,
Schwarz NG, Favorov MO, Meyer CG, May J:Typhoid Fever among Children, Ghana.Emerg Infect Dis2010,16:1796–1797.
21. Feasey NA, Dougan G, Kingsley RA, Heyderman RS, Gordon MA:Invasive non-typhoidal salmonella disease: an emerging and neglected tropical disease in Africa.Lancet2012,379:2489–2499.
22. Reddy EA, Shaw AV, Crump JA:Community-acquired bloodstream infections in Africa: a systematic review and meta-analysis.Lancet Infect Dis2010,10:417–432. 23. Gordon MA, Graham SM, Walsh AL, Wilson L, Phiri A, Molyneux E, Zijlstra EE, Heyderman RS, Hart CA, Molyneux ME:Epidemics of Invasive Salmonella enterica Serovar Enteritidis and S. enterica Serovar Typhimurium Infection Associated with Multidrug Resistance among Adults and Children in Malawi.Clin Infect Dis2008,46:963–969.
24. Bronzan RN, Taylor TE, Mwenechanya J, Tembo M, Kayira K, Bwanaisa L, Njobvu A, Kondowe W, Chalira C, Walsh AL, Phiri A, Wilson LK, Molyneux ME, Graham SM:Bacteremia in Malawian Children with Severe Malaria: Prevalence, Etiology, HIV Coinfection, and Outcome.J Infect Dis2007, 195:895–904.
25. Maltha J, Guiraud I, Kaboré B, Lompo P, Ley B, Bottieau E, Van Geet C, Tinto H, Jacobs J:Frequency of Severe Malaria and Invasive Bacterial Infections among Children Admitted to a Rural Hospital in Burkina Faso.PLoS One 2014,9:e89103.
26. Kouadio KY, Aman A, Ochou AD, Ali KE, Asamoi PA:Rainfall variability patterns in West Africa: Case of Cote d?Ivoire and Ghana.J Environ Scince Eng2011,5:1229–1238.
27. Graham S:Nontyphoidal salmonellosis in Africa.Curr Opin Infect Dis Oct 2010 2010,23:409–414.
28. Lunguya O, Lejon V, Phoba M-F, Bertrand S, Vanhoof R, Verhaegen J, Smith AM, Keddy KH, Muyembe-Tamfum J-J, Jacobs J:Salmonella Typhi in the Democratic Republic of the Congo: Fluoroquinolone Decreased Susceptibility on the Rise.PLoS Negl Trop Dis2012,6:e1921.
29. Ministry of Health: Republic of Ghana Standard Treatment Guidelines. Sixth edition. 2010. Accra, Ghana: Ghana National Drug Programme, 362–365. 30. Kumar S, Rizvi M, Berry N:Rising prevalence of enteric fever due to
multidrug-resistant Salmonella: an epidemiological study.J Med Microbiol 2008,57:1247–1250.