R E S E A R C H A R T I C L E
Open Access
HIV prevalence, related risk behaviors, and
correlates of HIV infection among people
who use drugs in Cambodia
Heng Sopheab
1*, Chhorvann Chhea
1, Sovannary Tuot
2and Jonathan A. Muir
3Abstract
Background:Although HIV prevalence in Cambodia has declined to 0.6% among the general population, the prevalence remains high among female sex workers (14.0%) and men who have sex with men (2.3%). Over the past 10 years, the number of people who use drugs (PWUDs) has increased considerably. PWUDs, especially people who inject drugs (PWIDs), who have multiple sex partners or unprotected sex contribute to a higher HIV prevalence. This paper aims to estimate the prevalence of HIV across PWUD groups and to identify factors associated with HIV infection.
Methods:Respondent-driven sampling (RDS) was used to recruit 1626 consenting PWUDs in 9 provinces in 2012. Questionnaires and blood specimens were collected. HIV prevalence estimates were calculated using RDSAT 7.1. Individual weightings for HIV were generated with RDSAT and used for a weighted analysis in STATA 13. Multivariate logistic regression was used to identify the independent factors associated with HIV prevalence.
Results:Most of the PWUDs were men (82.0%), and 7.3% were PWIDs. Non-PWIDs, especially users of amphetamine-type stimulants (ATS), represented the larger proportion of the participants (81.5%). The median age for of the PWUDs was 24.0 years (IQR: 20–29). The HIV prevalence among the PWUDs was 5.1% (95% CI: 4.1–6.2), 24.8%, among PWIDs and 4.0% among non-PWIDs. The HIV prevalence among female PWIDs was 37.5, and 22.5% among male PWIDs. Four factors were independently associated with HIV infection: female sex, with AOR = 7.8 (95% CI: 3.00–20.35); age groups 21–29 and older (AOR = 10.3, 95% CI: 1.2–20.4); and using drugs for≥12 months (AOR = 4.0, 95% CI: 1.38–11.35). Finally, injecting drugs remained a strong predictor of HIV infection, with an AOR = 4.1 (95% CI: 1.53–10.96).
Conclusion:HIV prevalence remains high among PWIDs. Harm reduction efforts, such as needle and syringe provision programs, must improve their coverage. Innovative strategies are needed to reach sub-groups of PWUDs, especially women who inject drugs. Furthermore, the large proportion of non-PWIDs, especially ATS users, should not be ignored. Therefore, combined HIV prevention and harm reduction programs should integrate ATS users.
Keywords:HIV, People who use drugs, People who inject drugs, PWID, Non-PWID, ATS users, Cambodia
Background
Over the past 25 years, remarkable progress has been made in the fight against HIV in Cambodia. The HIV prevalence has fallen from 2.0% (1999) to 0.6% (2015) among the general population aged 15–49 years [1]. However, a high prevalence is still observed among key populations, such as female sex workers (14.0 to 15.0%)
[2,3] and men who have sex with men (2.3%) [4].
Since 2004, evidence has indicated an increase in the number of people who use drugs (PWUD) and the avail-ability of illicit drugs in Cambodia. The country has changed from a drug trafficking transit location to a site of drug production and use [5,6]. The country has been
affected by illicit drug abuse problems, mainly
amphetamine-type stimulant (ATS) use. Notable in-creases have been observed among youth and sex workers. A study among youth out of school in 2010 showed that approximately 4% of young women and 15% of young men aged 10 to 24 years reported ever having used drugs [7].
* Correspondence:hsopheab@niph.org.kh
1School of Public Health at the National Institute of Public Health, Lot #80,
Samdech Penn Nouth Blvd. Tuol Kork District, Phnom Penh, Cambodia Full list of author information is available at the end of the article
PWUDs, especially people who inject drugs (PWIDs) who share syringes and needles with multiple partners or have unprotected sex contribute considerably to a higher HIV prevalence. Non-injecting drug users are at a higher risk of experiencing physical and mental health problems [8] and poly-substance abuse disorder. They also may be-come injecting drug users with an increased risk of HIV in-fection [9–11]. The 2012 estimate of the size of this key population, conducted by the National Center for HIV/ AIDS, Dermatology and STIs (NCHADS), suggested that there were approximately 28,000 PWUDs in Cambodia; half of them were ATS users, and close to 7% reported injecting heroin [12].
In Asia, the HIV prevalence among PWIDs varies from country to country and within countries. For ex-ample, the HIV prevalence among PWIDs was 36.4% in Indonesia (2011), 25.2% in Thailand, 16.6% in Malaysia, 10.5% in Vietnam, and 6.4% in China [13, 14]. Factors that may account for this variability between countries include the intensity of harm reduction programs, over-lapping risk behaviors (e.g. interaction with paid sex, and having multiple sex partners) and drug injection and social and sexual networking [15,16].
In the past, studies have indicated that factors associ-ated with the HIV prevalence among PWIDs include socio-demographic characteristics (e.g., sex, older age, marital status, less education), risky sexual behaviors (e.g., paid sex, sex exchanged for drugs) and risky behaviors during drug use (e.g., needle and syringe sharing, using injected drugs for more than one year) [14,17,18].
In Cambodia, there have been a few studies on drug use policy and harm reduction intervention grams, such as needle and syringe distribution pro-grams [19, 20]. For example, Chheng et al indicated that in 2003, the Government of Cambodia acknowl-edged the importance and necessity of harm reduc-tion approaches to prevent HIV transmission among PWUDs and their sexual partners. However, the harm reduction intervention was never fully implemented due to limited awareness and support from law enforcement at the local level as well as budgeting commitment [19]. The failure of this policy indeed had a negative impact on HIV prevention and harm reduction for the highest-risk groups, such as PWUDs.
Little is known about the characteristics and patterns of drug use in Cambodia. Moreover, the HIV prevalence among this key population has never been estimated na-tionwide. Therefore, this paper, which used data from a study conducted in late 2012–2013 [12], sought to esti-mate the prevalence of HIV infection among people who inject drugs (PWIDs) and drug users who do not inject drugs (non-PWIDs), and examine factors associated with HIV infection in these populations.
Methods
Study sites and population
Nine provinces were purposively selected for the study:
Phnom Penh, Sihanoukville, Kampong Speu,
Battambang, Banteay Meanchey, Siem Reap, Kampong Cham, Prey Veng, and Svay Rieng. These provinces were selected based on a program report indicating that they accounted for 85% of all PWUDs in Cambodia and that drug abuse activity in these provinces was significantly high (Consultative Technical Working Group on Drug and HIVAIDS, 2012). Study participants were individuals at least 15 years old who reported using any illicit drug, including heroin, cocaine, opiates, amphetamines, meth-amphetamines, yama, ice, crystal and ketamine, in the past 12 months.
In the analysis, the 9 provinces were separated into two groups based on the HIV prevalence among
PWUDs: those with an HIV prevalence ≥4% were
assigned to the high-risk province group (Sihanoukville, Phnom Penh, Battambang, and Banteay Meanchey), and those with a lower prevalence were assigned to the low-risk province group (Kampong Speu, Kampong Cham, Prey Veng, Svay Rieng and Siem Reap).
Sampling and sample size
We used respondent-driven sampling (RDS), a network referral method, to recruit this hard-to-reach population (PWUDs) to ensure a representative sample [21]. At the beginning, 36 diverse seeds (4 seeds per province) were re-cruited through local NGOs working with drug users. They were selected based on sex (male/female) and type of drug use (injecting/non-injecting). Each seed was asked to recruit other 2 eligible PWUDs from their personal net-work using study coupons, with the aim of having 4 or 5 waves of recruitment to reach equilibrium [21]. In total, we approached 1662 participants. However, 36 of the 1662 (2.2%) were not eligible after the initial screening process, resulting in the final sample size of 1626.
Data collection: Risk behaviors and blood specimens
behaviors. The questionnaire was based on a small-scale survey of drug users in Cambodia in 2006 and on pre-testing [22]. The interviews lasted approximately 30 min.
A 5-ml blood sample was drawn and kept in a tube with an anti-coagulant to prevent the blood from clot-ting. At the end of each day, the blood samples were sent to a laboratory at a Voluntary Counseling and Test-ing Center (VCT) near the study recruitment site.
Monitoring and HIV testing and quality control
The interviewers and supervisors were selected from among those who had experience working with these key populations. Both the interviewers and supervisors were trained for 3 days in Phnom Penh on the recruit-ment process, informed consent procedures and the questionnaire-based interview procedure. The supervi-sors were responsible for ensuring that RDS sampling was properly performed, the questionnaires were prop-erly completed, and the informed consent process was strictly followed to ensure that the participants could re-fuse or withdraw from the study at any time.
At VCT, HIV testing was performed using 2 rapid tests. First, blood samples were tested with Determine HIV 1/2 (Alere HIV). Specimens that were reactive in the first test were retested with HIV 1/2 Stat-Pak ( Chem-bio Diagnostic System, Inc). This standard serial testing algorithm has been used by the national HSS for groups that have an HIV prevalence greater than 10% [2]. Then, the sera were prepared and stored before being sent to the NCHADS laboratory for quality control and storage.
All HIV-positive specimens plus a randomly selected 10% of negative specimens were tested for quality control. Serial testing was performed by the NCHADS laboratory using two ELISA tests (Vironostika, BioMérieu; and Murex 1.2.0, Murex DiaSorin Biotech). The Vironostika test was used first. If the result was non-reactive, the test was considered HIV negative. If the Vironostika test was reactive, the results were confirmed via the Murex test.
Statistical analysis
HIV prevalence estimates were calculated using the RDS analysis tool RDSAT 7.1 [23]. RDSAT was developed to minimize biases associated with the social network refer-ral process by weighting the respondents’ probability of being recruited into the RDS sample and recruitment patterns [21]. Individual weights generated with RDSAT for HIV status were imported into STATA to adjust for the RDS sampling process [24]. Weighted bivariable ana-lysis and multivariate logistic regression (SVY) were used to identify factors associated with HIV prevalence. Po-tential confounding factors, regardless their significant level, and factors that were associated with HIV infec-tion in the bivariable analysis at p< 0.20 [25] were
included in the multivariate logistic regression; the in-cluded factors were sex, age group, provincial region, marital status, education level, drug use type, number of paid sex partners, and duration of drug use.
Results
Demographic characteristics of PWUDs
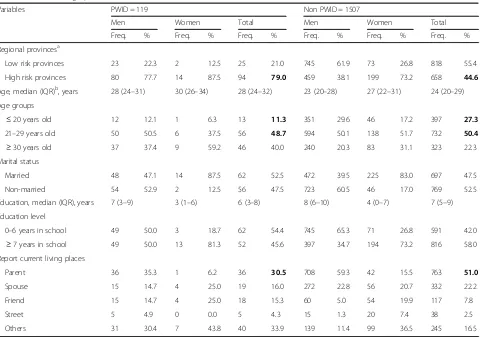
Of the 1626 respondents, approximately 7.3% were PWIDs. Most of the PWUDs were men (82.0%), while women represented approximately 18.0%. The median age of the PWIDs was 28.0 years, with an interquartile range (IQR) of 24–32 years; the median age for the non-PWIDs was 24.0 years (IQR: 20–29 years). For both groups, the women were approximately 2–3 years older, and the PWIDs tended to be slightly older than the non-PWIDs(Table1). Approximately half of the partici-pants were un-married (i.e., single, widowed, or di-vorced). The median number of years of schooling was 6.0 (IQR: 3–8 years) for the PWIDs and 7.0 (IQR: 5– 9 years) for the non-PWIDs. More than 40% of the PWIDs reported either living with their parents or spouse, while close to 75% of the non-PWIDs reported similar living arrangements. The PWID group was more likely to live with friends (15.3% vs. 7.8%).
Drug use behavior among PWUDs
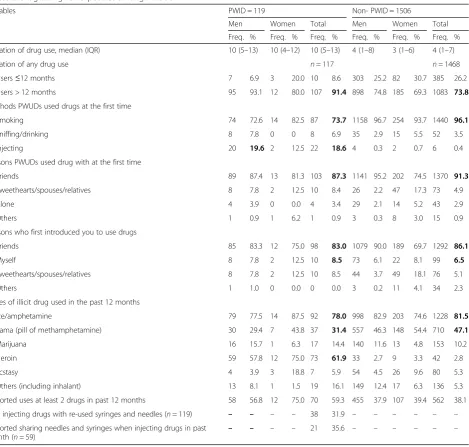
The median duration of drug use for the PWIDs was 10.0 years (IQR: 5–13 years), compared with 4.0 years (IQR: 1–7 years) for the non-PWIDs (Table 2). Less than 20% of the PWIDs first started using drugs by injection; the rest mainly began by smoking and sniff-ing drugs. Both groups (91%) reported first startsniff-ing drug use with friends and peers. Frequently, they were first introduced to drugs by their friends (85.9%), followed by self-initiation (8.5 and 6.6% for PWIDs and non-PWIDs, respectively). The drugs that the PWIDs most commonly reported using in the past 12 months were ice/amphetamine (78.0%) and heroin (61.9%), while the non-PWIDs reported using ice/amphetamine (81.5%) and yama (47.1%), a pill containing methamphetamine. Moreover, close to 60 and 38% of the PWIDs and non-PWIDs, respectively, reported having used at least 2 drugs in the past 12 months. In addition, 35.6% the PWIDs reported having shared needles and syringes in the past month.
Sexual behavior among PWUDs
than the men among both the PWIDs (85.8%) and the non-PWIDs (89.4%). However, reports of always using condoms during paid sex did not exceed 50% among the PWIDs but were greater than 60% among non-PWIDs. Condom use among the women in the PWID group was as low as 25%. In addition, reports of condom use with regular partners (spouses, intim-ate partners, cohabiting partners) was as low as ≤30% in both groups.
HIV prevalence among PWUDs
As shown in Table 4, the overall HIV prevalence
among PWUDs was 5.1% [95% CI: 4.1–6.2]. The HIV
prevalence among PWIDs was 24.8% [95% CI: 7.3–
39.9]; among non-PWIDs, it was 4.0% [95% CI: 2.7– 5.5]. The HIV prevalence among female PWIDs (37.5, 95% CI: 10.9–64.1) was higher than that among male PWIDs (22.5%, 95 CI: 14.0–30.9). A similar pattern was found among female non-PWIDs (11.5, 95% CI: 7.9–15.7) and male non-PWIDs (1.5, 95% CI: 0.8– 2.2).
Factors associated with HIV infection in the logistic regression
[image:4.595.60.540.96.433.2]The details of the bivariate analysis are presented in Table 5. The following factors were significantly associ-ated with HIV: higher-risk province group [odds ratio (OR) = 5.2, 95% CI: 2.6–10.5] (with the lower-risk prov-ince group used as the referent group); female (males as the reference) (OR = 5.6, 95% CI: 3.0–10.6); and older age groups (aged≤20 years as the reference) 21–29 (OR = 21.2), 30 and older (OR = 78.5). Low education level (secondary/higher education as the reference) and mar-ried PWUDs (non-marmar-ried as the reference) were associ-ated with HIV infection. The PWIDs had approximately 5 times higher odds of HIV infection than the non-PWIDs (OR = 4.6, 95% CI: 2.3–9.2). Furthermore, having had ≥2 paid sex partners in the past month and having used drugs for ≥12 months were significantly associated with HIV infection, with OR = 3.5 (95% CI: 1.6–7.5) and OR = 2.7 (95% CI: 1.3–5.6), respectively. The associations for other covariates, including reported consistent condom use with paid sex partners in the past 12 months and multiple drug use, were not statistically significant.
Table 1Socio-demographic characteristics of PWUD
Variables PWID = 119 Non PWID = 1507
Men Women Total Men Women Total
Freq. % Freq. % Freq. % Freq. % Freq. % Freq. %
Regional provincesa
Low risk provinces 23 22.3 2 12.5 25 21.0 745 61.9 73 26.8 818 55.4
High risk provinces 80 77.7 14 87.5 94 79.0 459 38.1 199 73.2 658 44.6
Age, median (IQR)b, years 28 (24–31) 30 (26–34) 28 (24–32) 23 (20–28) 27 (22–31) 24 (20–29)
Age groups
≤20 years old 12 12.1 1 6.3 13 11.3 351 29.6 46 17.2 397 27.3
21–29 years old 50 50.5 6 37.5 56 48.7 594 50.1 138 51.7 732 50.4
≥30 years old 37 37.4 9 59.2 46 40.0 240 20.3 83 31.1 323 22.3
Marital status
Married 48 47.1 14 87.5 62 52.5 472 39.5 225 83.0 697 47.5
Non-married 54 52.9 2 12.5 56 47.5 723 60.5 46 17.0 769 52.5
Education, median (IQR), years 7 (3–9) 3 (1–6) 6 (3–8) 8 (6–10) 4 (0–7) 7 (5–9)
Education level
0–6 years in school 49 50.0 3 18.7 62 54.4 745 65.3 71 26.8 591 42.0
≥7 years in school 49 50.0 13 81.3 52 45.6 397 34.7 194 73.2 816 58.0 Report current living places
Parent 36 35.3 1 6.2 36 30.5 708 59.3 42 15.5 763 51.0
Spouse 15 14.7 4 25.0 19 16.0 272 22.8 56 20.7 332 22.2
Friend 15 14.7 4 25.0 18 15.3 60 5.0 54 19.9 117 7.8
Street 5 4.9 0 0.0 5 4.3 15 1.3 20 7.4 38 2.5
Others 31 30.4 7 43.8 40 33.9 139 11.4 99 36.5 245 16.5
a
High risk provinces: Sihanoukville, Phnom Penh, Battambang, Banteay Meanchey Low risk provinces: Kampong Speu, Kampong Cham, Prey Veng, Svay Rieng, Siem Reap
b
In the final multivariable model, 4 factors were found to be independently associated with HIV infec-tion: sex (women), older age groups, injected drug use and duration of drug use ≥12 months (Table 5). Women had higher odds of HIV infection than men, with an adjusted OR (AOR = 7.8, 95% CI: 3.0–20.4), and participants older than 20 years had a higher odds of HIV infection: age groups 21–29 (AOR = 10.3, 95% CI: 1.2–20.4) and age group ≥30 (AOR = 36.4, 95% CI: 3.6–369.4). Injected drug use remained a strong predictor of HIV infection, with AOR = 4.1 (95% CI: 1.5–10.9). Additionally, the longer a PWUD had used drugs, the higher their odds of HIV infec-tion, with AOR = 4.0 (95% CI: 1.4–11.4).
Discussion
This study reported a high prevalence of HIV among PWIDs and a large proportion of non-PWIDs, espe-cially ATS users. Most of the PWUDs were sexually active, and they indicated a high proportion of paid sex and low consistent condom use, especially among PWIDs. The main predictors of HIV infection in-cluded female sex, injected drug use, older age and drug use for ≥12 months.
[image:5.595.69.539.95.542.2]In our study, the HIV prevalence among PWIDs was approximately 25%, which is similar to the preva-lence levels for Cambodia reported a few years ago by Mathers et al., who reviewed and estimated the global HIV prevalence among drug users and the size of the Table 2Drug taking risk exposures among PWUDs
Variables PWID = 119 Non- PWID = 1506
Men Women Total Men Women Total
Freq. % Freq. % Freq. % Freq. % Freq. % Freq. %
Duration of drug use, median (IQR) 10 (5–13) 10 (4–12) 10 (5–13) 4 (1–8) 3 (1–6) 4 (1–7)
Duration of any drug use n= 117 n= 1468
Users≤12 months 7 6.9 3 20.0 10 8.6 303 25.2 82 30.7 385 26.2
Users > 12 months 95 93.1 12 80.0 107 91.4 898 74.8 185 69.3 1083 73.8
Methods PWUDs used drugs at the first time
Smoking 74 72.6 14 82.5 87 73.7 1158 96.7 254 93.7 1440 96.1
Sniffing/drinking 8 7.8 0 0 8 6.9 35 2.9 15 5.5 52 3.5
Injecting 20 19.6 2 12.5 22 18.6 4 0.3 2 0.7 6 0.4
Persons PWUDs used drug with at the first time
Friends 89 87.4 13 81.3 103 87.3 1141 95.2 202 74.5 1370 91.3
Sweethearts/spouses/relatives 8 7.8 2 12.5 10 8.4 26 2.2 47 17.3 73 4.9
Alone 4 3.9 0 0.0 4 3.4 29 2.1 14 5.2 43 2.9
Others 1 0.9 1 6.2 1 0.9 3 0.3 8 3.0 15 0.9
Persons who first introduced you to use drugs
Friends 85 83.3 12 75.0 98 83.0 1079 90.0 189 69.7 1292 86.1
Myself 8 7.8 2 12.5 10 8.5 73 6.1 22 8.1 99 6.5
Sweethearts/spouses/relatives 8 7.8 2 12.5 10 8.5 44 3.7 49 18.1 76 5.1
Others 1 1.0 0 0.0 0 0.0 3 0.2 11 4.1 34 2.3
Types of illicit drug used in the past 12 months
Ice/amphetamine 79 77.5 14 87.5 92 78.0 998 82.9 203 74.6 1228 81.5
Yama (pill of methamphetamine) 30 29.4 7 43.8 37 31.4 557 46.3 148 54.4 710 47.1
Marijuana 16 15.7 1 6.3 17 14.4 140 11.6 13 4.8 153 10.2
Heroin 59 57.8 12 75.0 73 61.9 33 2.7 9 3.3 42 2.8
Ecstasy 4 3.9 3 18.8 7 5.9 54 4.5 26 9.6 80 5.3
Others (including inhalant) 13 8.1 1 1.5 19 16.1 149 12.4 17 6.3 136 5.3
Reported uses at least 2 drugs in past 12 months 58 56.8 12 75.0 70 59.3 455 37.9 107 39.4 562 38.1
Last injecting drugs with re-used syringes and needles (n= 119) – – – – 38 31.9 – – – – – –
Reported sharing needles and syringes when injecting drugs in past
month (n= 59) – – – –
HIV-infected drug user population and injecting drug user population by country [26].
Despite the lower prevalence of HIV (4%) among non-PWIDs, the large non-PWUDs population (90%) re-mains a public health and a matter of social concern for several reasons. First, recent reports may indicate shift-ing patterns of HIV infection in Cambodia from non-PWIDs to PWIDs. Our findings indicated that less than 20% of PWIDs initially injected drugs. Additionally, a report from the KHANA Drop-In Center (DiC) showed that less than 5% of PWUDs who visited the center were originally injected drug users. However, in one year of the DiC implementation, approximately 3% of its visitors converted from non-PWIDs to PWIDs
(Personal communication with DiC).Therefore, these raise a concern what prompts PWUDs to become PWIDs and the possibility that that HIV transmission among non-PWIDs in Cambodia could increase in the future due to their related risk behaviors and the overlapping social and sexual networks among PWUDs
[16, 27]. Additionally, the high proportion of
transac-tional sex among female PWUDs in this study, particu-larly among non-PWID women, indicates the possibility that infection could be transmitted to non-injected drug
users and then to the general population through trans-actional sex. Consequently, these factors potentially con-tribute to an increase in overall HIV prevalence in Cambodia. Therefore, it is important for HIV and drug use intervention programs to significantly target these high-risk groups.
[image:6.595.57.534.99.344.2]Needle and syringe sharing among PWIDs remains high, and implements are often shared with little or no cleaning. Given that sterile needle and syringes programs (NSPs) are a key component of harm reduction and HIV prevention efforts [15, 28–30], more targeted interven-tions for PWIDs should be implemented continuously, without law enforcement barriers, to ensure access to adequate supplies of clean needles and syringes. Prior studies estimated that interventions (i.e., opioid substitu-tion, needle exchange and antiretroviral therapy) that at-tain at least 60% coverage could cut future infections among PWIDs roughly in half, thereby decreasing the HIV epidemic among PWIDs [28]. However, the pro-gram report suggested that NSPs had very low coverage - only 16% of PWIDs reported accessing NGO drop in centers in the past 12 months [31]. Further research should include NSP assessments to improve program in-terventions. Additionally, the large proportion of Table 3Sexual risk exposures to HIV among PWUDs
Variables PWID = 113 Non- PWID = 1335
Men Women Total Men Women Total
Freq. % Freq. % Freq. % Freq. % Freq. % Freq. %
Report of ever had sex 96 93.2 16 100.0 112 94.1 1063 88.6 256 94.5 1319 89.7
Age at first sex, median (IQR), years 17.5 (17–18) 18 (16–20) 18 (17–20) 18 (17–20) 18 (16–19) 18 (16–19)
Age at first sex in years
≤18 years old 73 76.0 10 62.5 83 74.1 557 52.5 166 64.6 723 54.9
> 18 years old 23 24.0 6 37.5 29 25.9 504 47.5 91 35.4 595 45.1
Ever had sex in the past month among those who ever reported sex 53 56.4 7 43.4 60 54.6 713 67.5 206 80.2 919 70.0
Report number of paid and paying sex partner in the past month n= 99 n= 1181
No sex partner 73 79.3 1 14.2 74 74.8 854 82.1 15 10.6 869 73.6
≤2 sex partners 11 12.0 3 42.8 14 14.1 141 13.6 45 31.9 186 15.8
≥3 sex partners 8 8.7 3 42.8 11 11.1 35 4.3 81 57.5 126 10.6
Always condom use with paid and paying sex partners in the past 12 months
44 43.1 4 25.0 48 40.6 746 62.1 165 60.7 911 61.8
Condom use in last sex in exchange for money 52 86.7 6 85.7 58 86.6 683 88.4 136 88.9 819 88.4
Always condom use with regular partners in the past 12 months 17 30.4 4 30.8 21 30.4 191 25.3 36 17.2 227 23.6
Condom use last time when had sex with regular partner 29 46 8 61.4 37 49 409 50.7 96 43.1 505 49.1
Table 4HIV prevalence among PWUDs
PWID Non-PWID
Men Women Total Men Women Total
% (95% CI) % (95% CI) % (95% CI) % (95% CI) % (95% CI) % (95% CI)
[image:6.595.59.540.678.733.2]non-PWIDs, especially ATS users, is worrisome and very challenging for prevention efforts since effective preven-tion strategies for ATS use has little evidence base. A study of an integrated HIV and drug prevention program
with conditional cash transfer was conducted in
Cambodia to test the use of behavioral interventions among ATS users for improved prevention measures for this group; the results have not been published [32]. How-ever, another formative research among study by Carrico
et al. to reduce the risk of ATS among entertainment
workers using the conditional cash transfer with behav-ioral intervention found the mixing results [33].
[image:7.595.58.537.100.577.2]The findings of a higher risk of HIV among women who use drugs are consistent with the literature, which high-lights issues associated with increased vulnerability for women (e.g., child care, concomitant sex work, lack of ac-cess to health care, mental and physical health problems, reproductive health issues, sexually transmitted infections, stigma, and violence) [8,30]. Beyond these issues, female PWUDs with overlapping risk behaviors, such as Table 5Risk factors associated with HIV in bivariate and multivariable logistic regression among drug users
Variables N= 1583 Total sample (N= 1186)
OR (95% CI) Pvalueb AORa(95% CI) Pvalueb
Provincial groupa
Low risk provinces Referent Referent
High risk provinces 5.2 (2.59–10.56) < 0.001 1.9 (0.78–4.79) 0.154
Sex of drug users
Men Referent Referent
Women 5.6 (2.95–10.59) < 0.001 7.8 (3.00–20.35) < 0.001
Age group in years
≤20 Referent Referent
21–29 21.2 (2.73–164.16) 0.003 10.3 (1.20–89.39) 0.033
≥30 78.5 (10.53–584. 18) < 0.001 36.4 (3.59–369.36) 0.002
Marital status
Non-married Referent Referent
Married 2.9 (1.37–6.01) 0.005 0.48 (0.17–1.47) 0.205
Education level
≤6 years (Primary) 2.4 (1.22–4.68) 0.011 0.92 (0.37–2.27) 0.866 > 6 years (Secondary and higher) Referent Referent
Drug use type
Non-PWID Referent Referent
PWID 4.6 (2.31–9.19) < 0.001 4.1 (1.53–10.96) 0.005
Number of paid and paying sex partners In past month
< 2 partners Referent Referent
≥2 partners 3.5 (1.64–7.48) 0.001 1.1 (0.42–2.47) 0.961
Duration of using drugs
≤12 months Referent Referent
> 12 months 2.7 (1.27–5.63) 0.010 4.0 (1.38–11.35) 0.010
Consistent condom use with casual
partner in the past 12 months
Yes Referent
No 1.1 (0.59–2.10) 0.735 – –
More than one drug use in past 12 months
One drug Referent
More than one drug 1.1 (0.59–2.10) 0.735 – –
a
High risk provinces: Sihanoukville, Phnom Penh, Battambang, Banteay Meanchey
b
The results in this table were weighted
transactional sex and drug use, often have less power to negotiate safe sex practices [8,17,34]. According to Azim et al., female PWUDs who were sex workers were more likely than non-drug using sex workers to engage in street-based sex work, which is associated with high-risk sex and heightened levels of violence due to different types of partners [30].
Given the high HIV prevalence among drug users with a high frequency of paid sex partners, focused intervention to assist this sub-group is an important public health goal in Cambodia. Evidence in prior studies suggests that fe-male PWIDs who are sex workers constitute a “bridge population”[35] that can lead to a the spread of HIV epi-demics from PWIDs to heterosexual populations [30,36].
Multiple structural and behavioral interventions spe-cifically designed for female PWUDs have been imple-mented globally with tailor-made interventions adapted to women’s specific needs [30]. For example, a study in-vestigating the effectiveness of HIV/STI safer sex skill-building groups for women found that these groups improved safer sex practices compared with standard HIV/STI education [37]. However, many women still struggle alone to change risky behaviors with their part-ners, and in these situations, it may be more effective to engage couples in harm reduction interventions [30]. Also, access to legal and heath care supports should be addressed in the multiple structural interventions.
Comprehensive interventions that address individual and socio-environmental factors are more effective than a single intervention alone [29]. Such interventions need to include many of the interventions outlined above and should also outline steps for improving understanding and sensitivity among professionals who interact with PWUDs (e.g., health care workers or NGO staff ) [30]. This is par-ticularly the case with law enforcement. As a recent study surmised, “Fear of accessing harm reduction and health services and police’s negative attitudes and practices to-wards key populations present major barriers to HIV pre-vention efforts in Cambodia” [19, 38]. Efforts to reduce the fear of retaliation and/or stigma may help improve the effectiveness of broader intervention programs.
This study has several limitations.First, self-reports of sensitive information (i.e., drug use and risky sexual be-haviors) and social desirability may result in the under-reporting of actual information. Second, the life-time and 12-month recalls used in some questions may have caused recall issues. Third, although RDS was used to recruit a representative sample, we are not sure how well the seeds were represented and referred or how many PWUDs did not participate in the study (mostly PWIDs, due to self-stigma or discrimination), and we do not know the different characteristics and HIV-related risk behaviors of those who did not participate in the study. Given these factors, we may have underestimated
the HIV prevalence among PWIDs - especially female PWIDs, given the small samples - and weakened the as-sociation between the predictors and the HIV preva-lence. Despite these limitations, this is the first ever large-scale survey conducted in Cambodia among PWUDs using the RDS method and involving many key
stake- holders’ involvement (NCHADS, NACD,
UNAIDS, NGOs). It provides useful and informative findings to guide HIV and drug use program planning and policy for future interventions.
Conclusion
HIV prevalence among PWUDs remains high especially among PWIDs and women. Harm reduction programs, such as NSP, must be improved in scope and scale. In-novative strategies are needed to reach sub-groups of PWUDs, especially women who inject drugs. Further-more, the large proportion of non-PWIDs, especially ATS users, should not be ignored; combined HIV prevention and harm reduction programs should integrate ATS users.
Abbreviations
ART:Anti-retroviral therapy;; ATS: Amphetamine-type stimulants (ATS); DiC: Drop-In Center; HSS: HIV Sentinel Surveillance; NACD: National Authority for Combating Drugs; NCHADS: National Center for HIV/AIDS, Dermatology and STIs; NSP: Needles and Syringes Program; PWIDs: People who inject drugs; PWUDs: People who use drugs; RDS: Respondent-driven sampling; VCT: HIV Voluntary Counseling and Testing Center
Acknowledgements
We would like to thank the organizations that were actively involved in the study’s Technical Advisory Group (TAG): NACD, NCHADS, the National Program for Mental Health, MoEYS, MoSVY, KHANA, AusAID, UNAIDS, PSI, UNODC, Friends Int’l- Mith Samlanh, FHI 360, UNICEF and WHO. Our sincere thanks go to H.E. Meas Vyrith, Secretary General of NACD; Dr. Mean Chhi Vun (Director of NCHADS); and Dr. Oum Sopheap, KHANA Executive Director, who helped to facilitate the administrative and financial processes of the study. Special thanks to the members of the TAG, who played significant roles in the completion of this work: Mr. Kao Boumony (NACD), Dr. Mun Phalkun (NCHADS), and Dr. Suos Premprey (AusAID). We would also like to thank the GF and AusAID for the financial support through NCHADS and KHANA, respectively.
Funding
The study was supported by the Global Fund through the National Center for HIV/AIDS, Dermatology and STIs (NCHADS) and AusAID through KHANA.
Availability of data and materials
The dataset supporting the conclusions of the article is available upon request from the corresponding author. Due to data protection restrictions and participant confidentiality, we cannot make participant data publicly available.
Authors’contributions
HS, CC and ST conceived and designed the study. JM contributed the conceptual ideas and drafted the paper and proofreading. HS wrote the first draft of the paper, and the other coauthors contributed to the final manuscript. HS and CC were responsible for conducting the study and managing the data. HS and CC conducted the statistical analyses and the interpretation of data. All authors read and approved the final manuscript.
Ethics approval and consent to participate
anonymity of the participants were ensured at all stages of data collection. Each participant’s involvement in the study was voluntary. The participants were informed that if they wished to withdraw their participation, they could do so at any time without any restriction.
Consent for publication Not applicable.
Competing interests
We declare that we have no competing interests.
Publisher’s Note
Springer Nature remains neutral with regard to jurisdictional claims in published maps and institutional affiliations.
Author details
1School of Public Health at the National Institute of Public Health, Lot #80,
Samdech Penn Nouth Blvd. Tuol Kork District, Phnom Penh, Cambodia.
2Center for Population and Health Research, KHANA, Phnom Penh,
Cambodia.3Department of Epidemiology, University of Washington, Seattle, USA.
Received: 23 February 2017 Accepted: 31 October 2018
References
1. Chhea C, Saphonn V. Report on Estimation and Projections on HIV/AIDS in Cambodia 2010–2015. National Center for HIV/AIDS, Dermatology and STD: Phnom Penh; 2011.
2. Chhea C: HIV Sentinel Surveys 2010: Female Entertainment Workers (FEWs) and Antenatal Care Cinic (ANC) Attendees; Accessd on Febraury 20, 2016 athttp:// www.nchads.org/Publication/HSS/HSS_2010%20Report.pdf. In. Phnom Penh: National Center for HIV/AIDS, Dermatology and STIs (NCHADS); 2012. 3. Couture MC, Page K, Stein ES, Sansothy N, Sichan K, Kaldor J, Evans JL, Maher L,
Palefsky J. Cervical human papillomavirus infection among young women engaged in sex work in Phnom Penh, Cambodia: prevalence, genotypes, risk factors and association with HIV infection. BMC Infect Dis. 2012;12:166. 4. NCHADS: National HIV Sero-Surveillance among ANC and MSM 2014, acceed
date on October 02, 2017 athttp://www.nchads.org/index.php?id=16. In. Phnom Penh: National Center for HIVAIDS, Dermatology and STIs 2014. 5. NACD: Official report (in Khmer) of the National Achievement of drug
control in 2015 and Workplan 2016, National Authority for combating drug (NACD). Accessed on on December 2016 athttp://www.nacd.gov.kh/ images/nacd/Reports/annual/report_2015.pdf. In. Phnom Penh: NACD; 2016. 6. Klein A, Saphonn V, Reid S. Reaching out and reaching up - developing a
low cost drug treatment system in Cambodia. Harm Reduct J. 2012;9:11. 7. MoEYS: Most at risk young people survey 2010. In. Phnom Penh: Ministry of
Education, Youth and Sports; 2010.
8. Maher L, Phlong P, Mooney-Somers J, Keo S, Stein E, Couture MC, Page K. Amphetamine-type stimulant use and HIV/STI risk behaviour among young female sex workers in Phnom Penh, Cambodia. Int J Drug Policy. 2011;22(3): 203–9.
9. Degenhardt L, Mathers B, Guarinieri M, Panda S, Phillips B, Strathdee SA, Tyndall M, Wiessing L, Wodak A, Howard J. Meth/amphetamine use and associated HIV: implications for global policy and public health. Int J Drug Policy. 2010;21(5):347–58.
10. Colfax G, Santos GM, Chu P, Vittinghoff E, Pluddemann A, Kumar S, Hart C. Amphetamine-group substances and HIV. Lancet. 2010;376(9739):458–74. 11. Singh D, Chawarski MC, Schottenfeld R, Vicknasingam B. Substance abuse
and the HIV situation in Malaysia. J Food Drug Anal. 2013;21(4):S46–51. 12. Chhea C, Sopheab H, Tuot S. National Population Size Estimation, HIV
Related Risk Behaviors and HIV Prevalence among People Who Use Drugs in Cambodia in 2012. Phnom Penh: NACD, NCHADS, KHANA; 2014. 13. HIV and AIDS data hub for Asia-Pacific: Estimated size and HIV prevalence
among people who inject drugs in Asia-Pacific; accessed on Jan 27, 2016 at http://www.aidsdatahub.org/people-who-inject-drugs-november-2015-slides 14. Li L, Assanangkornchai S, Duo L, McNeil E, Li J. Risk behaviors, prevalence of HIV and hepatitis C virus infection and population size of current injection drug users in a China-Myanmar border city: results from a respondent-driven sampling survey in 2012. PLoS One. 2014;9(9):e106899.
15. Mathers BM, Degenhardt L, Ali H, Wiessing L, Hickman M, Mattick RP, Myers B, Ambekar A, Strathdee SA. HIV prevention, treatment, and care services for people who inject drugs: a systematic review of global, regional, and national coverage. Lancet. 2010;375(9719):1014–28.
16. Strathdee SA, Stockman JK. Epidemiology of HIV among injecting and non-injecting drug users: current trends and implications for interventions. Curr HIV/AIDS Rep. 2010;7(2):99–106.
17. Taran YS, Johnston LG, Pohorila NB, Saliuk TO. Correlates of HIV risk among injecting drug users in sixteen Ukrainian cities. AIDS Behav. 2011;15(1):65– 74.
18. Medhi GK, Mahanta J, Paranjape RS, Adhikary R, Laskar N, Ngully P. Factors associated with HIV among female sex workers in a high HIV prevalent state of India. AIDS Care. 2012;24(3):369–76.
19. Chheng K, Leang S, Thomson N, Moore T, Crofts N. Harm reduction in Cambodia: a disconnect between policy and practice. Harm Reduct J. 2012; 9(1):30.
20. Thomson N, Leang S, Chheng K, Weissman A, Shaw G, Crofts N. The village/ commune safety policy and HIV prevention efforts among key affected populations in Cambodia: finding a balance. Harm Reduct J. 2012;9:31. 21. Heckathorn D. Respondent-driven sampling: a new approach to the study
of hidden populations. Social Problem. 1997.
22. Chhea C, Seguy N: HIV prevalence among drug users in Cambodia 2007; accessed on Febraury 20, 2016 atwww.nchads.org. In. Phnom Penh: NCHADS, NACD; 2010.
23. Volz E, Wejnert C, Degani I, Heckathorn DD. Respondent-driven sampling analysis tool (RDSAT) version 7.1. Ithaca, NY: Cornell University; 2007. p. 2012.
24. Matthew S, Heckathorn D. Sampling and estimation in hidden populations using respondent-driven sampling. Sociol Methodol. 2004.
25. Hosmer D, Lemeshow S. Applied logistic regression. 2nd ed. New York: John Wiley & Sons Inc; 2000.
26. Mathers BM, Degenhardt L, Phillips B, Wiessing L, Hickman M, Strathdee SA, Wodak A, Panda S, Tyndall M, Toufik A, et al. Global epidemiology of injecting drug use and HIV among people who inject drugs: a systematic review. Lancet. 2008;372(9651):1733–45.
27. Des Jarlais DC, Arasteh K, Perlis T, Hagan H, Abdul-Quader A, Heckathorn DD, McKnight C, Bramson H, Nemeth C, Torian LV, et al. Convergence of HIV seroprevalence among injecting and non-injecting drug users in new York City. AIDS. 2007;21(2):231–5.
28. Strathdee SA, Hallett TB, Bobrova N, Rhodes T, Booth R, Abdool R, Hankins CA. HIV and risk environment for injecting drug users: the past, present, and future. Lancet. 2010;376(9737):268–84.
29. Degenhardt L, Mathers B, Vickerman P, Rhodes T, Latkin C, Hickman M. Prevention of HIV infection for people who inject drugs: why individual, structural, and combination approaches are needed. Lancet. 2010;376(9737): 285–301.
30. Azim T, Bontell I, Strathdee SA. Women, drugs and HIV. Int J Drug Policy. 2015;26(Suppl 1):S16–21.
31. Sopheab H, Tuot S. End Project Evaluation: Changes in HIV Integrated, Prevention, Care and Impact Mitigation Efforts from 2009–2001. KHANA: Phnom Penh, Cambodia; 2012.
32. Page K, Stein ES, Carrico AW, Evans JL, Sokunny M, Nil E, Ngak S, Sophal C, McCulloch C, Maher L. Protocol of a cluster randomised stepped-wedge trial of behavioural interventions targeting amphetamine-type stimulant use and sexual risk among female entertainment and sex workers in Cambodia. BMJ Open. 2016;6(5):e010854.
33. Carrico AW, Nil E, Sophal C, Stein E, Sokunny M, Yuthea N, Evans JL, Ngak S, Maher L, Page K. Behavioral interventions for Cambodian female entertainment and sex workers who use amphetamine-type stimulants. J Behav Med. 2016;39(3):502–10.
34. Bouscaillou J, Evanno J, Proute M, Inwoley A, Kabran M, N'Guessan T, Dje-Bi S, Sidibe S, Thiam-Niangoin M, N'Guessan BR, et al. Prevalence and risk factors associated with HIV and tuberculosis in people who use drugs in Abidjan, Ivory Coast. Int J Drug Policy. 2016;30:116–23.
35. Liu H, Grusky O, Li X, Ma E. Drug users: a potentially important bridge population in the transmission of sexually transmitted diseases, including AIDS, in China. Sexually transmitted diseases. 2006;33(2):111–7.
37. Tross S, Campbell AN, Cohen LR, Calsyn D, Pavlicova M, Miele GM, Hu MC, Haynes L, Nugent N, Gan W, et al. Effectiveness of HIV/STD sexual risk reduction groups for women in substance abuse treatment programs: results of NIDA clinical trials network trial. J Acquir Immune Defic Syndr. 2008;48(5):581–9.