J. Cherwinka,1 D. Grant,2 F. Halzen,3 K.M. Heeger,4 L. Hsu,5 A.J.F. Hubbard,3, 4 A. Karle,3 M. Kauer,3, 4 V.A. Kudryavtsev,6 C. Macdonald,6 R.H. Maruyama,4,∗ S. Paling,7 W. Pettus,3, 4 Z.P. Pierpoint,3, 4 B.N. Reilly,3, 4,† M. Robinson,6 P. Sandstrom,3 N.J.C. Spooner,6S. Telfer,6 and L. Yang8
(The DM–Ice Collaboration) 1
Physical Sciences Laboratory, University of Wisconsin-Madison, Stoughton, WI 53589, USA 2Department of Physics, University of Alberta, Edmonton, Alberta, Canada
3Department of Physics and Wisconsin IceCube Particle Astrophysics Center, University of Wisconsin-Madison, Madison, WI 53706, USA
4
Department of Physics, Yale University, New Haven, CT 06520, USA 5Fermi National Accelerator Laboratory, Batavia, IL 60510, USA 6
Department of Physics and Astronomy, University of Sheffield, Sheffield, UK 7
STFC Boulby Underground Science Facility, Boulby Mine, Cleveland, UK
8Department of Physics, University of Illinois at Urbana-Champaign, Urbana, IL 61801, USA
(Dated: 10 November 2014)
We report the first analysis of background data from DM-Ice17, a direct-detection dark matter experiment consisting of 17 kg of NaI(Tl) target material. It was codeployed with IceCube 2457 m deep in the South Pole glacial ice in December 2010 and is the first such detector operating in the Southern Hemisphere. The background rate in the 6.5 – 8.0 keVee region is measured to be
7.9±0.4 counts/day/keV/kg. This is consistent with the expected background from the detector assemblies with negligible contributions from the surrounding ice. The successful deployment and operation of DM-Ice17 establishes the South Pole ice as a viable location for future underground, low-background experiments in the Southern Hemisphere. The detector assembly and deployment are described here, as well as the analysis of the DM-Ice17 backgrounds based on data from the first two years of operation after commissioning, July 2011 – June 2013.
PACS numbers: 95.35.+d, 29.40.Mc, 95.55.Vj
Keywords: dark matter, DM-Ice, sodium iodide, direct detection, annual modulation, South Pole
I. INTRODUCTION
Astrophysical and cosmological observations suggest that roughly 27% of the Universe is cold dark matter [1]. Although evidence for dark matter has been firmly estab-lished [2, 3], its composition and characteristics remain largely unknown. Weakly interacting massive particles (WIMPs) are theoretically favored because they can be produced in the early universe with the correct abun-dance to result in the observed relic density [4]. A suite of direct detection experiments is now underway [5] to search for WIMPs through observation of WIMP-nucleon scattering [6,7].
We report on the performance of DM-Ice17, a NaI(Tl) direct dark matter detector deployed at the South Pole in December 2010. DM-Ice17 is designed to demonstrate the feasibility of operating a remote low-background NaI experiment to directly test the annual modulation of the WIMP-nucleon scattering rate observed by DAMA. The expected annual modulation arises from the motion of Earth around the Sun while the Solar System moves through the dark matter halo of our Galaxy [8,9]. The DAMA/NaI [10] and DAMA/LIBRA [11] experiments,
∗Corresponding author: [email protected]
†Present address: Physics Department, University of
Wisconsin-Fox Valley, Menasha, WI, USA
running at the Laboratori Nazionali del Gran Sasso for a combined 14-year period, have measured a consis-tent annual modulation at 9.3σ, which they attribute to dark matter. More recently the CoGeNT [12, 13], CRESST [14], and CDMS-II(Si) [15] experiments have observed events in excess of the known backgrounds in their respective detectors. Under the assumption of elas-tic scattering of WIMPs, these results are inconsistent with exclusion limits set by several direct detection ex-periments for both spin-independent [16–20] and spin-dependent scattering [20–24]. New dark matter can-didates [25–28], instrumentation effects [29, 30], back-grounds [31–33] and modifications on the distributions of the local dark matter halo [34,35] have all been proposed in an attempt to reconcile these seemingly contradictory results with limited success.
A large radio-pure array of NaI(Tl) crystals placed deep in the Antarctic ice near the South Pole will have the ability to directly test DAMA’s claim [36]. The expected dark matter modulation has a constant phase everywhere on Earth, whereas any modulation resulting from sea-sonal effects reverses its phase between the Northern and Southern Hemispheres. The South Pole ice offers up to 2800 m of overburden, is extremely radio-pure, and strongly suppresses the effects of environmental and sea-sonal variations such as temperature, humidity, and pres-sure. Furthermore, the Amundson-Scott South Pole Sta-tion and IceCube Neutrino Detector provide technical
infrastructure and muon coincidence capabilities [37].
II. EXPERIMENTAL SETUP
A. Detector
DM-Ice17 consists of two 8.47 kg NaI(Tl) scintillating crystals; each crystal is optically coupled to two pho-tomultiplier tubes (PMTs) through quartz light guides (see Fig.1). Each detector assembly (denoted Det-1 and Det-2), along with its data acquisition and control elec-tronics (see Sec.II B), is housed in its own stainless steel pressure vessel and encased in the South Pole ice at a depth of 2457 m (see Sec.II C). The NaI(Tl) crystals, light guides, and photomultiplier tubes are those used by the former NaIAD experiment that ran from 2000 – 2003 at the Boulby Underground Laboratory [38, 39]. They were stored in sealed copper boxes at the Boulby Un-derground Laboratory from 2003 – 2010, when they were retrieved to be used in DM-Ice17.
The two NaI(Tl) crystals, denoted DM80 (Det-1) and DM81 (Det-2) in NaIAD publications, were pro-duced by Bicron and encapsulated by Saint-Gobain. Previously measured background rates at 6 – 7 keVee of 7 – 10 counts/day/keV/kg [38, 39] are consistent with those observed in DM-Ice17 and reported in this paper (see Sec.V). These crystals provide well characterized detectors for this experiment; however, the high back-ground rates limit the sensitivity of DM-Ice17.
Each cylindrical crystal measures 14.0 cm in diame-ter and 15.0 cm in length. For diffusive light
reflec-FIG. 1. Engineering drawing (left) and photographs of one of the DM-Ice17 detectors with (right) and without (center) the stainless steel pressure vessel. The wider upper section of the stainless steel vessel contains the digitizing and con-trol electronics, high voltage generation board, and isolation transformer for each PMT. The lower section houses one crys-tal (light brown in left fig) coupled to two PMTs (light blue) via quartz light guides (pink). Power and communication to the detector is provided through a “special devices” breakout from the main IceCube communication cable. The connection to the detector is made through a single leak-tight penetrator at the top of the pressure vessel.
tion, the crystals are wrapped in thin sheets of polyte-trafluoroethylene (PTFE). They are encapsulated with an oxygen-free high thermal conductivity (OFHC) cop-per housing and a thin quartz window on either end to protect the hygroscopic crystal. The encapsulation has an outer diameter of 14.6 cm and length of 16.5 cm.
The scintillation light is recorded by 5-inch 9390-UKB PMTs with C636-KFP voltage divider bases (Electron Tubes Limited). The crystals are shielded from the ra-dioactivity in the PMTs with 5.0 cm thick quartz light guides. A 3 mm layer of Q900 silicone gel (Quantum Silicones) coated in EJ-550 optical grease (Eljen Tech-nology) provides optical coupling between the interfaces of the PMTs, light guides, and NaI(Tl) crystals. The gel also helped suppress mechanical shock between compo-nents during shipping and deployment. Q900, used in IceCube to couple the PMTs to the pressure housings, has been demonstrated to be robust, clean, and stable for long-term operation at the South Pole.
PTFE tubes (Applied Plastics Technology) around the crystal, light guides, and PMTs serve to reflect light and provide mechanical support against lateral movements. A PTFE disk around the base of each PMT maintains the alignment while Buna-N O-rings on the PTFE tubes and disks hold the detector centered in the pressure ves-sel. The optical components are both compressed to-gether and protected from mechanical shocks by a series of springs supported by six threaded OFHC copper rods. The detector assembly is suspended from an OFHC copper plate (orange in Fig.1 left) which in turn hangs from a stainless steel midplate (gray in Fig.1left). Holes for the wires were drilled at 45◦ through the steel mid-plate to avoid direct line of sight to the optical com-ponents. The lower pressure vessel volume was flushed with dry nitrogen and the holes were potted with silicone-based epoxy; this sealed off the sensitive detector from the upper pressure vessel volume housing the electronics boards (see Sec.II B). A stainless steel cylinder (dark blue in Fig.1) supports the electronics boards and adds me-chanical strength to the top surface of the pressure vessel by transferring some of the load onto the midplate.
Each detector is housed in a stainless steel pressure ves-sel designed to withstand 10000 psi of external pressure. Pressure spikes exceeding 7000 psi have been observed by IceCube as the drill water column freezes (see Sec.II C). SANMAC SAF 2205 stainless steel tube stock (Sand-vik) was used for the main body of the pressure ves-sel. The vendor was chosen as it is known to produce clean stainless steel, and the alloy was chosen for its me-chanical properties (yield strength 0.2% = 450 MPa, ten-sile strength = 680 MPa). The seals were modeled after those used in IceCube’s drill head and were hydrostati-cally tested to 7000 psi at the University of Wisconsin – Madison Physical Sciences Laboratory (PSL).
[image:2.612.76.292.441.582.2]pos-4Mb 4Mb
Flash Flash
16Mb 16Mb
SDRAM SDRAM
LPF DAC
ADC
10b
8b
16b 32b
1 megabaud
DC-DC
8Mbit
Configuration Device
±5V,3.3V
2.5V,1.8V
FPGA
CPU DP Ram
CPLD
PMT Power Monitor
& Control LC
20 MHz Low Noise
Oscillator DACs & ADCs
8b,10b,12b
20 MHz
40 MHz
MUX
OB-LED
ATWD
ATWD
×16
× 2
×0.25
×2.6 ×9
10b 10b
10b
FADC Trigger
Delay
Pulser
(to other
board)
(to surface) Isolation
Transformer
PMT HV PMT
Signal
In-Ice Electronics Boards (x2/
detector):
Data transfervia satellite to Madison,WI,USA for storage and processing GPS
Timestamps
Data
Digitized Signals
Timestamps
Cabl
e
t
o
sur
f
ace
[image:3.612.72.549.56.392.2](
~3
km)
FIG. 2. Block diagram of one DM-Ice17 detector and data transfer. The scintillation light is collected with two PMTs and read out by the two IceCube mainboards (DOM-MBs, described in Ref. [40]) located in the top portion of the pressure vessel. The waveforms are digitized, given a timestamp, and sent to a hub in the ICL through a twisted pair of copper wires. Data are sent via TDRSS satellite to the data warehouse located at the University of Wisconsin–Madison. The DOM-MB is also responsible for controlling the trigger threshold and PMT HV, as well as monitoring relevant PMT and environmental parameters.
sible to screen materials prior to assembly due to the se-vere time constraints imposed by IceCube’s deployment schedule; therefore, detector components and materials were selected from vendors known to produce radio-clean products. All machined components (e.g. pressure ves-sel, copper rods, screws) were cleaned using ultrahigh vacuum (UHV) cleaning techniques; the optical compo-nents were cleaned with methanol and deionized water. The assembly of detector components was performed in the semiclean room at PSL that was used for assembling IceCube modules.
B. Electronics and DAQ
Each PMT is independently controlled and moni-tored by its own IceCube digital optical module main-board (DOM-MB) assembly and high voltage (HV) board [40] located in the top portion of the pressure ves-sel (see Fig.2). The DOM-MBs are controlled remotely through a hub located in the IceCube Laboratory (ICL)
on the surface of the ice. The hubs are remotely acces-sible via TCP/IP when there is a satellite connection to the South Pole Station or by the on-site personnel at any time.
The signal from each PMT is carried on an RG303 ca-ble to the respective DOM-MB. The signal caca-bles have the same length to match their signal transit times. The DOM-MBs contain a field programmable gate array (FPGA) that is configured with a simplified version of IceCube’s data acquisition (DAQ) software [40]. Analog PMT signals passing the trigger conditions are digitized
in situby the DOM-MBs before begin transmitted to the
hub. The hub clock is synchronized to the GPS receiver at the ICL and translates the DOM-MB timestamp into universal time, correcting for the cable lengths of 2500 and 2995 m for Det-1 and Det-2, respectively.
and 10-bit dynamic range. The three analog transient waveform digitizer (ATWD) channels each collect up to 128 samples at a programmable sampling rate of 100 – 500 MHz. Each ATWD channel has a 10-bit dynamic range but different gain: “ATWD0” at×16, “ATWD1” at ×2, and “ATWD2” at ×0.25. Together the ATWD channels offer an effective dynamic range of 14 bits, al-lowing waveforms to be recorded without saturation from single photoelectrons (sub-keV) up to >20 MeV.
Although programmable, the run settings were held constant for all physics data presented here. The PMT HV settings were{1000, 1000, 1100, 950}V for{PMT-1a, PMT-1b, PMT-2a, PMT-2b}. PMT-1a and PMT-1b are the upper and lower PMTs coupled to Det-1 respectively (likewise for PMT-2a and PMT-2b in Det-2). The trigger threshold of each PMT was set to∼0.25 photoelectrons. A coincidence window of ∼400 ns was imposed before recording the waveforms of the two PMTs coupled to the same crystal. The sampling rate of the DM-Ice17 ATWD chips was set at∼210 MHz for a digitized waveform time window of ∼600 ns. A ∼0.7 ms deadtime is introduced during waveform digitization.
The DAQ records hardware monitoring information including temperature and pressure (measured at the DOM-MB) as well as PMT high voltage and trigger rate. Monitoring information, collected regularly during data taking, was recorded every 2 sec from January 2011 to February 2012 and every 60 sec since then. The moni-tored parameters are discussed in Sec.IIIand the associ-ated noise is discussed in Sec.VI.
C. Location
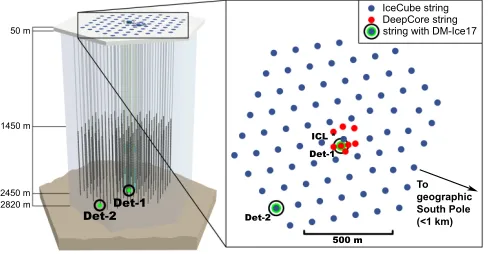
DM-Ice17 is operating in Antarctica roughly 1 km from the geographic South Pole (see Fig.3). It was codeployed with the final seven strings of IceCube [37] during the construction season of the 2010/2011 austral summer. The two DM-Ice17 detectors were lowered into separate, water-filled holes, each 2457 m deep and 60 cm in diam-eter, and permanently frozen into place. These holes, drilled by Ice Cube’s enhanced hot water drill, are sep-arated by 545 m. The ice provides 2200 meters water equivalent of overburden.
Both detectors are deployed on IceCube strings, 7 m below the lowest digital optical module (DOM). The Ice-Cube array consists of 1 km3 of glacial ice instrumented with 5160 DOMs distributed across 86 strings, with 324 additional DOMs on the surface of the ice as IceTop. One of the DM-Ice17 detectors, Det-1, is located near the center of the IceCube array at the bottom of Deep-Core [42] on String-79 [43]. Det-2 is at the edge of the IceCube array on String-07. Though operating indepen-dently from IceCube, DM-Ice17 uses the same DAQ soft-ware and GPS time stamps, providing opportunities to study coincident events with IceCube. The power and communication to the DM-Ice17 detectors are established through twisted pairs of copper wires connected to
Ice-Det-2Det-1
To geographic South Pole (<1 km)
500 m Det-2
Det-1 ICL *
string with DM-Ice17 DeepCore string IceCube string
2820 m
2450 m
1450 m
[image:4.612.319.563.58.185.2]50 m
FIG. 3. The locations of the DM-Ice17 detectors within the IceCube array, with Det-1 near the array center and Det-2 at the periphery. Both detectors are at a depth of 2457 m and are horizontally separated by 545 m. In the array top-view, blue points are IceCube strings, and red points are DeepCore strings.
Cube’s main signal cables. They are controlled via hubs in the ICL located on the surface of the ice.
The South Pole ice is 90,000 – 100,000 years old at depths of 2400 – 2500 m [44]. This highly pure glacial ice contains ∼10 ppb of dust, mostly consisting of vol-canic ash; the total contamination level from these im-purities is∼10−5ppb for238U and232Th and∼10−2ppb for natK [45]. Optical scattering measurements made by IceCube precisely quantify the dust concentrations throughout their detector array, allowing the correlation of South Pole ice with Antarctic ice cores. The238U con-centration was validated by the Vostok ice cores using inductively coupled plasma sector field mass spectrome-try (ICP-SFMS) [46].
The bedrock’s contribution to the background of the detectors is negligible as they are shielded by over 300 m of ice. The environmental radon is also expected to be a negligible component of the total background as the de-tectors are completely encased in ice. The contamination levels of the water that fills the drilled holes were mea-sured with HPGe counting. Its simulated contribution to the region of interest for dark matter searches was found to be negligible (see Sec.V A).
III. DETECTOR DEPLOYMENT AND
PERFORMANCE
A. Deployment
the higher cosmic ray rates.
The sealed pressure vessels were strapped down ver-tically in custom-designed wooden shipping crates. A Shock Timer Plus 3D sensor (Instrumented Sensor Tech-nology) was mounted inside each crate to monitor tem-perature, humidity, and mechanical shock during ship-ment. The large mass of the pressure vessel and addi-tional layers of insulation mitigated thermal shock while the suspension system within the pressure vessel damp-ened mechanical shock to the crystals (see Sec.II A). Bare NaI(Tl) crystals can handle surface temperature gradi-ents of >50◦C [47], but encapsulated detectors are rated to only 8◦C/hr due to different coefficients of thermal ex-pansion of the crystals and encapsulation materials.
From Wisconsin to New Zealand, the temperature var-ied between 4 and 24◦C with a rate of change less than 3◦C/hr. Upon arrival at McMurdo Station, the tem-perature dropped from 25◦C to -7◦C over 15 hrs. At the South Pole, the temperature dropped 20◦C in its first 7 hrs before stabilizing at the surface temperature of roughly -25◦C.
Calculations of the thermal conduction of the pressure vessel were made prior to deployment to verify that safe thermal gradients would be experienced at all times, es-pecially during the rapid temperature equilibration upon detector entry into the 0◦C water at deployment. The temperature shock was minimized by allowing the detec-tors to thermalize to 10◦C in the deployment tower prior to being lowered rapidly (<30 min) through the -50◦C air column in the top∼50 m of the hole.
Thermal variations measured during shipment and storage were <6◦C/hr prior to detector deployment. The largest mechanical shocks recorded were <10g for both Det-1 and Det-2 and were primarily during com-mercial shipment to New Zealand. No damage to the detectors or loss of light collection efficiency can be dis-cerned from the performance of the detectors.
B. Freeze-in and temperature stability
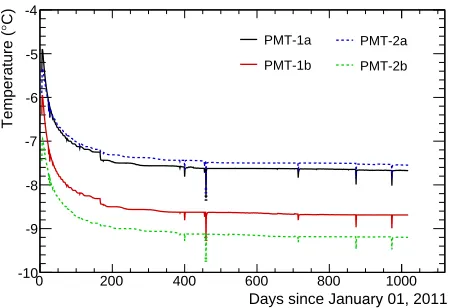
The temperatures of the DOM-MBs are read out as part of the regular monitoring routine (see Fig.4). The recorded temperatures are∼10◦C warmer than the sur-rounding -18◦C ice due to the∼3.5 W dissipated by the electronics [40]. The two DOM-MBs in the same pres-sure vessel are stacked on top of each other and rotated by 60◦ with respect to one another. The temperature
sensor on the top DOM-MB sees a 2 – 3◦C higher tem-perature than its partner from the dissipated heat of the DC-DC converter located directly below it on the lower DOM-MB.
As the ice froze and the detectors thermalized, the tem-perature decrease exhibited a fast and a slow exponen-tial time component. The fast freeze-in time constant (∼10 days) is due to the water in the drilled hole freezing around the detector. The slow component of thermaliza-tion (∼100 days) is thought to be due to the
thermaliza-Days since January 01, 2011
0 200 400 600 800 1000
Temperature (
°
C)
-10 -9 -8 -7 -6 -5 -4
PMT-1a
PMT-1b
PMT-2a
[image:5.612.322.547.62.216.2]PMT-2b
FIG. 4. Temperature recorded by DM-Ice17 mainboards since January 01, 2011, sampled every 2 sec through February 2012 and every 60 sec after (see Sec.II B). Two time constants are observed: a relative fast component (∼10 days) that relates to the freeze-in process and a slower time constant (∼100 days) as the heat accumulated in the ice surrounding the hole dur-ing drilldur-ing is dissipated. Discontinuities observed correspond to the PMT high voltage settings change (day ∼160) and subsequent power outages (negative spikes).
tion of the heat deposited in the nearby ice during the hot-water drilling process. The small drop on day∼160 corresponds to the change in the power dissipation in the mainboard when the PMT high voltage was lowered to the final run settings. The occasional dips in tempera-ture correspond to power outages in either the ICL or the hub affecting the mainboards for more than an hour. During the two-year physics data run, the temperature of the DM-Ice17 MBs has been stable with a gradual cool-ing of∼0.25◦C and an average daily RMS of∼0.02◦C. The thermal mass of surrounding ice provides DM-Ice17 with smaller temperature fluctuations than achieved by similar experiments [48]. No temperature modulation is observed within the measurement error. The crystal tem-perature is expected to be more stable than these DOM-MB measurements due to its larger thermal mass and increased distance from the electronics. The tempera-ture dependence of the detector response is the subject of future studies and is not addressed here.
C. Hardware stability
Regularly recorded PMT high voltages are stable to within fractions of a volt (0.4 – 0.8 VRM S) with the excep-tion of 2b. Despite a constant HV set point, PMT-2b shows random variation in monitored HV around the set point (∼30 Vpp). No correlations are observed be-tween this HV oscillation and either PMT gain or single photoelectron (SPE) rate. The monitored HV is stable to within 0.1 mV (1 in 104) over the two-year period.
5 10 15 20 25 30
gain
0.95 1
1.05 46.5 keV peak
Months after January 2011
5 10 15 20 25 30
Relative
0.95 1
1.05 609 keV peak PMT-1a PMT-2a
[image:6.612.57.299.56.219.2]PMT-1b PMT-2b
FIG. 5. Relative uncalibrated peak position of the 46.5 keV
210
Pb (top) and 609 keV214Bi (bottom) gamma peaks demon-strating DM-Ice17 gain stability. The 46.5 keV peak has ap-proximately constant light collection, while the 609 keV peak has a <2% decrease over two years.
the light collection efficiency at the prominent 609 keV and 46.5 keV peaks in the uncalibrated energy spectrum (see Fig.5). The 609 keV peak from214Bi exhibits a small (<2%) decrease in light collection over two years. The 46.5 keV peak from 210Pb exhibits no significant trend with <2% fluctuations. PMT-2b deviates from the trend of the other PMTs at both peaks, showing relative in-creased gain of a few percent. No time-dependent cali-bration is applied to the presented data because the gain fluctuations are less than the energy resolution of the detectors; shorter datasets are used for the energy res-olution analysis (see Sec.IV C) to limit systematic error of gain drift. No variation is observed in the peak areas within the measurement errors.
The total coincident event rate for each detector is ∼2.5 Hz and shows a gradual decrease with time (0.027 Hz/yr for Det-1 and 0.013 Hz/yr for Det-2). No variation with time is observed in the PMT trigger thresholds extracted from dark noise (non-coincident) data runs.
D. Detector livetime
In the two-year dataset presented here, DM-Ice17 took data nearly continuously, with a total livetime of 98.94% (Det-1) and 98.92% (Det-2). The downtime is primarily from 10 extended (>1 hour) interruptions due to power outages, test runs, and DAQ errors. Normal uninter-rupted data sets achieve a∼99.75% livetime, with small downtime introduced as the DAQ transitions between runs. A ∼0.7 ms deadtime after each event (∼2.5 Hz event rate) introduces an additional∼0.18% downtime.
IV. DETECTOR RESPONSE
A. Data processing and calibration
Events passing the trigger threshold and coincidence window requirements are digitizedin situ by the DOM-MB (see Sec.II B). The digitized waveforms are then sent to the hub in the ICL and compiled into one-hour runs. The data are transmitted via satellite to the University of Wisconsin–Madison for processing.
Offline data processing consists of waveform correc-tions and energy calibration. The waveform is first base-line adjusted and then corrected for the frequency re-sponse of the passive electronic components.
The energy calibration begins by integrating the entire corrected waveform (∼600 ns for ATWD). The resulting spectrum for each PMT is calibrated into keVee using
) ee Energy (keV
0 10 20 30 40 50 60 70 80 90 100
counts / day / keV / kg
0 5 10 15 20 25 30
Det-1 Det-2
40K
210Pb
210Pb
125I
) ee Energy (keV
500 1000 1500 2000 2500
counts / day / keV / kg
-1
10 1 10
Det-1 Det-2
208Tl + 214Bi
60Co 40K
214Bi
214Bi 208Tl
214Pb 212Pb+214Pb
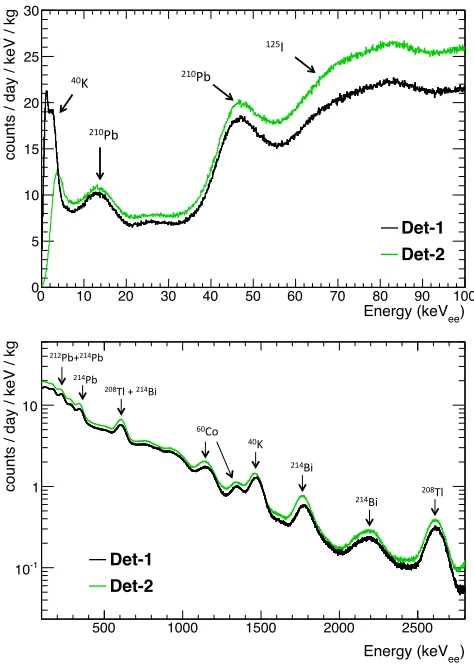
[image:6.612.319.556.281.613.2]known lines from40K,60Co,125I,232Th-chain, and238 U-chain. The final energy spectra (see Fig.6) are produced by combining the light collected in both PMTs on a sin-gle crystal for each event. The energies are reported in electron-equivalent keV ( keVee), unless otherwise stated. The four digitization channels are optimized for dif-ferent energy ranges based on their gain and saturation energy. ATWD0 is useful for 0 – 1000 keV, ATWD1 for 100 – 5000 keV, and ATWD2 >1000 keV. The longer FADC digitization window carries important timing in-formation (see Sec.V C), but the FADC energy spectrum is not used in present analyses.
The nonlinear light response of NaI requires that two different energy calibrations be applied for above and be-low 100 keV (see Fig.6). An extrapolation of the high-energy linear calibration results in a negative intercept, consistent with behavior observed in literature [49,50].
B. Cosmogenic isotopes
Cosmogenically activated isotopes are produced in the detector components prior to deployment and provide a robust verification of the energy calibration. The activa-tion rates were simulated in ACTIVIA (NaI crystal) [51] or obtained from literature values (steel pressure ves-sel) [52]. The activation calculation incorporates the du-ration of the stages of construction, shipment, and de-ployment, as well as the rate scaling for each geographic location and elevation. The resulting isotopes were prop-agated through the detector using the DM-Ice17Geant4 simulation package (see Sec.V A). In DM-Ice17 data,125I from127I activated in the crystal and54Mn from56Fe in the pressure vessel provide the clearest cosmogenic sig-nals due to their energies and half-lives.
Cosmogenic 125I is observed (see Fig.7), exhibiting the expected peaks at 37.7 and 65.3 keV resulting from a combination of gammas and X-rays. Using one-month intervals of data, the measured half-life of this isotope is 59.4±2.7 days, consistent with the quoted 59.40±0.01 day half-life of 125I [53]. The 125I activity, extrapolated back to deployment, was determined to be 1150±120 decays/day/kg. Simulation using ACTIVIA estimated an activity of 410 decays/day/kg. This dis-crepancy is within the error of the ACTIVIA activation rate [51] and scaling factor calculations.
The gamma line from 54Mn at 836.1±3.0 keV is also observed (see Fig.7), consistent with the litera-ture value of 834.848±0.003 keV [53]. The measured half-life is consistent with the tabulated value of 312 days, although precise measurement has not been made due to low statistics. The 54Mn activity, extrapolated back to deployment assuming the literature half-life, was determined to be 51700±6500 decays/day (corrected for detection efficiency of decays in the pressure ves-sel found from Geant4 simulation). Simulation based on literature activation rates estimated an activity of 41850±4650 decays/day (error only from activation rate
) ee Energy (keV
10 20 30 40 50 60 70 80 90 100
counts / day / keV / kg
0 5 10 15 20
July 2011 June 2013 Residual
0 2 4 6 8 10
) ee Energy (keV
650 700 750 800 850 900 950 1000
counts / day / keV / kg
-1 0 1 2 3 4 5 6
July 2011 June 2013 Residual
[image:7.612.323.554.58.378.2]0 0.5 1 1.5
FIG. 7. Det-1 spectra from July 2011 (black, solid), June 2013 (blue, dashed), and residual (red, dot-dashed, on rescaled axis) showing evidence for cosmogenic activation. The top figure shows the decay of the 37.7 and 65.3 keV lines from cosmogenic125I in the crystal. The bottom figure shows the
decay of the 834.8 keV gamma line from cosmogenic54Mn in the pressure vessel.
measurement) from the pressure vessel, in good agree-ment given additional uncertainty in the scaling factors.
C. Energy resolution and light yield
The energy resolution of the DM-Ice17 detectors (see Fig.8) is measured by fitting a Gaussian plus linear background to the prominent peaks from internal con-tamination. The resolution measured in the DM-Ice17 detectors is comparable to that of similarly sized NaI detectors from ANAIS-25 [54], DAMA/LIBRA [55], and NaIAD [38], as well as to that of a small 2x1x1 cm3 NaI crystal [56]. The resolution of the 3 keV peak from 40K has large error due to the uncertainty in the cut efficiency (see Sec.VI). The∼14 keV peak from210Pb is broadened due to the many (>10) X-rays that make up that peak. The 2204 keV peak from214Bi is broadened by contribu-tions from208Tl decay.
re-) ee Energy (keV
10 102 103
/ E
σ
-1
10 1
) ee Energy (keV
10 102 103
/ E
σ
-1
10 1
DM-Ice17 Det-1 DM-Ice17 Det-2 NaI
3
[image:8.612.319.558.52.112.2]2x1x1 cm ANAIS DAMA NaIAD
FIG. 8. Energy resolution of Det-1 (black) and Det-2 (red) compared to ANAIS-25 (blue, dotted) [54], DAMA/LIBRA (magenta, dashed) [55], NaIAD detector DM77 (cyan, dot-dashed) [38], and a 2x1x1 cm3NaI detector (green, solid) [56].
The discontinuity in the DAMA resolution is due to switching ADC channels at∼80 keV. The internal contamination lines were fit with a Gaussian plus linear background, the quantity σ is the fitted standard deviation and the error bar is the fitted parameter error.
moving the two-PMT coincidence trigger requirement during regularly scheduled dark noise runs. The light yield is measured by comparing the peak location of the 65.3 keV calibration line from 125I to that of the SPE peak. The measured light yields are 5.9±0.1 pe/keV and 4.3±0.1 pe/keV for Det-1 and Det-2 respectively.
D. Pulse shape discrimination for alphas
Alpha events can be separated from gammas via pulse shape discrimination. Alphas produce shorter scintil-lation waveforms than gammas, leading to observable differences in the behavior in the tail of the recorded waveforms [55, 57]. A comparison of average alpha and gamma waveforms, as recorded in the ATWD1 channel, is shown in Fig.9. Longer time windows are available in the FADC channel; however, the pulses are saturated for MeV events and therefore are not used in this analysis.
A parameter referred to as the mean time (τ) quantifies the decay behavior of waveforms and is defined numeri-cally as
τ=
n0+99
P
n=n0
(n−n0) (ADCn)
n0+99
P
n=n0
ADCn
,
where ADCn refers to the charge collected in the nth time bin of the waveform and n0 is the time when the waveform first reached 50% of its maximum. To account for variations in the time between the start of scintilla-tion and the start of the recorded waveform, the mean
Time (ns)
0 100 200 300 400 500
Amplitude
0 0.005 0.01 0.015 0.02
[image:8.612.65.285.59.215.2]Average Gamma Average Alpha
FIG. 9. An average of 100 normalized gamma and alpha wave-forms as recorded in the ATWD1 channel of PMT-1a. Particle identification is possible through pulse-shape discrimination.
time calculation begins atn0 and samples 100 bins. The separation observed (see Fig.10) using the mean time pa-rameter is consistent with that reported by other NaI(Tl) experiments [55,58], although our shorter sampling win-dow reduces the calculated mean time.
Above 2000 keVee, gamma and alpha separation via the mean time nears 100%. These two bands can be accu-rately represented by Gaussian functions with nonover-lapping tails; in the 2500 – 3500 keVee region, less than one misidentified event is expected for the 24 months of data presented here.
) ee Energy (keV 1000 2000 3000 4000 5000 6000 7000 8000 9000
A
v
e
ra
g
e
M
e
a
n
T
im
e
(
n
s
)
0 20 40 60 80 100 120 140 160 180 200 220
FIG. 10. Waveform mean time values from Det-1 demonstrat-ing separation between electron recoils (blue,τ ≈180 ns) and alpha events (red,τ≈165 ns). The diagonal band at lowerτ (green) is composed of Bi-Po events (see Sec.V C).
V. BACKGROUND ANALYSIS
A. External backgrounds
[image:8.612.322.554.324.482.2]TABLE I. Contamination levels of DM-Ice17 detector components in mBq/kg. Quartz measurements are from ILIAS database for ‘Spectrosil B silica rod’ [59], and PMT levels are from the low-background ETL 9390B datasheet (with increased238U). Components that were measured specifically for this experiment at SNOLAB [41] are indicated by *. Components not shown in Fig.11are indicated by†.
Material 40K 232Th 238U 238U 235U 60Co
(234Th) (226Ra)
Quartz Light Guides 0.50±0.03 <4.9 12 ... ...
ETL 9390B PMT 9300 1000 2400 ... ...
Steel Pressure Vessel * 13.77±6.38 6.49±0.96 118.31±60.11 2.28±0.72 8.79±1.68 7.19±0.82
Drill Ice * 3.71±1.36 0.55±0.17 6.69±3.02 0.39±0.14 0.38±0.21 0.12±0.05
Silicone Optical Gel *† 39.50±18.60 <0.12 2.08±1.10 38.50±61.00 0.96±1.30 0.32±0.42 PTFE Supports *† 0.34±5.09 0.52±0.44 <0.41 24.46±21.37 1.92±0.72 <0.089
Copper Plate *† <5.13 <1.22 0.17±0.92 <0.67 3.56±1.79 <0.12
Glacial Ice† ∼3×10⁻⁴ ∼4×10⁻⁴ ∼10−4 ... ...
) ee Energy (keV
500 1000 1500 2000 2500 3000
counts / day / keV / kg
-2
10
-1
10 1 10
2
10
Det-1 Data Simulation Total NaI Light Guides
[image:9.612.61.290.269.427.2]PMTs Pressure Vessel Drill Ice
FIG. 11. The beta/gamma energy spectrum in keVee from
Det-1 (black) and comparison to simulation (red). The simulated contributions of significant detector components are shown separately. Simulated contaminant levels are de-rived from data-based estimates and radioassays (see TableI
and TableII).
During construction, excess stock from the stainless steel pressure vessel, PTFE supports, and copper plate, as well as the silicone gel used for optical coupling, were set aside to be measured at SNOLAB’s low-background counting facility [41]. Samples of the drill water were taken just prior to heating and recirculation. Eleven wa-ter samples were taken at varying depths on eight sep-arate holes. The contamination levels measured in the extracted drill water show no significant dependence on the depth or the order in which the holes were drilled; TableIshows the average measured contamination.
The contamination levels for the quartz light guides were taken from the ‘Spectrosil B silica rod’ values on the ILIAS database [59]. The contamination levels for the low-background ETL 9390 PMTs were provided in the vendor data sheet; the238U-chain level was increased by 95% to better match data. The contamination levels
of the NaI crystals were derived from spectral features in data validated by simulation (see Sec.V B). The PTFE light reflector and copper enclosing the crystal (Saint-Gobain encapsulation) were simulated with bulk con-tamination levels matching the newer materials (PTFE supports and OFHC copper plate measured at SNO-LAB); a surface contamination (0 – 10µm) in the copper of 40 mBq of 238U-chain was included to better match data (see Sec.VI). The glacial ice contamination is esti-mated using using dust impurity levels measured by Ice-Cube [44] scaled to appropriate contamination levels [45] (see Sec.II Cand [36]). The contributions from contami-nation in the PTFE supports, copper rods and plate, sil-icone optical gel, quartz light guides, drill ice, and glacial ice were simulated and found to be insignificant.
Detector and background modeling were performed using the 4.9.5 release of the Geant4 software pack-age [60,61]. The physics list utilizes the standard electro-magnetic interaction models with atomic relaxation [62] as demonstrated in the “rdecay02” example code.
B. Backgrounds from NaI crystals
The alpha lines between 4.0 and 7.5 MeV were used to measure the 238U and 232Th contaminations in the NaI(Tl) crystals. The events in these lines are expected to be dominated by those occurring in the bulk of the NaI(Tl) crystals. The spectrum from each PMT is com-pared to theGeant4-based simulation and contamina-tion levels are evaluated from the respective peak areas (see Fig.12). Both238U- and 232Th-chains appear to be broken, as described in TableII. The cause of the shoul-ders observed in the peaks of the alpha spectrum is under investigation.
Unquenched Energy (keV) 4000 4500 5000 5500 6000 6500 7000 7500 8000
counts / day / keV / kg
0 0.05 0.1 0.15
0.2 0.25 0.3 0.35 0.4 0.45
Det-1 Alphas
Simulation Alphas
Th 232
Pb 212 Ra-228
U 238
Th 230 U-234
Po 218 Ra-226
[image:10.612.321.556.53.114.2]Po 210
FIG. 12. The energy spectrum in the alpha region of 238U
and 232Th and chains in the NaI(Tl) crystal as measured with PMT-1b of Det-1 (black) and simulation (red). Com-parison to simulation yields contaminant level estimates of the238U- and232Th-chains in the crystal (see TableII). The energy scale shown takes into account the correction from the gamma-calibrated spectrum using the quenching factor (see text).
TABLE II. Contamination in the DM-Ice17 NaI crystals as determined by simulation comparison to data spectral fea-tures. The activity levels in the two detectors are consistent within the ∼30% error of these numbers. Both 238U- and 232
Th-chains were observed to be broken.
Isotope Subchain Activity
( mBq/kg)
40
K 17
129
I 1
232
Th
232
Th 0.01
228
Ra –208Tl 0.16
238
U –234Pa 0.017
238
U
234
U –230Th 0.14
226
Ra –214Po 0.90
210
Pb –210Po 1.5
For short-lived isotopes214Po (238U-chain) and 212Po (232Th-chain), activities are estimated by Bi-Po events from data (see Sec.V C). This analysis supports the con-tamination levels derived from the alpha spectrum.
The contamination levels of 40K and 129I were mea-sured by using their continuous beta spectra with end-points at 1311 keV and 154 keV, respectively, to match the simulation with the data.
C. Bi-Po events
For short-lived isotopes in a decay chain, it is pos-sible to observe parent and daughter decays in a sin-gle recorded waveform (see Fig.13). For the ∼600 ns
Time (ns)
0 100 200 300 400 500
Amplitude (ADC) 0
100 200 300
400 PMT-1a
[image:10.612.60.289.64.217.2]PMT-1b
FIG. 13. An example Bi-Po waveform recorded in the ATWD1 channels of PMT-1a (black) and PMT-1b (red). The first peak is the beta decay from212Bi, and the second larger
peak is from the alpha decay of212Po (t1/2= 299 ns).
sample window of DM-Ice17, this most commonly oc-curs for the232Th-chain decays212Bi→212Po→208Pb (212Po t
1/2= 299±2 ns [53]). A secondary contribu-tion to the double-event populacontribu-tion comes from the 238U-chain decays 214Bi → 214Po → 210Pb (214Po t1/2= 164.3±0.2µs [53]).
Because the high-energy alpha event is delayed, a larger portion of the waveform tail is truncated. This loss results in a correlated suppression of the calculated mean time and calibrated energy of these events (see Fig.10).
The time between the two energy depositions in the waveform yields a distribution dominated by the expo-nential component due to212Bi over the approximately flat continuum due to214Bi (see Fig.14). The exponen-tial component of the fit yields a half-life of 298.6±4.0 ns, consistent with212Po being the source of these events.
t (ns) ∆
0 1000 2000 3000 4000 5000
counts / day / kg
-2 10
-1 10
1 Data
212Bi (232Th-chain) 214Bi (238U-chain)
Summed Contributions
FIG. 14. The time between gamma and subsequent alpha decay of Bi-Po events in PMT-1a. Exponential fit component from 212Bi decay (green, dot-dashed), flat continuum from
214
Bi decay (blue, dotted), and composite fit (red, dashed) are overlain on data (black, solid).
[image:10.612.53.299.392.525.2] [image:10.612.324.555.425.582.2]TABLE III. Contamination levels of212Bi (232Th-chain) and 214
Bi (238U-chain) in the DM-Ice17 NaI crystals derived from Bi-Po data analysis and simulation. These values are consis-tent within the∼30% error of the simulation estimates.
Isotope Bi-Po Analysis (µBq/kg) Simulation
Det-1 Det-2 (µBq/kg)
212
Bi 176±6 173±6 160
214
Bi 930±12 955±12 900
VI. LOW ENERGY REGION
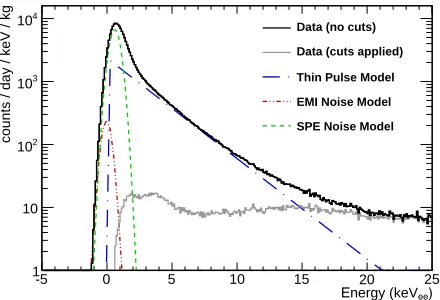
The energy spectrum below 25 keV is shown in Fig.15. The raw spectrum (shown in solid black line) below 20 keV is dominated by three noise components: electro-magnetic interference (EMI), thin pulses, and correlated single photoelectrons (SPE) between the two PMTs. The distinctive pulse shape of each event type is used to iden-tify the noise; the spectrum after cuts is shown in gray. Thin pulses are the dominant noise source in the region of interest (2 – 20 keV), while EMI and SPE noise domi-nate below 1 keV. The waveforms associated with signal and these sources of noise are shown in Fig.16.
20
-5 0 5 10 15 25
counts / day / keV / kg
1 10
2
10
3
10
4
10 Data (no cuts)
Data (cuts applied)
Thin Pulse Model
EMI Noise Model
SPE Noise Model
[image:11.612.53.300.105.164.2]Energy (keVee)
FIG. 15. The low energy spectrum of Det-1 before (black, solid) and after (gray, solid) analysis cuts. Models of the noise from thin pulses (blue, dot-dashed), electromagnetic in-terference (red, dot-dot-dashed), and correlated single photo-electrons (green, dashed) are shown.
EMI events occur when the mainboards are queried for their monitoring information (see Sec.II B). These events are characterized by their oscillatory waveforms (see Fig.16(d)), which can be distinguished from signal events by summing the square of the second derivative. This EMI cut parameter is
X
n
h
(ADCn+1−ADCn)−(ADCn−ADCn−1)
i2
,
where ADCn is thenth time bin in the recorded wave-form. Removal of EMI events is 99.98% efficient while
Time (ns)
0 100 200 300 400 500
Amplitude (ADC) 0
100 200 300
400 PMT-1a
PMT-1b
(a) High-energy scintillation
Time (ns)
0 100 200 300 400 500
Amplitude (ADC) 0 5 10
15 PMT-1a
PMT-1b
(b) Low-energy scintillation
Time (ns)
0 100 200 300 400 500
Amplitude (ADC) 0 20 40
60 PMT-1a
PMT-1b
(c) Thin pulses
Time (ns)
0 100 200 300 400 500
Amplitude (ADC) -5
0 5 10
PMT-1a
PMT-1b
(d) Electromagnetic interference
FIG. 16. Example coincident waveforms of different event types recorded by PMT-1a (black) and PMT-1b (red). Wave-forms (a) and (b) are signal events at high (700 keV) and low (7 keV) energies, respectively. Waveforms (c) and (d) are thin pulse (9 keV) and EMI (0.2 keV) noise events removed from raw data by cuts.
[image:11.612.58.278.361.511.2]Correlated SPE noise events form a Gaussian peak with a mean of 0.6 keV and a standard deviation of 0.4 keV (see green dashed line in Fig.15). The shape matches the SPE spectrum observed in non-coincident characterization runs, but the rate is two orders of magnitude higher than expected from random coinci-dences between uncorrelated single photoelectrons from the two PMTs. The∼100 Hz SPE rates should produce
∼0.01 Hz of accidental coincidences inside the 400 ns co-incidence window, but the observed rate of correlated SPE noise events is∼1 Hz.
Both thin pulse and SPE events are removed from the data set by cutting on the number of “peaks” (local max-ima) observed in the recorded waveform. Low-energy scintillation events (see Fig.16(b)) are composed of mul-tiple photoelectrons (5.9 and 4.3 pe/keV for Det-1 and Det-2, respectively; see Sec.IV C), whereas thin pulse and SPE events typically only contain one peak. The cut efficiency can be analyzed down to 4 keV using pulse shapes, at which energy the signal passing efficiency is 60% with signal to noise ratio of 16. The cut efficiency below 4 keV is a topic of ongoing investigation.
Several low energy features are visible in the data af-ter applying cuts: a broad peak around 14 keV, a peak at 3 keV, and remnant noise below 2 keV. These features are reproduced by Geant4 simulations (see Fig.17). The broad peak at 14 keV can be attributed mostly to surface contamination of the 238U-chain in the copper encapsu-lation (40 mBq from the inner 10µm); surface contami-nation of this type has been observed previously in other NaI(Tl) experiments [64]. The 3 keV peak is from Auger electrons and X-rays from40K decays in the crystal. The flat background of the crystal out to 30 keV is dominated by contributions from210Pb (238U-chain) and40K.
) ee Energy (keV
10 20 30 40 50 60 70 80 90 100
counts / day / keV / kg
5 10 15 20 25 30 35 40 45 50
Det-1 Data Simulation Total NaI Light Guides
PMTs Pressure Vessel Drill Ice Copper
2 4 6 8 10 12 14 16 18
[image:12.612.62.288.474.629.2]0 5 10 15 20
FIG. 17. The energy spectrum of DM-Ice17 Det-1 (black) and simulation total (red). Simulated contributions from nearby detector components are also shown. The spectrum below 20 keV consists primarily of the 3 keV peak from40K and a 14 keV peak from238U-chain decays on the surface of the
cop-per encapsulation. The background observed between 6.5 – 8 keV is 7.9±0.4 counts/day/keV/kg.
A background of 7.9±0.4 counts/day/keV/kg is ob-served between 6.5 – 8 keV, below which the spectrum is dominated by the 40K peak. DAMA/LIBRA reports a single-hit spectrum with 0.9 counts/day/keV/kg back-ground level after application of a multi-crystal anti-coincidence veto [55]. Recently grown crystals being tested by ANAIS [54] and KIMS [58] have achieved a background level of 3 – 4 counts/day/keV/kg after cuts.
VII. CONCLUSIONS
DM-Ice17 was successfully constructed and deployed in December 2010. The data presented here from July 2011 – June 2013 demonstrate the excellent environmen-tal conditions, including temperature stability with daily RMS of 0.02◦C. A livetime of∼99% was achieved by the detectors during this period.
It has been shown for the first time that low-background scintillator detectors can be remotely cali-brated and operated under the ice at the South Pole. This has promising implications for future dark matter searches in the Southern Hemisphere.
The background observed in DM-Ice17 is in good agreement with simulation of expected contaminants lev-els in detector components; contributions from back-grounds in the environmental ice have been shown to be negligible. Below 20 keV, the spectrum is dom-inated by contributions from the crystals and en-capsulation; in the 6.5 – 8.0 keV region, a rate of 7.9±0.4 counts/day/keV/kg is observed, consistent with expected backgrounds. The energy region of interest be-tween 2 and 6 keV is dominated by the events from40K peak at 3 keV. An active research and development pro-gram toward achieving lower contaminant levels, partic-ularly of40K and238U-chain, is currently underway. The backgrounds observed in new DM-Ice crystals as well as DM-Ice17 analyses of the low-energy region, muon coin-cidence with IceCube, and cosmogenic activation will be discussed in separate papers.
ACKNOWLEDGMENTS
De-partment of Energy. W. P. and A. H. are supported by the DOE/NNSA Stewardship Science Graduate
Fellow-ship (Grant No. DE-FC52-08NA28752) and NSF Grad-uate Research Fellowship (Grant No. DGE-1256259), re-spectively.
[1] P. Adeet al.(Planck Collaboration),Astron. Astrophys.
571, A17 (2014),arXiv:1303.5076 [astro-ph.CO]. [2] G. Bertone, D. Hooper, and J. Silk,Phys. Rep.405, 279
(2005),arXiv:hep-ph/0404175 [hep-ph].
[3] S. Faber and J. Gallagher, Annu. Rev. Astron. Astro-phys.17, 135 (1979).
[4] G. Steigman and M. S. Turner,Nucl. Phys.B253, 375 (1985).
[5] P. Cushman et al., in Community Summer Study 2013: Snowmass on the Mississippi. (CSS2013) (2013)
arXiv:1310.8327 [hep-ex].
[6] M. W. Goodman and E. Witten,Phys. Rev. D31, 3059 (1985).
[7] A. Drukier, K. Freese, and D. Spergel,Phys. Rev. D33, 3495 (1986).
[8] K. Freese, J. A. Frieman, and A. Gould,Phys. Rev. D
37, 3388 (1988).
[9] S. Chang, A. Pierce, and N. Weiner, J. Cosmol. As-tropart. Phys. 01 , 006 (2010),arXiv:0908.3192 [hep-ph]. [10] R. Bernabeiet al.,Int. J. Mod. Phys. D13, 2127 (2004),
arXiv:astro-ph/0501412 [astro-ph].
[11] R. Bernabei et al., Eur. Phys. J. C 73, 2648 (2013),
arXiv:1308.5109 [astro-ph.GA].
[12] C. Aalsethet al.(CoGeNT Collaboration),Phys. Rev. D
88, 012002 (2013),arXiv:1208.5737 [astro-ph.CO]. [13] C. Aalseth et al.(CoGeNT Collaboration), “Search for
an Annual Modulation in Three Years of CoGeNT Dark Matter Detector Data,” (2014), arXiv:1401.3295 [astro-ph.CO].
[14] G. Angloheret al.(CRESST Collaboration),Eur. Phys. J. C72, 1971 (2012),arXiv:1109.0702 [astro-ph.CO]. [15] R. Agneseet al.(CDMS Collaboration), Phys. Rev. Lett.
111, 251301 (2013),arXiv:1304.4279 [hep-ex].
[16] R. Agneseet al.(SuperCDMS Collaboration),Phys. Rev. Lett.112, 241302 (2014),arXiv:1402.7137 [hep-ex]. [17] D. Akeribet al. (LUX Collaboration),Phys. Rev. Lett.
112, 091303 (2014),arXiv:1310.8214 [astro-ph.CO]. [18] G. Angloheret al.(CRESST-II Collaboration), “Results
on Low Mass WIMPs Using an Upgraded CRESST-II Detector,” (2014), in preparation, arXiv:1407.3146 [astro-ph.CO].
[19] E. Aprileet al.(XENON100 Collaboration),Phys. Rev. Lett.109, 181301 (2012),arXiv:1207.5988 [astro-ph.CO]. [20] S. Kim et al. (KIMS Collaboration), Phys. Rev. Lett.
108, 181301 (2012),arXiv:1204.2646 [astro-ph.CO]. [21] E. Aprileet al.(XENON100 Collaboration),Phys. Rev.
Lett.111, 021301 (2013),arXiv:1301.6620 [astro-ph.CO]. [22] S. Archambault et al.(PICASSO Collaboration), Phys.
Lett. B711, 153 (2012),arXiv:1202.1240 [hep-ex]. [23] E. Behnkeet al.(COUPP Collaboration),Phys. Rev. D
86, 052001 (2012),arXiv:1204.3094 [astro-ph.CO]. [24] M. Felizardoet al.(SIMPLE Collaboration),Phys. Rev.
Lett.108, 201302 (2012),arXiv:1106.3014 [astro-ph.CO]. [25] A. V. Belikov, J. F. Gunion, D. Hooper, and T. M. Tait,
Phys. Lett. B705, 82 (2011),arXiv:1009.0549 [hep-ph]. [26] P. Draper, T. Liu, C. E. Wagner, L.-T. Wang,
and H. Zhang, Phys. Rev. Lett. 106, 121805 (2011),
arXiv:1009.3963 [hep-ph].
[27] M. R. Buckley, D. Hooper, and T. M. Tait,Phys. Lett. B702, 216 (2011),arXiv:1011.1499 [hep-ph].
[28] M. I. Gresham and K. M. Zurek,Phys. Rev. D89, 016017 (2014),arXiv:1311.2082 [hep-ph].
[29] D. Hooper, J. Collar, J. Hall, D. McKinsey, and C. Kelso,
Phys. Rev.82, 123509 (2010),arXiv:1007.1005 [hep-ph]. [30] D. Nygren, “A Testable Conventional Hypothesis for the DAMA-LIBRA Annual Modulation,” (2011),
arXiv:1102.0815 [astro-ph.IM].
[31] K. Blum, “DAMA vs. the Annually Modulated Muon Background,” (2011),arXiv:1110.0857 [astro-ph.HE]. [32] J. H. Davis, Phys. Rev. Lett. 113, 081302 (2014),
arXiv:1407.1052 [hep-ph].
[33] J. P. Ralston, “One Model Explains DAMA/LIBRA, Co-GeNT, CDMS, and XENON,” (2010), ,arXiv:1006.5255 [hep-ph].
[34] P. J. Fox, J. Liu, and N. Weiner,Phys. Rev. D83, 103514 (2011),arXiv:1011.1915 [hep-ph].
[35] S. K. Lee, M. Lisanti, A. H. G. Peter, and B. R. Safdi,
Phys. Rev. Lett. 112, 011301 (2014), arXiv:1308.1953 [astro-ph.CO].
[36] J. Cherwinka et al., Astropart. Phys. 35, 749 (2012),
arXiv:arXiv:1106.1156 [astro-ph.HE].
[37] A. Achterberget al.(IceCube Collaboration),Astropart. Phys.26, 155 (2006),arXiv:astro-ph/0604450 [astro-ph]. [38] B. Ahmed et al., Astropart. Phys. 19, 691 (2003),
arXiv:hep-ex/0301039 [hep-ex].
[39] G. Alneret al.(UK Dark Matter Collaboration), Phys. Lett. B616, 17 (2005),arXiv:hep-ex/0504031 [hep-ex]. [40] R. Abbasi et al. (IceCube Collaboration), Nucl.
In-strum. Methods Phys. Res., Sect. A 601, 294 (2009),
arXiv:arXiv:0810.4930 [physics.ins-det].
[41] I. Lawson and B. Cleveland,AIP Conf. Proc.1338, 68 (2011).
[42] R. Abbasi et al. (IceCube Collaboration), Astropart. Phys.35, 615 (2012),arXiv:1109.6096 [astro-ph.IM]. [43] T. K. Gaisser, Adv. Space Res. 51, 242 (2013),
arXiv:1107.1690 [astro-ph].
[44] M. Ackermannet al.(IceCube Collaboration),J. Glaciol-ogy59, 1117 (2013).
[45] W. I. Rose and T. J. Bornhorst,AAPG Special Volumes
SG 13, 13 (1981).
[46] P. Gabrielli et al., Earth Planet. Sci. Lett. 234, 249 (2005).
[47] K. Forrest, C. Haehner, T. Heslin, M. Magida, J. Uber, S. Freiman, G. Hicho, and R. Polvani, NASA STI/Recon Technical Report N84, 33613 (1984).
[48] R. Bernabeiet al.(DAMA Collaboration),Eur. Phys. J. C56, 333 (2008),arXiv:0804.2741 [astro-ph].
[49] D. Engelkemeir,Rev. Sci. Instrum.27, 589 (1956). [50] I. Khodyuk, P. Rodnyi, and P. Dorenbos,J. Appl. Phys.
107, 113513 (2010),arXiv:1102.3799 [physics.ins-det]. [51] J. Back and Y. Ramachers, Nucl. Instrum. Methods
[nucl-ex].
[52] M. Laubenstein and G. Heusser,Appl. Radiat. Isot.67, 750 (2009).
[53] B. N. L. National Nuclear Data Center,“Nudat (nuclear structure and decay data),” (2008).
[54] J. Amar´eet al.,Nucl. Instrum. Methods Phys. Res., Sect. A742, 187 (2014),arXiv:1308.3478 [physics.ins-det]. [55] R. Bernabei et al. (DAMA Collaboration), Nucl.
In-strum. Methods Phys. Res., Sect. A 592, 297 (2008),
arXiv:0804.2738 [astro-ph].
[56] E. Sakai,IEEE Trans. Nucl. Sci.34, 418 (1987). [57] C. Cuesta et al., Opt. Mater. 36, 316 (2013),
arXiv:1307.1398 [astro-ph.IM].
[58] K. Kim et al., Astropart. Phys. 62, 249 (2015),
arXiv:1407.1586 [astro-ph.IM].
[59] ILIAS,“Database on radiopurity of materials,” (2007). [60] S. Agostinelliet al.,Nucl. Instrum. Methods Phys. Res.,
Sect. A506, 250 (2003).
[61] J. Allisonet al.,IEEE Trans. Nucl. Sci.53, 270 (2006). [62] S. Guatelli, A. Mantero, B. Mascialino, P. Nieminen, and
M. Pia,IEEE Trans. Nucl. Sci.54, 585 (2007).
[63] J. Amar´e et al., Opt. Mater. 36, 1408 (2014),
arXiv:1401.3118 [physics.optics].


![FIG. 8. Energy resolution of Det-1 (black) and Det-2 (red)compared to ANAIS-25 (blue, dotted) [54], DAMA/LIBRA(magenta, dashed) [55], NaIAD detector DM77 (cyan, dot-dashed) [38], and a 2x1x1 cm3 NaI detector (green, solid) [56].The discontinuity in the DAM](https://thumb-us.123doks.com/thumbv2/123dok_us/7928405.193232/8.612.322.554.324.482/energy-resolution-compared-libra-magenta-detector-detector-discontinuity.webp)