BC
IC
HPBRS
COMMISSIOTII OI THE EUROPEATII COMMUTTITIES O DIRECTORATE-GEI{ERAI FOB ECOITOMIC A]TD FITTAI{CIAI AFFAIBS
No. 17 JuLy 1983
The employment miracLe
in
the
United
states
andst asnat'
nn-":o:::H
":^":::":::::":
commun i
tv
MANFRED !'EGNER
"Economic Papers"
are written by the
Staff of
the
Directorate-GeneraLfor
Economic and FinanciaLAffairs, or
by
experts
working
in
association
with
them.
The "Papers"are
intended
to
increase
ah,arenessof
thetechnicaL
workbeing
doneby
the
staff
andto
seek comments and suggestionsfor further
anaLyses.
They maynot
be quoted withoutauthorisation.
Views expressedrepresent
excLusiveLythe
positions
of
the
author
and donot
necessari Ly correspondwith
those
of
theCommission
of
the
EuropeanCommunities.
Comments andenquiries
shouLd be addressedto
The Di rectorate-Genera L
for
Economic
and Fi nanci a LAffai
rs,
Commissionof
the
European Communities,?OO,
rue
de
La LoiECONOMIC PAPERS
No. 17 July 1983
The employment miracle in the United States and stagnating employment in the European Community
a tentative explanation
-MANFRED WEGNER
3
-ABSTRACT:
In recent years, a period of exceptional expansion of the Labour supply, the USA and EC-countries have experienced markedly different rates of job creation. The purpose of this paper is to throw Light upon this develop-ment. Considered in terms of new jobs created the differences between the American and European performances in this regard have been remarkable. Thus, the USA was able to create 15 million new jobs from 1973 to 1981, a
period when the Community as a whole exp~rienced a slight fall in
I
II
III
IV
v
5
-CONTENTS
Introduction
Employment trends in the major industrialized countries
The United States
Japan
Austria
The countries of the European Community
Slower economic growth, reduced productivity gains and employment
Real economic growth and productivity gains
Declining productivity growth: an unsolved puzzle
Manufacturing industry and export dependence
Real wages, adjustment problems and employment
Real wages and employment
Real wages, inflation and adjustment problems
Real wages and the relative wage structure
Summary
Increased employment through faster economic growth? Forgoing productivity growth?
Moderating or reducing real wages
References
6
10
10
14
17
20
25
25
27
32
35
35 40
43
46
47
48
50
6
-I INTRODUCTION
Unemployment has become the central economic policy issue in all the Western industrialized countries, having climbed dramatically almost every-where in the last ten years. Unemployment rates in the United States and in the European Community stood at more than 10 % of the labour force in mid-1982 and are still rising. A superficial comparison of unemployment rates might suggest that the problems and hence also the causes of rising unem-ployment are identical or at least similar. Yet even an initial confronta-tion of the trends of labour supply, employment and overall economic trends reveals large differences between the industrialized countries.
Between 1973 and 1981, more than 15 million jobs were created in the United States, equivalent to an average annual increase of 2 %. In the Com-munity, the numbers in employment in 1982 has fallen back to their 1961
level and will probably decline further. Less than half of the employment growth in the United States since 1973 would have been sufficient in Europe to substantially ease the unemployment problem. For example, annual employ-ment growth of 1 % in the Community from 1973 to 1981 would have meant some 8 1/2 million extra jobs, while there was in fact a 7 1/2 million increase in the number of jobless.
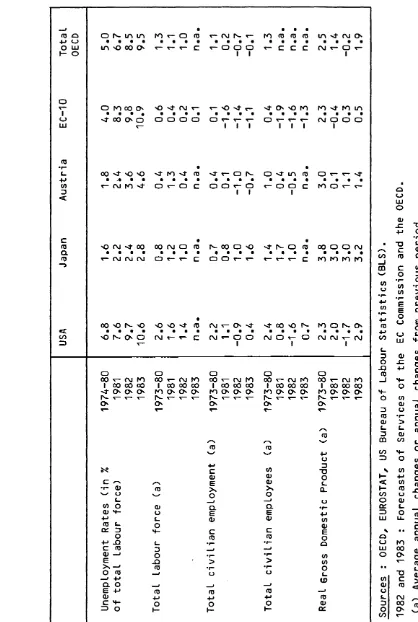
Japan is nowadays often held up as an unattainable model for a suc-cessful high employment policy. Its unemployment rate of just under 2 % has doubled compared with the 1960s. Under similar circumstances, some small European industrialized countries, like Austria, Norway and Switzerland, have also managed to hold their unemployment rate to under 2% from 1974 until very recently. The European Community by contrast has seen a three-fold or four-three-fold increase in its unemployment rate compared with the 1960s. In some member countries, the deterioration in the labour market situation has been even worse and has recently accelerated rapidly <see table 1).
7
Table 1 Real Growth, Employment, Unemployment 1973 -1983 USA Japan Austria Unemployment Rates (in % 1974-80 6.8 1.6 1.8 of total labour force) 1981 7.6 2.2 2.4 1982 9.7 2.4 3.6 1983 10.6 2.8 4.6 Total labour force (a) 1973-80 2.6 0.8 0.4 1981 1.6 1.2 1.3 1982 1.4 1.0 0.4 1983 n.a. n.a. n.a. Total civilian employment (a) 1973-80 2.2 0.7 0.4 1981 1 .1 0.8 0.1 1982 -0.9 1.0 -1.0 1983 0.4 1.6 -0.7 Total civilian employees (a) 1973-80 2.4 1.4 1.0 1981 0.8 1.7 0.4 1982 -1.6 1.0 -o.5 1983 0.7 n.a. n.a. Real Gross Domestic Product (a) 1973-80 2.3 3.8 3.0 1981 2.0 3.0 0.1 1982 -1.7 3.0 1.1 1983 2.9 3.2 1.4 Sources : OECD, EUROSTAT, US Bureau of Labour Statistics (BLS). 1982 and 1983 : Forecasts of Services of the EC Commission and the OECD. (a) Average annual changes or annual changes from previous period EC-10
Total OECD
[image:9.845.99.517.87.709.2]1 0
-II EMPLOYMENT TRENDS IN THE MAJOR INDUSTRIALIZED COUNTRIES
The United States
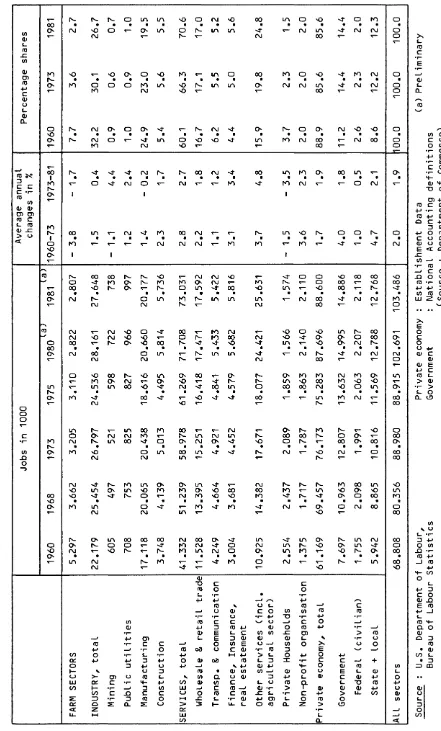
The employment trend in the United States since the first oil crisis has continued a pattern already established in the 1950s and 1960s. During the last twenty years, employment in the United States rose by an annual average of some 2% to stand at more than 100 million in 1980. In absolute terms, the number of employed persons rose by an annual average of around 1,5 million from 1960 to 1973 and by an annual 1,9 million from 1973 to 1981. This upward trend has begun to ease off only recently. Total employ-ment declined by 1 % in 1982 (the first fall since 1975).
The main trends in the United States in the eight years from 1973 onwards are as follows (see also tables 1 and 2):
civilian employment increased by 15,3 million, i.e. 2% annually; the decline in the numbers employed in agriculture (which had been evident since the 1950s and 1960s) came to a halt in the early 1970s;
the total of more than 15 million new jobs was created predominantly in the service and the government sector, since employment in manufacturing industry has more or less stagnated since 1969; by contrast, employment in mining and construction increased by almost 0,7 million, with the result that overall industrial employment has still risen annually by some 1 % since 1973 (according to survey data).
Employment trends in manufacturing industry will not be analysed in any great detail here. Manufacturing employment practically stopped growing at the end of the 1960s and suffered declines in 1971 and 1975 which were
reversed in the following years. Its level in 1981 was the same as in 1969. This virtual stagnation masks a multiplicity of declining and expanding industries. Industries with vigorously expanding employment since 1973 are plastic products, electronic components, and medical and dental instruments
1 2
-gas industries (though production there has not gone up). Employment growth in construction was maintained until 1979 but has since declined again <see table 3).
The United States has steadily become a service society~ A total of
\
70 % of all jobs in 1981 was accounted for by the private and government
service sectors. From 1973 to 1981, the number of jobs in these sectors
increased by 2,7 % annuall~Breaking down the private service sector into
30 service industries allows us to identify the industries which actually
made the running in the creation of new jobs in the 1970s 1• The industries
with rapid employment growth in the period 1973-81 were the following <see also table 4):
Table 4 - Employment growth in some services, 1973-1981 United States
Increase 1973-1981,
Numbers employed annual
Sector in 1981 average
<in
<millions) thousands) (in %)
Professional services 2 022 775 2.8
Business services 3 605 1 426 6.5
Banks, credit institutions,
4 443 1 064 3.5
insurance
Real estate 1 373 300 3.1
Eating and drinking places 6 671 2 044 4.7
Hospitals, doctors, medical
5 948 1 934 5.0
services
Amusement and recreation
1 127 240 3.0
services
Educational services 1 798 469 3.9
Total 26 987 8 252 4.7
1
The employment figures broken down by economic sectors <tables 3 and 4) are based on establishment data. All the other figures are taken from
[image:13.587.55.526.325.691.2]1 3
-From 1973 to 1981, these eight sectors experienced an annual in-crease of between 4% and 5 %, thus creating more than 8 million new jobs, i.e. almost 60% of the employment growth in the service sector (including government). The wholesale and retail trades provided another 2,3 million new jobs and the government sector <excluding the armed forces) about 2 million.
The move towards a "service society" has been less evident in the United States in those service sectors which are linked with the production of goods in the traditional sense <transport, the wholesale and retail trades). The exceptions are air transport, the banking and real estate tors, and business and professional services. The professional service sec-tor provides a number of very different functions, such as legal auditing, bookkeeping, accounting, engineering and architectural services. The busi-ness service sector, which includes personnel supply, janatorial and pro-tective services, data-processing, leasing and similar services, is also reflecting the growing transfer to specialized service enterprises of acti-vities that used to be performed largely by industry.
Looking at the long-term trend to the mid-1970s, the government sec-tor made an above-average contribution to employment growth (annual increase of some 3,9% from 1960 to 1975). Between 1960 and 1981, civilian public employment increased by 7,2 million persons. In 1960, 11 %of total
civi-lian employees worked for some level of government (excluding government enterprises) and this proportion had risen by 1981 to 14,4 %. The increase in employment took place largely at state and local government levels, which benefited from the rapid expansion of welfare, health and education programmes. Since 1975 this trend has been reversed. Since 1981 employment in the government sector has contracted as a result of the cutbacks imposed
by the Reagan administration 2
What might be the future pattern in the 1980s? The Bureau of Labor Statistics recently updated its long-term projections of growth and
employ-ment up to 1990 3• These show that, particularly after 1985, the growth of
the labour supply will slow down. Assuming an annual real growth rate for
2
See Tucker <1981). 3
1 4
-gross domestic product of 2,5 % in the 1980s (slow growth scenario), the total number of employed persons could grow by 1,5 % annually, equivalent to 1,6 million jobs a year. As in the 1960s and 1970s, private services will show the largest increase in employment (2,0% annual growth in
1979-90), with the best performance once again in health, eating and drink-ing places and retaildrink-ing. However, the Bureau also projects employment in-creases in manufacturing industry and construction. Employment in the government sector, by contrast, is expected to grow more slowly. More favourable growth performance could produce even more rapid increases in employment (2,1 % a year).
Japan
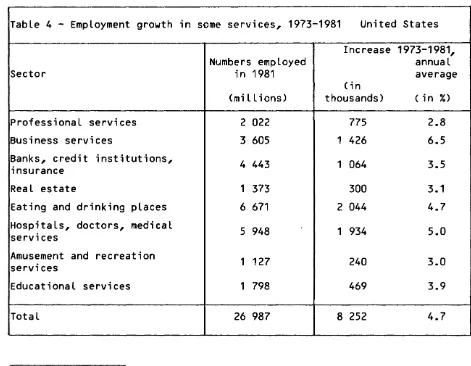
The increase in the numbers employed in Japan was less marked than in the United States, but none the less amounted to an average of around 1,3% a year from 1960 to 1973, or some 630 000 annually).
In contrast to experience in the United States, the annual growth rate of the employed labour force in Japan has been almost halved since 1973 compared with the 1960s. The following trends may be discerned (see table 5):
the share of employment in agriculture in Japan is still as high as 10 %; the drift from agriculture has slowed down distinctly, and other sectors, especially industry, have stopped absorbing labour;
the numbers employed in industry (including construction) have been static, while manufacturing, which now provides some 25% of total employ-ment, reduced its work force after the first oil crisis by some 1 million and has since increased it only marginally;
the expansion of the service sector continued in the 1970s, slowing down only a little compared with the period 1960-73.
Table 5 Japan-Civilian Employment by Economic Sectors,1960 -1981 1960 1967 1973 AGRICULTURE 13.400 10.360 7.050 INDUSTRY, total 12.650 16.640 19.570 Mining 430 260 130 Manufacturing industr. 9.460 12.520 14.430 Electricity, Gas, 230 270 340
Water Building
& construct. 2.530 3.590 4.670 SERVICES, total 18.310 22.200 25.970 Wholesale & .l (a) reta1 9.470 10.850 Transport & communi c. 2.160 2.890 3.370 Banks, insurance~ real 1.360 1.570 estate (b) 14.730 Social & personal 6.910 8.380
services Central
Government 1.420 1.570 1.800 (exclud. armed forces) All economic sectors 44.360 49.200 52.590 Sources OECD (a) Including restaurants (c) 1967-73 1000s Average annual Percentage shares changes in % 1975 1980 1981 1960-73 1973-81 1960 1973 6.610 5.770 5.570 -4.8 -2.9 30.2 13.4 18.730 19.560 19.700 3.4 0.1 28.5 37.2 160 110 100 -8.8 -3.2 1.0 0.2 13.460 13.670 13.850 3.3 -0.5 21.3 27.4 320 300 310 3.1 -1.1 0.5 0.6 4.790 5.480 5.440 4.8 1.9 5.7 8.9 26.890 30.030 30.540 2.7 (c) 2.0 41.3 49.4 11.270 12.480 12.740 2.3' 2.0 20.6 3.320 3.500 3.440 3.5 (c) 0.3 4.9 6.4 1.700 1.910 2.000 2.4 3.0 3.0 8.640 10.150 10.420 2.8 16.0 1.960 1.990 1.940 1.8 0.9 3.2 3.4 52.230 55.360 55.810 1.3 0.7 100.0 100.0 (b) Including wholesale and retail trade, banks, insurance and social and personal services.
1981 10.0 35.3
0.2
24.8 0.6 9.7 54.7 22.8 6.2 3.5 18.7 3.5
[image:16.842.89.439.84.819.2]1 6
-The first oil crisis produced a structural break in Japanese economic trends. Economic growth before 1973 was led by manufacturing industry, with rapid growth in industrial employment, paralleling that in the service sec-tor. This growth pattern changed after 1974. Employment in manufacturing fell, while there was an even sharper drop in hours per week. The structure of employment within industry also shifted as a result of changes in the composition of demand. Employment fell disproportionally in the energy-intensive and raw-material-dependent sectors such as steel, textiles, fur-niture and chemicals.
The employment situation in manufacturing began to recover only gra-dually as the adjustment process triggered by the oil price shock got under way. Employment slowly picked up again in the sectors buoyed up by the ex-port boom. But the bulk of the adjustment was in the form of a more rapid increase in labour productivity and greater use of overtime, part-time working (particularly by women> and subcontracting through small and medium-sized firms. The example provided by the employment adjustment pro-cess in Japan is instructive, but one which the Western industrialized
4
countries can hardly imitate
Despite its rapid industriali-zation, Japan too has become a "service society". In 1981, almost 55 % of the employed labour force were working in the service sector (including government). With the earlier, rapid de-cline of the agricultural workforce, employment in the service sectors expanded, and this continued at a steady pace even in the 1970s. Two dif-ferences may be observed here compared with the United States and the European countries:
the wholesale and retail trades <including restaurants) provide a disproportionally large share of total employment in Japan, and this share continued to rise even after 1973 <in 1981, it was 22,8 %>; in Japan, there are almost 20 persons employed in distributive trades to every 100 000 in-habitants <compared with 10 to every 100 000 inin-habitants in the United
States>. The Japanese distributive system, unlike other sectors of industry, is "overmanned" and still lacking in efficiency, but it acts as an important social safety net (family business, the elderly), with a predominance of self-employed persons and unpaid family workers (35 %of total employment in this sector>;
(3)
1 7
-employment in the government sector accounts for only a very small proportion (3,5 % in 1981) of total employment; the percentages (excluding the armed forces) in the United States and in the Federal Republic of Ger-many are 15 % and 13 %, respectively; this low level of employment in the government sector is largely due to the fact that public-sector welfare, social security and health services are not yet very highly developed in Japan, their functions being performed either by households or by large firms.
Thus, the 4,5 million new jobs created in the service sector (inclu-ding government) in the eight years since 1973 have more than offset the decline in agriculture. The Largest increases were in "other services" and in "banking, insurance, real estate". The high proportion of self-employed persons (and family workers) in these sectors reflects the Large number of small and medium-sized firms, which also still play an important role in the industrial sector. There are a number of indications which suggest that employment trends in the service sector have been much Less influenced by the growth rate of industry since 1973 and that this pattern will continue.
Austria
Only four relatively small industrialized countries in Europe (Switzerland, Norway, Sweden and Austria) managed to maintain full employ-ment in the crisis period following 1973. While the unemployemploy-ment rate in the European Community averaged some 5,4 % in the period 1975 to 1980, it did not rise above its 1960s Level in the abovementioned countries, remain-ing at under 2% until 1980.
Table 6 - Employment performance in selected countries, 1973-1981
Austria Norway Sweden Switzer- EC-10
Land
Unemployment 1975-80 1.9 1.9 1.9 (0.4) 5.4
rate (a) 1981-82 3.0 2.3 2.8 (0.3) 8.8
Total employment
1975-79 0.9 2.3 0.7 -0.5 0.1
(annual average
growth rate 1979-81 0.6 1.6 0.5 1.5 -1.5
in %)
Source: OECD, Historical Statistics 1960-1980 (Paris 1982) and Labour Force Statistics.
[image:18.577.59.518.603.801.2]- 1 8 - ·
Each of these countries has special features which may help to "explain" their success in maintaining full employment at least until the onset of the current recession. The example of Austria will be analysed in some detail here, since it reveals close parallels to the pattern in the United States.
As in the case of the Community countries, the labour supply in
Austria has increased since 1974 (by an annual average of 1,5 % of domestic
employees. At the same time, however, there was in Austria a steady increase in the employed Labour force <with the exception of 1975) and an even
shar-per increase in the number of wage and salary earners (some 0,4 % and 1 %
a year respectively). The increase in the demand for Labour was encouraged by a combination of factors, including the demand effects of an expansio-nary fiscal policy, large-scale cuts in working hours <which had been intro-duced on social policy grounds at a time when there was a shortage of
Labour) and an active Labour market promotion policy. However, the service
5
sector also made an important contribution to job creation
Despite the impact of the 1973 oil crisis, employment in industry did not begin to decline in Austria until 1975. However, following the sharp drop of 3,2 % which occurred in 1975, it was only in 1977 that the numbers employed in industry showed any major improvement.
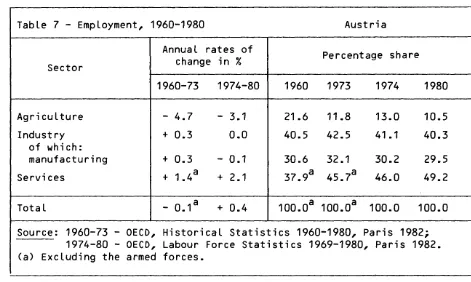
Table 7 - Employment, 1960-1980 Austria
Annual rates of
Percentage share
Sector change in %
1960-73 1974-80 1960 1973 1974 1980
Agriculture - 4.7 - 3.1 21.6 11.8 13.0 10.5
Industry + 0.3 0.0 40.5 42.5 41.1 40.3
of which:
manufacturing + 0.3 - 0.1 30.6 32.1 30.2 29.5
Services + 1.4a + 2.1 37.9a 45.7a 46.0 49.2
Total - 0.1a + 0.4 100.0a 100.0a 100.0 100.0
Source: 1960-73 - OECD, Historical Statistics 1960-1980, Paris 1982; 1974-80 - OECD, Labour Force Statistics 1969-1980, Paris 1982. (a) Excluding the armed forces.
[image:19.587.46.517.504.786.2]1 9
-The number of wage and salary earners in the service sector con-tinued to increase even during the period of crisis. The annual growth of employment in this sector amounted to some 2,2 % from 1974 to 1981; this increase was significantly steadier and faster than in the Federal Republic of Germany, for example, and matched that in the United States. The fastest expansion in employment in the service sector was in educational and health services, which benefited both from government policies and from tourism. Employment also increased at an above-average rate in hotels and catering, legal and economic services and in banking and finance. Public services and the distributive trades, which in 1979 provided respectively some 32 % and 24 % of jobs in the service sector, also expanded their work force by 2 % annually (accounting for 25% of the increase in the service sector). Austria evidently experienced a catching-up process in the development of public and social services once the sharp growth of industry eased off.
The unemployment rate in Austria showed little or no increase even in the years of declining or weak growth (1975 and 1978). Only after 1981 did unemployment begin to rise distinctly, as the current recession spread to Austria and labour hoarding could no longer be continued <see table 1). The unemployment rate could conceivably reach some 4,5 % of the dependent
labour force in 1983. The increase in hidden unemployment, which Butschek <1982, p. 111) estimated at 0,4% for 1979, has also in recent years in-dicated growing labour market problems. In Austria too, despite all the successes of employment policy, the question which is being asked with in-creasing urgency is whether full employment can be maintained in the future. As in the past, the labour supply will probably grow by more than 1 %an-nually up to 1986 <an annual average increase of some 30 000 persons), as a result of population structure and rising female activity rates. Only after 1986 will the growth of the labour supply ease, slowing down increasingly
(by 1990, it will be down to only 0,3 %) 6
The Austrian Institute for Economic Research takes the view that, assuming otherwise unchanged conditions, 4 % annual real growth would be necessary to absorb the additional labour force potential in the medium term (up to 1986). Various simulations of labour demand in the 1980s, point to a further, albeit slower, increase in the total number of employees even
6
W
-in the event of slower economic growth. With economic growth of 2 1/2 % a
year, the demand for labour as a whole and for employees would increase
annually by only some 0,4 % and 1 %, respectively, producing an excess
supply of 162 000 persons in 1986, equivalent to an unemployment rate of
5,4 %. An optimistic variant assuming 3 1/2 % growth would result in a
substantially lower over-supply of labour, amounting to 48 000 persons in 1986.
The countries of the European Community
The trend in the Community countries followed a very different pat-tern from that in the United States and Japan. Total employment in the Com-munity of Nine stabilized during the 1960s at around 102 million, reached cyclical a peak in 1974 ( 105 million), which was exceeded only in 1979, but dropped in 1981 and again in 1982·
In the period 1960-73, countries with relatively high rates of growth in total employment (Denmark, the Nethertands, France and Belgium) con-trasted with countries where there was a decline (Italy) or little or no change in the employed labour force (Ireland, the Federal Republic of Ger-many and the United Kingdom). In the period 1973-81, the growth of employ-ment slowed down generally or became negative. There were two exceptions: Italy, which reversed its downward trend, and Ireland, where stagnation in the level of employment was followed by marked growth <see table 8).
F.R.
Germany
France Italy United
Kingdom
Netherlands Belgium Denmark Ireland EC-9 United
2 2
-The national averages mask sectoral differences which we will look at only briefly:
the drift from agriculture continued at a slower pace; it was less rapid in those member countries in which agriculture already accounted for a low proportion of employment (the United Kingdom, the Netherlands), and
was due almost entirely to a drop in the number of self-employed and Df
un-paid family workers who, taking the Community average, still account for
70 % of the agricultural work force;
the decline almost everywhere in employment in the secondary sector was due largely to manufacturing industry, the main countries affected here being the United Kingdom, Belgium and Denmark; only Italy and above all Ire-land were not affected by the decline; as a result of the recession, employ-ment in building and construction fell;
employment in the tertiary sector continued to expand in all the member countries, with the sharpest increases being in Italy and Ireland, and the lowest increases being in the United Kingdom and the Federal
Repub-lic of Germany.
A comparative and detailed analysis of the trends in manufacturing industry by member country would go beyond the objectives of this investi-gation and would seem to be of only limited use in answering the question we are concerned with here. Suffice it to say that, in all the Community countries, employment in manufacturing slumped in 1974/75 and the numbers in employment continued to decline in the years thereafter, with a few exceptions. Since 1981, the fall in industrial employment has become shar-per in all the member countries.
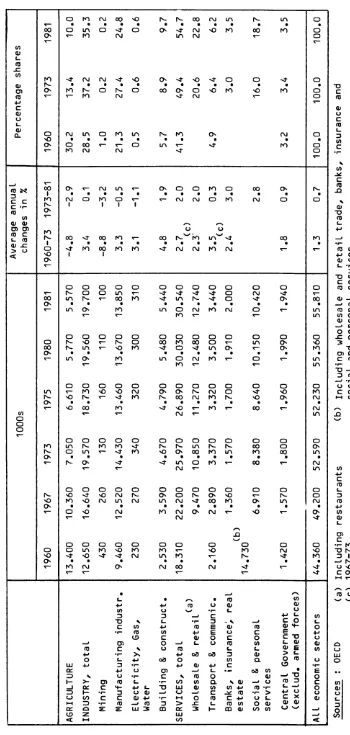
A more worthwhile exercise is to look at the differences in employ-ment trends in the service sector in the various member countries. However, this exercise is much more difficult, since comparable statistics are not available at a sufficient level of detail. Nevertheless, the rough
break-down in table 9 7 is sufficient to bring out a number of striking
differen-ces for the period 1973-81:
7 The statistics of table 8 are not directly comparable with those of
2 3
-the wholesale and retail trade (including repair services): stag-nating or declining employment in the Federal Republic of Germany, Belgium, the Netherlands and the United Kingdom;
hotels and catering services: low rates of increase; there was a significant increase only in Italy and Belgium;
transport services: a fall in employment in the Federal Republic of Germany and in ·the United Kingdom, stagnation in the Netherlands;
communications: slow growth in employment in the Federal Republic of Germany and stagnation in the United Kingdom; strong growth rates else-where;
banking and insurance: vigorous growth in employment, though here again the Federal Republic of Germany is the exception;
"other market services": here occurred the sharpest increases in employment;
there has been disproportionately rapid growth in the government sector, which together with domestic services and services provided by
private non-profit institutions account for some 16 % to 21 % of total
Table 9: EEC Member States -Employment by branch,1973-198~1 Average annual changes in o<c> F AGRICULTURE -4.1 -2. 8 INDUSTRY, total -1.3 -1.4 -Fuel and power products -0.4
-o.
2 -Manufacturing -1.3 -1.5 -Building and construction -1.6 -1.4 SERVICES, total 1 .1 1. 6 o.o<a> -Repair and trade services 0.9 (b) -Lodging and catering serv. 0.8 -Transport services -0.8 0.4 -Communication services 0.1 2.2 -Credit&
Insurance instit. 1.3 2.3-
Other market services 2.0 3.8 Privat sector, total -0.8 0.1 -General Government 2.4 (including armed forces) 1.1 -Other non-market services 1.8 All sectors -0.3 o. 1 (a) Wholesale and retail trade only. (b) Included in "Other market services" Source: Eurostat (for F,I,UK,NL,s,DK) I -2. 5-o.o
1.6 0.1 -0.1 2.2 2.0 1.3
1.4 2.2 5.3 2.1 0.5 2.3 0.8 0.8
UK NL -1. 2 -1.5 -2.9 -1. 9 -0.4 -0.4 -3.3 -2.0 -2.1 -1.8 0.4 1 •. 4 (a)
-o.
7-o.
2 (b) -1.0 -1.2 o.o -0.0 2.5 1.43.1 3.4
-1.3
-0.1 2.3
0.9 -8.2 -0.8 0.1 (c) 1973-80 (d) 1980 % Percentage 8 EC-9(c.) D(d) F I -2.8 -2.7 5.5 8.6 12.7 -3.0 -1.2 44.2 33.5 36.1 -2.2 -0.1 1.9 1.4 0.9 -3.4 -1.2 34.3 23.8 26.7 -1.6 -1.1 8.0 8.3 8.5 1. 6 1 .5 50.3 57.8 51.2 (a) 0.2 (0.6) 13.3 14.5 15.8 2.4 (b) 2.8 2.9 0.6 0 .it 3.7 4.0 4.7 1.9 2.1 1.2 2.3 2.7 2.8 2.5 1.7 4.2 10.7 13.5 7.2 -0.9 -0.2 82.1 81.7 82.3 2.9 14.9 15.3 1.7 18.3 -2.5 3.0 2.4 -0.2 0.1 100 100 100 shares 1981 UK NL 2.7 5.8 33.8 30.0 2.6 1.3 24.4 20.1 6.8 8.6 63.5 64.1 (a) 13.8 17.3 (b) 2.3 5.4 5.0 1.9 1. 7 19.7
3.7 17.9
77.3
83.7 15.3
22.7 1.0 100 100 Statistisches Bundesamt (National Accounts , revised results 1960 to 1981 for the F.R. Germany) 8
3.7 31.5 1 .6 22.7 7.2
(4)
2 5
-III SLOWER ECONOMIC GROWTH, REDUCED PRODUCTIVITY GAINS AND EMPLOYMENT
Since the early 1970s, most of the industrialized countries have experienced a combination of rising inflation rates and high unemployment. In addition, in the wake of the first oil crisis, the trend rates of econo-mic growth have fallen dramatically almost everywhere. In the debate on the
cau~es of the upsurge in employment, the main blame is usually placed on the marked decline in economic growth. It is often argued that unemployment cannot be brought down unless we manage to return to the rates of growth in real output current in the 1960s. While there is no doubt a positive link between economic growth and employment, the latter is also dependent on other factors, such as the growth of labour productivity, sectoral changes
in the mise of economic activity and the ways in which work and working hours are organized.
In Japan, Austria and the United States, at least in the period 1973-81, the growth rates of total output rose faster than the Community average. But this in no way provides an explanation for the difference in employment trends. Whereas, from 1973 to 1981, real GOP in the United
States grew only 3 % faster in aggregate than in the Community, the numbers
employed in the United States increased by 17 %, but stagnated in the
Community. Similar disparities between economic growth and employment growth can be found within the Community: with annual growth in real GOP
averaging 2 % to 2,5 % (1973-1981), the employed labour force declined in
the Federal Republic of Germany and Belgium, remained broadly unchanged in France, and increased in Italy <see table 8).
Real economic growth and productivity gains
2 6
-Table 10 - Real GOP per man-hour in selected countries, 1950-81
Diffe-Annual average rates of rences In
$
at 1975 prices andincrease in % 1973-81 purchasing power
over parities
1870-50 1950-60 1960-73 1973-81 1960-73 1960 1973 1981
Fed. Rep. of
1. 5 6.9 5.4 3.7 - 1.7 4.12 8.16 10.89
k;ermany (0)
\
France 1.9 4.4 5.5 3.3 - 2.2 4.16 8.38 10.89
Italy 1.4 4.4 6.9 (2.5) c
Netherlands 1.4 3.4 5.3 2.4 a - 2.9 4.63 9.02 10.64b
~elgium 1.3 3.2 5.4 4.2 c
United Kingdom 1.4 2.2 3.9 2.9 - 1.0 4.33 7.10 8.92
~ S A 2.3 2.3 2.6 1 • 1 - 1.5 7.43 10.42 11.40
Uapan 1.6 5.7 9.3 3.1 - 6.2 1.65 5.24 6.67
Average d 1.7 4.2 5.3 2.8 - 2.5
Source: Maddison (1982, 1982 a) (a) 1973-80 (c) 1973-79
(b) 1980 (d) D,F,NL,UK,USA,J
The decline in labour productivity growth during 1973-81 was less pro-nounced in the countries which already had a slower productivity trend in the 1960s (the United Kingdom and the United States), but also in the Federal Republic of Germany. It was sharpest in Japan (see table 10).
The sharper the decline in productivity growth in relation to the slow-down in economic growth, the less drastic were the necessary adjustments in employment trends (or, to be more precise, in the volume of work, defined as the product of the numbers employed and average annual working hours per person employed). In other words, the greater the gap between the economic growth rate and the growth rate of labour productivity, the greater the increase in employment Cor in the volume of work). However, the tautologi-cal links between real growth, productivity growth and changes in employ-ment make us go round in circles, unless we can explain:
why the break in trend in labour productivity occurred, and
[image:27.581.55.534.89.448.2]2 7
-Declining productivity growth: .an unsolved puzzle
The slowdown in productivity growth is sometimes described as the major economic ill facing present-day industrialized societies. "More than anything else- higher oil prices, deteriorating terms of trade, greater instability in capital and exchange markets, high inflation- slow produc-tivity growth is the root cause of the halt in the rise in Living standards
and of the political malaise affecting the Western countries11 8• The
rea-sons for this decline in productivity growth have been the subject of per-sistent controversy.
Much has been written on the slowdown in productivity growth in the
American economy 9, and the topic is as yet by no means exhausted 10•
Recent research work has not yet produced any satisfactory solution to the
"Great Productivity Mystery" • Most studies on growth (growth accounting)
have shown that Less than half of the observed slowdown in the growth of output per unit of Labour input is attributable to the capital intensity of production, to the training and experience of Labour, to increasing regula-tion and to the aging of the capital stock.
For example, Nordhaus <1982), as well as Denison, was bold enough to attempt a simplified assessment of the causes of the slowdown in producti-vity growth during the period 1973-80 <as compared with 1948-65) in the private sector in the United States, identifying the following pattern (in percentage points):
Overall slowdown - cyclical
- trend
8 W.O. Nordhaus (1982).
2.5 0.3 2.2
Sources :
- capital stock - labour
- energy - regulation
- R
&
D- sectoral shifts - unexplained
0.3 0.1 0.2 0.2 0.1 0.3 1.0
9 E. Denison <1979>, J. Kendrick (1981), B.M. Fraumani and D.W.
Jorgen-son (1981>, M.N. Baily <1981) and National Institute of Economic and Social Research (1982).
10 See papers by Maddison, Denison, Jorgenson and others prepared for a
2 8
-Other authors reached differing conclusions as to the role and im-pact of the oil price rise on the efficiency of the capital stock and on productivity growth (Jorgenson, Baily) or as regards the effect of slower growth rates in investment and capital accumulation on labour productivity.
Similar difficulties arise in attempting to explain the differences in productivity trends and in the rate of slowdown in productivity growth in Europe since 1973. Because the decline in productivity growth was so general and affected all the countries concerned simultaneously, it seems
reasonable to begin by looking for a common explanation. Factors that spring to mind are:
the slowdown in economic growth since 1973, with the two recession periods of 1974-75 and 1980-81, resulting in lower capacity utilization, a declining propensity to invest and thus a slower growth in the productive capital stock;
the rapid rise in energy prices which has affected all the industria-lized countries since 1974;
the effects of inflation since the early 1970s and economic policy reactions thereto.
The correlation between output and productivity has long been known as the Kaldor-Verdoorn Law. It suggests that, with significant economies of scale, a deceleration in economic growth results in a corresponding slow-down in productivity growth, particularly in manufacturing industry. These medium-term dynamic affects are difficult to measure for the economy as a whole and are obscured by many other factors 11
As
a
result of the rise in oil prices, energy costs have now risento some 7 % - 14 % of GOP at factor cost, from 1 % - 2 % in 1973. This major
shift in relative prices has induced fundamental changes in the allocation of ressources. In particular, higher-priced energy has increasingly been replaced by other production factors, and the growth of demand and of pro-ductivity has been weakened. Considerable controversy has arisen as to the
11
-~-direct influence of the energy factor on the slowdown in productivity. In the case of the United States, its influence is estimated to be in the
12
region of 0.1 to 1.5 percentage points. Nordhaus , by contrast, estimates
the effects of the rise in energy prices on productivity in the OECD as a whole during the period 1973-79 at only 0.14 percentage points <while La-bour productivity growth slowed by 2.4 percentage points compared with 1963-73).
Since 1973, the increase in the capital stock per employee <capital intensity) has fallen off distinctly in all of the countries considered, and, as a result of the two oil price shocks, part of the existing capital stock has become prematurely obsolete (Table11). Moreover, owing to in-creasing uncertainty on world financial and exchange markets and the rapid rise in labour costs, the growth of gross fixed capital formation slackened distinctly in the 1970s, which has meant a slowdown in the introduction of new technologies <"embodied" technical progress).
The discussion about capital's explanatory role in the deceleration 13
of productivity growth has produced conflicting conclusions • Yet the
slower rise in capital intensity (capital-Labour ratio) is obviously a key factor in "explaining" the slowdown in productivity growth in many industria-lized countries, for example the Netherlands, Japan and the United States <see tables 5 and 10>14• Once this is accepted, the question of deciding whether the role of capital should be measured by reference to gross or net capital stocks, how the share of capital in total factor inputs or the coefficients of elasticity of output with respect to capital services should be assessed or how rapidly the capital stock has been made obsoles-cent through the oil price shocks becomes less important. With regard to these matters the OECD analyses published so far provide, as we have said, conflicting evidence.
12
Nordhaus <1980). 13
See Norsworthy, Harper and Kunze <1979), Baily (1981), Kendrick (1981), on the one hand, and Denison (1982), Nordhaus <1982), Maddison <1982), on the other.
14
3 0
-Table 11 : Growth of Capital Stock per Person Employed and of Real Private Investment
(Average annual growth rates in %)
Capital-labour-ratio Real Gross Capital Formation
(excluding housing)
1960-73
F.R. Germany 6.2
France 4.8
Italy ( 5 .1)
United Kingdom 4.2
Netherland 5.8
Japan 10.8
USA 2.3
Source Maddison <1982 a)
1973-80
4.7
4.7 (b) (2.7)
3.4
3.4
6.9
0.7 (c)
(c)
;
i
/
1973-80<a> 1960-73 1973-80
4.1 4.3 2.4
(d)
3.9 6.3 1.5
(e)
2.8 5.5 4.7
2.8 5.5 0.4
(c) (f)
6.3 14.4 2.1
(c)
-0.1 5.3 1.0
(a) Under the assumption that 5% of the 1973 stock has been ren-dered useless by the energy price rise.
(b) 1973-78 (c) 1973-79
d) 1963-73 f) 1965-73
[image:31.582.41.529.153.495.2]3 1
-Another important reason for the slowdown in productivity trends is the recent distinct narrowing of the technological gap between the United States on the one hand and Europe and Japan on the other. As they move clo-ser to the American level of productivity, the European industrialized countries find it more difficult to maintain the more rapid productivity growth of the past, since the risks and costs of process and product
inno-vation increase. Higher R
&
D efforts are required in these conditions andthe growth of investment and capital stock made more difficult. An
interna-tional comparison 15 has shown that the level of productivity in most of
the European countries is approaching that in the United States in the eco-nomy as a whole but that the gap is still large if one takes manufacturing industry alone. In 1960, the United Kingdom had achieved only 60 % and 40 of productivity levels in the United States, at the full economy and in-dust rial level, respectively.
Many other reasons can be advanced in attempting to explain the 16 slowdown in productivity growth but we cannot go into these here
%
Denison has carried out a very detailed analysis of the various factors in-volved and concludes, with respect to the United States, that a "residual" comprising all the changes that cannot be directly measured -and in parti-cular the slowdown in advances in knowledge - accounts for around 70 % of the total decline in labour productivity and remains a mystery. The only
17 possible explanation is perhaps "that everything had gone wrong at once"
However, the general slowdown in productivity growth is more and more frequently being attributed to changes in general socio-political con-ditions, changes which may have reached "critical mass" proportions. Per-sistent inflation is often identified as a major factor in this economic environment. Inflation may, through a deterioration in the allocation of resources and in economic policy reactions, have damaged the propensity to invest and the innovative drive and hence productivity growth. Changes in social, institutional and tax-related environment and the increasing size of the public sector, so it is argued, have in the longer term reduced the efficiency of the private-sector production and growth process in favour of
15
Roy (1982).
16 See,for the European countries, Boyer and Petit (1980, 1981), Wegner
<1980), Maddison (1982).
17 According to Denison <1979, 1982), this residual increased by 1,4 %
3 2
-other priorities (more equity, increased social protection). However, there is no direct evidence for such a hypothesis and it is contradicted by the uniformity of the slowdown in productivity growth in the United States and
Japan, which have very different traditions and behaviourial patterns 18 •
From Denison's failure to explain the residual in the slowdown in productivity growth since 1973, Olson 19 drew the radical conclusion that the deceleration in productivity and the simultaneous emergence of stag-flation have a common cause, namely the rigidities introduced into the eco-nomy by collective interest groups. The widespread network of cartelistic and lobbying organizations and informal collusions developed gradually during the long periods of stability and high growth; they are mainly en-gaged in distributional coalitions seeking redistributions towards their own clients. After a while, this network reduces society's capacity to adopt new technologies and establish barriers to entry that reduce the ca-pacity to reallocate resources quickly in response to changing conditions and ultimately undermine the growth rate. Olson uses-these collective be-haviour patterns to explain the risP. of Japan and Germany after the Second World War, the slow economic growth of Great Britain, the emergence of massive involuntary unemployment and the inability to cope with the supply shocks which occurred in the early 1970s.
Manufacturing industry and export dependence
A number of differences in overall employment and productivity trends as between the United States and the European industrialized coun-tries can also be traced back to differing trends in manufacturing industry. The main differences are (see Table 12).
the proportion of total employment accounted for by manufacturing industry is higher in Europe than in the United States, i.e. some 28% of employment (1980) in the European Community and some 20 % in the United
States;
18 See also Ostry and Koromzay (1982).
I Table 12 Labour productivity in Manufacturing and Export dependence 1960-1981 USA JAPAN EC D F I UK NL 8 OK Manufacturing Average annual changes in % (a)
~mployment Output Output
per hour Unit labour costs (in
u.s.
g) Export dependence (Goods and Services) Sources Manufacturing 1960-73 1.5 3.0 1973-81 0.7 -0.4 1960-73 4.7 13.0 1973-81 2.3 6.5 1960-73 3.0 10.7 1973-81 1.7 6.8 1960-73 1.9 4.9 1973-81 7.7 7.2 Share of exports in 1960 4.9 10.6b) 1973 6.6 10.0 1981 9.2 15.5 US-Bureau of Labor Statistics News USDL-82-197, June 2, 1982 Monthly Labor Review, Dec. 1981 (Capdevielle, Alvarez and Cooper) 0.5-1.7 5.4 1.5 5.8 4.0 4.2 9.9 GOP,
in
19.3 22.7 29.0
Export dependence Eurostat, National Accounts ESA-Aggregates 1960-1981, Luxembourg 1983 0.5 1.2 1.4 -0.5 0.2 0.6 0.2 -1.6 -1.4 0.0 -2.9 -1.8 -1.8 -1.8 5.2 6.6 / •• 8 3.0 6.4 6.5 5.2 1.9 2.3 3.3 -1.7 1.7 1.1 1.8 5.5 6.0 6.9 4.3 7.6 7.0 6.4 4.5 4.6 3.7 2.2 5.1 6.2 4.1 6.1 2.8 5.4 2.6 6.1 4.6 5.0 9.1 9.4 8.1 15.0 8.0 8.6 7.7 current prices and purchasing power parities (c 17.5 13.9 12.1 20.4 37.3 37.4 23., 20.8 17.2 17.0 23.2 47.6 54.4 26.5 28.0 22.2 24.7 26.1 56.8 67.1 32.8 (a) Rates of change computed from the least squares trend of the logarithms of the index numbers. (b) 1965 (c) 1967
3 4
-the slowdown in -the growth of manufacturing output has been sharper in Europe than in Japan or the United States since 1973, as compared with 1960-73; however, the decline in manufacturing was as a rule more marked everywhere than the general slowdown in growth;
in most of the Community countries (and also in Japan), the statisti-cally recorded growth rate of productivity per man-hour has declined much less sharply, as compared with the 1960s, than in the United States, where it has fallen by an average of almost two thirds; as a result, productivity per man-hour in the period 1973-81 increased in the European Community more than twice as fast as in the United States;
in the Community countries, the numbers employed in manufacturing industry declined significantly from 1973 to 1981 <except in Italy), while in the United States they increased slightly.
There are a number of signs to suggest that the declining and threat-ened competitiveness of European industry in the 1970s was defended largely by a marked shedding of labour which can explain partly the continuing high level of productivity. At the same time, considerable use was made of cuts
20 in working hours in Europe, once again in contrast with the United States
The need for self-defence in the form of continued high, albeit somewhat slower, productivity growth in manufacturing industry is closely related to the considerably higher export dependence of the European in-dustrialized countries compared with the United States and also Japan. The share of exports (goods and services) has risen in all the European coun-tries except the Netherlands, picking up speed since 1973; in the United States, the increase in the share of exports has been distinctly slower
<see Table 12).
20
3 5
-IV REAL WAGES, ADJUSTMENT PROBLEMS AND EMPLOYMENT
The economies of the European Community are much more strongly in-tegrated within the international competitive system than the United States and Japan. Because of the need to maintain competitiveness and because of the impact of restrictive anti-inflationary policies, the apparent produc-tivity growth per man-hour in manufacturing has therefore declined only slightly in Europe as compared with the United States and Japan. There are doubts if and how far the continuing high Level of productivity growth in the exposed sectors in Europe since 1973 has been achieved by means of more rapid technical progress and an accelerated increase in the capital-Labour ratio. In any case, the Large-scale shedding of Labour was important. The numbers employed in manufacturing industry in the Community have declined by 1,7 % annually since 1973, and the number of weekly working hours per person employed has fallen by almost 1 % annually. What are the factors be-hind this dramatic Labour shedding process since 1973?
Real wages and employment
The argument frequently put forward in the academic and political debate is that the Lack of employment opportunities and the sharp and per-sistent rise in unemployment are essentially the result of real wages being too high, making it unprofitable for firms to absorb all of the Labour force potential. The explanation of this "classical" unemployment (as op-posed to cyclical, "Keynesian" unemployment caused by a deficiency of ag-gregate effective demand) starts from the tenet of neo-classical theory, based on a partial analysis, that Labour demand is a declining function of real Labour costs. If the real wage rate rises above the point of equili-brium <where the supply and demand curves meet), demand for Labour will be reduced. In the Longer term, because of the change in factor price rela-tionships, capital is increasingly substituted for labour. At the same time, sharp increases in real wages in excess of productivity growth depress the profitability and earnings of firms, thus reducing incentives to invest in the extension of production capacities.
3 6
-slowdown in productivity growth on the one hand and the new regime of floating exchange rates and the changes in economic policy on the other. Since 1973, particularly in the United States and most of the European countries, differences in the degree of flexibility of real wages have emerged, and these have been coupled with differences in employment trends •. It is generally agreed that, in the United States, the adjustment of nomi-nal wages was sluggish, as a result of three-year wage agreements, and that consequently real wages 21 rose only a little or actually fell because of the faster rise in inflation. In Europe, by contrast, nominal wages acce-lerated with inflation, and real wages therefore continued to rise despite the supply shocks and the decline in productivity growth. The factors be-hind this were the spread of labour-market regulation and of indexation mechanisms, underestimation of the repercussions and uncertainties caused by the oil shock and the sharp fluctuations in exchange rates, and the dif-fering role of the unions and of incomes policies in the wage formation process. Although real wages adjusted better to the changes in the general environment after the second oil price shock in 1979-81 (e.g. in Germany, the Netherlands and the United Kingdom), they often continued to rise faster than labour productivity.
It has become standard practice to take as the yardstick for wage adjustment the gap between the rise in the real product wage and the growth of labour productivity. This "real labour cost gap" (real wage gap) has recently often been seen as a measure of the disequilibrium in the labour market. The real labour cost gap shows the deviation of the rise 1n real wages from the rate that would have left the wage share
u~changed with reference to a base period. In tables 13 and 14, the real
l~bour cost gap (taking 1972 as the base year) is compared with the trend of employment.
The United States did not, either in the 1960s or in the 1970s, have any sustained real per capita wage increases that were significantly in excess of the low rate of productivity growth adjusted for changes in the terms of trade. Real wages followed the pronounced cyclical fluctuations
21
3 7
-Table 13 Employment, Labour Productivity and Real Wages 1960-1983
(Average annual changesin%- Whole economy)
USA Japan EEC-10
Employment 1960-73 2.0 1.2 0.2
1973-81 1.9 0.9 -0.1
1973-75 -0.1 -0.3 -0.4
1975-79 3.5 1.4 0.4
1979-81 0.8 0.9 -0.8
1981-83 -0.3 1.3 -1.3
(a)
Labour productivity 1960-73 2.0 9.1 4.4
(per person employed)
1973-81 0.2 2.7 2.0
1973-75 -0.7 0.9 0.7
1975-79 0.8 3.7 3.1
1979-81 0.1 2.7 1.2
1981-83 0.3 1.8 1.7
(b)
Real product wage 1960-73 2.0 8.2 4.4
(per wage and salary earner)
1973-81 0.3 4.2 2.4
1973-75 -0.8 6.1 3.6
1975-79 1 .1 3.4 2.0
1979-81
-o.
1 3.6 2.11981-83 0.2 3.1 0.4
Real wage gap (C) 1975 99.8 112.7 106.8
(Indices 1972
=
100) 1979 100.8 111.3 102.61981 100.6 113.1 104.4
1983 100.7 116.2 101.8
Sources: Services of the Commission; Eurostat; 1982 and 1983, estimates (a)Real GOP (prices 1975) per person employed
(b)Compensation of employees deflated by the implicit price deflator of GOP (c)Real wage gap : Compensation per wage and salary earner deflated by
[image:38.579.50.510.157.619.2]3 8
-in productivity, but were flat tak-ing the period 1973-81 as a whole. Neither in the 1960s nor since 1973 has any real wage gap developed. The numbers in employment rose sharply, by a cumulative total of 18% from 1973 to 1981.
In Japan, real wage growth in the 1960s was over a long period be-low the high rate of productivity growth, producing a rapid improvement in the profit ratio up to 1969. It was not until the first oil price shock that
Labour costs began to accelerate, especially in manufacturing industry,where the fall-off in productivity growth was very pronounced. Since then, a wide gap has opened up between the rise in real wages and productivity growth, though this was corrected to some extent after 1976, particularly after the second oil price shock. However, the low level of the wage share obtaining in the early 1970s was not restored. Despite this relatively wide real La-bour cost gap, employment problems have not emerged in Japan. The pronounced flexibility of wages and the unusually fast growth of productivity in cer-tain sectors have, admittedly, benefited exports and the employment situa-tion in the service industries. The wage share in manufacturing remained significantly lower than in the United States and the Community; total hourly Labour costs expressed in dollars are still well below the labour costs of Japan's main competitors, the United States and Europe 22 •
After a fairly long period of stable wage shares in the 1960s and a rise beginning at the end of the 1960s, real wages in most of the European countries increased further in the period 1972-75, outstripping productivity growth. The real labour cost gap which developed during that period
general-ly narrowed after 1975, but widened again after the second oil price shock, as productivity increases slowed down further and the terms of trade dete-riorated once again. Only a few Community countries (United Kingdom, Fede-ral Republic of Germany, Netherlands and Denmark) managed to secure an ad-justment of real wage trends to the changed circumstances. In a number of countries the adjustment was still hesitant by 1981 or had not occurred at all (Italy, Belgium, Ireland and France).
22
Economic Policy Committee,"Real Labour Costs, Profitability and
Table 14 Real Wages and Labour Costs in the Member States of the EC 1973-83 <Average annual changes in % -Whole economy) D F I Employment 1973-81 -0.4 0.1 0.8 1973-75 -2.1 0.2 0.8 1975-79 0.2 0.5 0.8 1979-81 0.1 -0.3 0.7 1981-83 -1.7 -0.9 -0.2 Labour productivity (a) 1973-81 2.5 2.3 1.7 (per person employed) 1973-75 1.6 1.9 -0.6 1975-79 3.7 3.2 3.0 1979-81 1.0 1 .1 1.2 1981-83 1 .5 1.4 0.1 Real product wag€:' 1973-81 2.4 3.5 2.4 (per wage and salary earner) 1973-75 2.9 5.2 3.0 1975-79 2.5 3.1 2.0 1979-81 1 .8 2.6 2.5 1981-83 -0.3 0.6 -o.5 Real wage gap (c) 1975 104.4 107.8 108.3 <Indices 1972 = 100) 1979 99.6 107.6 104.t 1981 101 .1 111.1 106.8 1983 97.4 109.8 105.7 Sources : Services of the Commission; Eurostat; 1982 and 1983, estimates (a) Real GDP <1975 prices) per person employed UK
-0.8 -0.1 0.1 -3.4 -2.1 1.4 -0.8 2.4 1
.5
4.1 1.2 3.3 0.1 1.6 2.1
108.6 99.1 99.5 95.6
(b) Compensation of employees deflated by the implicit price index deflator of GDP (c) See Table 13 footnote (c) NL 8 0.1 -0.2 -0.3
o.o
0.5 0.1 -0.4 -1.1 -1.9 -1.9 1.7 2.1 1.5 1.2 2.6 2.8 0.3 1.7 1.0 1 .5 1.6 3.7 3.9 4.5 1.8 3.6 -1.0 3.2 0.1 -1.0 105.3 107.7 102.,5 111.0 99.6 114.1 97.8 108.3EC-10 -0.1 -0.4 0.4 -0.8 -1.3 2.0 0.7 3.1 1
.2
1.7 2.4 3.6 2.0 2.1 0.4
-~- I
A Large number of econometric analyses carried out over the Last forty years have attempted to establish and quantify the Link between real wages and Labour demand. Most of these are confined to national economies and are based either on individual Labour demand equations or on overall models. More recently, several comparative analyses covering the OECD
coun-tries have been published 2
~
Some found that there was no Link whatsoever24•The conclusions reached in most of the studies are not conclusive, and the only point on which there is in fact agreement is that, as a result of the supply shock after 1973, a real wage problem developed and that this con-tributed to the deterioration of the employment situation. Estimates of the contributory role of the real wage factor vary widely. Some estimates of real wage elasticity with respect to demand for employment indicate values of between -0.1 and -2; however, most of the results are in the range be-tween -0.3 and -0.5, suggesting that employment would in the Longer term
increase by 0,5 %, if (other things being equal) real wages fell by 1 %.
With such relatively Low elasticities, a reduction in real wages of some
10 % would be necessary in order to increase employment by 5 % <which would
not necessarily result in an equivalent fall in unemployment).
Real wages, inflation and adjustment problems
The comparative analyses carried out by the OECD Secretariat and by the services of the Commission of the European Communities throw up no clear empirical conclusion on the Link between real wage costs and employ-ment, certainly not for the period after 1973. It was not possible to demonstrate with any certainty, and as a generally valid finding, the ex-tent to which the real Labour cost problem is the main cause of unemploy-ment. The various definitions of the "real labour cost gap" result in quite
Large empirical differences in the identification and ranking of the
"pro-blem countries" 2~ as the findings of the OECD, the Commission of the
European Communities and the German Council of Economic Advisers show. The major handicap in using the Link between the real Labour cost gap and
23 OECD <1982); Grubb, Layard, Symons (1982 a), Sachs (1979), Branson and Rotemberg <1980), Bruno and Sachs (1981).
24 Geary and Kennan (1982).
25 Earlier OECD analyses revealed no real Labour cost gap in Italy, while in Economic Outlook no. 32 of December 1982, itis Less than that
4 1
-employment lies elsewhere, namely in the fact that it is not a sufficient
indicator to explain the trend of employment. The real per capita product
wage and the apparent average productivity do not follow trends that are
independent of each other. In very open national economies, a rapid rise
in real wages often forces companies to cut their workforces rapidly, since
those exposed to competition have to shut down unprofitable capacity or to
close down m~rginal establishments, as can be seen from the example of the
Unjted Kingdom or the Netherlands. The resultant rise in labour
productivi-ty may leave the real labour cost gap unchanged, even though the high real
wage level has created a massive deterioration in employment, particularly
in manufacturing.
Interpreting the real wage gap as an indicator of the "pricing out
of work" phenomenon raises a similar problem when a comparison is made
be-tween the United States and the Federal Republic of Germany. The United
States and the Federal Republic of Germany have broadly similar positive
trends in the real labour cost gap. However, with similar real growth rates
for 1973-80 <2,4 % a year>, the trends of employment were entirely different,
rising in the United States and declining (particularly in manufacturing)
in the Federal Republic of Germany. These differences are probably partly
attributable to the persistent undervaluation of the OM in the 1960s, which
resulted in an expansion of the export-dependent, industrial sector 26 ;
then, in the 1970s, the positive effects of wage adjustment were
oversha-dowed by the appreciation of the OM.
Lastly, the influence of real wages on employment also depends on
the inflation rate and on the intensity of the anti-inflationary policy
pursued. The real wage problems which have arisen in Europe since 1973 are
largely the result of inadequate adjustment to unforeseen increases in raw
material prices (i.e. deteriorations in the terms of trade amounting to some
10% in each of the two periods 1973-74 and 1979-80) and, an even more
deci-sive factor, to the sharp slackening in productivity growth amounting to
some 2- 2 1/2% annually <see Table10), equivalent to a real wage loss of
some 16- 20% over that eight-year period alone. Thus, because we realized
too late that the period of growth had come to an end, we have "drifted"
26 I nst1tut ur We tw1rtschaft (1980), Strukturbericht; a contrary . f.. l '