Adherence to the Mediterranean
dietary pattern and BMI change
among U.S. adolescents
The Harvard community has made this
article openly available.
Please share
how
this access benefits you. Your story matters
Citation
Martin-Calvo, Nerea, Jorge E. Chavarro, Jennifer Falbe, Frank B.
Hu, and Alison E. Field. 2016. “Adherence to the Mediterranean
dietary pattern and BMI change among U.S. adolescents.”
International journal of obesity (2005) 40 (7): 1103-1108. doi:10.1038/
ijo.2016.59. http://dx.doi.org/10.1038/ijo.2016.59.
Published Version
doi:10.1038/ijo.2016.59
Citable link
http://nrs.harvard.edu/urn-3:HUL.InstRepos:29408436
Terms of Use
This article was downloaded from Harvard University’s DASH
repository, and is made available under the terms and conditions
applicable to Other Posted Material, as set forth at http://
Adherence to the Mediterranean dietary pattern and BMI change
among U.S. adolescents
Nerea Martin-Calvo1,2, Jorge E. Chavarro3,4, Jennifer Falbe5, Frank B. Hu3,4, and Alison E.
Field4,6,7,8
1Department of Preventive Medicine and Public Health, University of Navarra. IdiSNA (Instituto de
Investigación Sanitaria de Navarra), Spain
2Centro de Investigación Biomédica en Red de Fisiopatología de la Obesidad y Nutrición
(CIBEROBN), Institute of Health Carlos III, Madrid, Spain
3Department of Nutrition, Harvard T.H. Chan School of Public Health, Boston, MA
4Channing Division of Network Medicine, Department of Medicine, Brigham and Women’s
Hospital and Harvard Medical School
5Division of Community Health and Human Development, University of California, Berkeley
6Division of Adolescent Medicine, Boston Children’s Hospital and Harvard Medical School
7Department of Epidemiology, Harvard T.H. Chan School of Public Health, Boston, MA
8Department of Epidemiology, Brown University School of Public Health
Abstract
Background—Among adults, the Mediterranean dietary pattern (MDP) is inversely related to body mass index (BMI). Data are lacking on adherence to the MDP among youth in the United States and whether the MDP is related to weight change in that group.
Objective—To assess whether adherence to the MDP was associated with BMI change among adolescents. To examine temporality we studied the association between baseline and 2–3 year changes in adherence to the MDP with concurrent changes in BMI, as well as subsequent changes in BMI over a 7-year period.
Methods—We prospectively followed 6 002 females and 4 916 males in the Growing Up Today Study 2, aged 8–15 in 2004, living across the United States. Data were collected by
Users may view, print, copy, and download text and data-mine the content in such documents, for the purposes of academic research, subject always to the full Conditions of use: http://www.nature.com/authors/editorial_policies/license.html#terms
Corresponding author: Alison E. Field, ScD, Mail address: Department of Epidemiology, Brown University School of Public Health, 121 S. Main Street, Providence, RI 02912, Telephone number: (401) 863-5715, Alison_Field@brown.edu.
Conflicts of interest: The authors have no conflicts of interest to declare.
Author’s contribution: N.M-C., J.E.C. and A.E.F. designed the research and developed the statistical methods; J.E.C. and J.F. assisted with the statistical analysis. N.M-C. performed statistical analysis and drafted the paper; J.E.C., J.F., F.B.H., and A.E.F. provided critical feedback on drafts of the manuscript. A.E.F. had primary responsibility for final content. All authors read and approved the final manuscript.
HHS Public Access
Author manuscript
Int J Obes (Lond)
. Author manuscript; available in PMC 2016 October 22.Published in final edited form as:
Int J Obes (Lond). 2016 July ; 40(7): 1103–1108. doi:10.1038/ijo.2016.59.
A
uthor Man
uscr
ipt
A
uthor Man
uscr
ipt
A
uthor Man
uscr
ipt
A
uthor Man
uscr
questionnaire in 2004, 2006, 2008, and 2011. Dietary intake was assessed by the Youth/
Adolescent Questionnaire. The KidMed Index was derived to measure the adherence to the MDP. We used generalized estimating equations with repeated measures within subjects to assess the association between MDP and BMI change.
Results—A two-point increment in the KidMed Index was independently associated with a lower gain in BMI (−0.04 kg/m2; p=0.001). A greater increase in adherence to the KidMed Index was independently related to a lower gain in BMI in both the concurrent (p-for-trend<0.001) and the subsequent period (p-for-trend=0.002).
Conclusions—Adherence to MDP was inversely associated with change in BMI among adolescents. 2-year improvement in adherence to MDP was independently associated with less steep gain in the BMI in both the concurrent and the subsequent period.
Introduction
The Seven Country Study, conducted in the 1950s by Ancel Keys, described the foods and beverages frequently consumed in the Mediterranean area(1). The Mediterranean dietary pattern (MDP) identified in that study, was characterized as a dietary pattern rich in plant-based foods (vegetables, fruits, cereals, legumes, nuts, seeds and olives), moderate to high intake of fish and seafood, moderate consumption of eggs, poultry and dairy products (preferably yogurt and cheese), low consumption of red meat, and a moderate intake of alcohol (preferably wine during meals). In addition, olive oil was the main source of added fat (2).
In 2010, experts, led by the Mediterranean Diet Foundation and the Forum on Mediterranean Food Cultures, developed a consensus position on a new revised MDP pyramid for adult populations(3). The new pyramid was similar to the previous dietary pattern, but it also incorporated social and cultural elements, such as regular physical activity, adequate rest and conviviality, characteristic of the Mediterranean way of life.
Studies in adult populations have consistently found that the MDP and its components are inversely associated with cardiovascular risk factors or cardiovascular disease (4,5), metabolic syndrome (6), obesity (7,8), type 2 diabetes (9), some types of cancer (10), and even global mortality (11,12). Less is known about adherence to the MDP and how it relates to health among children and adolescents. Some aspects of the MDP are not applicable to children, such as regular consumption of alcohol. The EnKid study in Spain developed the KidMed index to measures the adherence to the MDP among children and adolescents (13,14). Recently published cross-sectional studies have used the KidMed index to describe the adherence of European adolescents to the MDP and also presented correlations of the KidMed index with some socioeconomic, demographic or lifestyle factors (15,16). Other cross-sectional studies using the KidMed index have suggested an inverse association of the MDP with obesity or metabolic syndrome criteria (17,18), as well as a direct association between the MDP and life quality score (19,20) in European children and adolescents.
Data are lacking on adherence to the MDP among American youths and on its relation with weight status and weight gain among children or adolescents in the United States. Moreover,
A
uthor Man
uscr
ipt
A
uthor Man
uscr
ipt
A
uthor Man
uscr
ipt
A
uthor Man
uscr
longitudinal studies in children and adolescents are needed to examine the beneficial effect of the MDP on weight change in these populations.
The aim of this study was to assess the association of baseline adherence to the MDP with 2–3 year change in body mass index (BMI) among adolescents. Secondly, we aimed to study the association of 2–3 year changes in adherence to the MDP with changes in BMI in both the same and the subsequent 2–3 year period over a 7-year follow-up.
Subjects and Methods
Sample for analysis
The ongoing Growing Up Today Study (GUTS) II cohort was established in 2004 to assess relations of diet and activity to height velocity and weight gain. Participants were recruited by sending letters to 20 700 women in the Nurses’ Health Study II who had children aged 8– 15 years. The letter explained the purpose of the study and asked the nurse for permission to invite her child(ren) to participate. Invitation letters and questionnaires were mailed to 8 826 girls and 8 454 boys whose mothers granted consent. A total of 6 002 girls and 4 916 boys returned completed questionnaires, thereby assenting to participate. Follow-up
questionnaires were sent in the fall of 2006 and 2008 and winter 2011.
Outcome
Weight and height were self-reported on each questionnaire. BMI (Kg/m2) was calculated using self-reported weight and height, which has been found to be valid among
preadolescents and adolescents (21–23). The outcome in the analyses was change in BMI during each time period (i.e., 2004–2006, 2006–2008, and 2008–2011), which was calculated as the difference in BMI between the end and the beginning of the time interval. A previous study found that although adolescents and young adults consistently under-reported their weight, because their underreporting was consistent over time, weight change, calculated from self-reported weight, is accurate (24).
Exposure
The primary exposure was adherence to the MDP. The KidMed Index (13), was developed to measure adherence to the MDP among children and youths. This index consists of 16 domains, 12 positive (+1 point vs. 0 points) and 4 negative (−1 point vs. 0 points). Based on their score, participants were classified as having: “very low quality dietary pattern” (from −4 to 3 points), “need to improve to adhere better to the MDP” (from 4 to 7 points) or “optimal MDP” (from 8 to 12 points) (14).
Dietary intake was assessed by The Youth/Adolescent Questionnaire (25) in each wave of GUTS 2. We modified the KidMed Index (m-KM) (Table 1) to make it more appropriate for an American population. The primary modification was establishing an upper limit in those domains in which a high intake has been associated with weight gain (i.e., refined grains). In addition, because many cereals in the United States are high in sugar and low in whole grains, the cereal criterion was modified to be “servings of cereal with less than 10g of sugar”.
A
uthor Man
uscr
ipt
A
uthor Man
uscr
ipt
A
uthor Man
uscr
ipt
A
uthor Man
uscr
Covariates
Both physical activity and sedentary behavior have been associated with weight change and other health indicators in children and adolescents(26,27). In each questionnaire, participants were asked to recall the hours per week within each season they engaged over the past year in 18 specific activities. From that information, we calculated the metabolic equivalent (METs-hours) per week each participant spent in physical activities(28). The MET expresses the energy cost of physical activities as a multiple of the resting metabolic rate(29).
Sedentary behavior was calculated as the sum of the hours per week participants spent over the past year watching television, using the computer, surfing on the net and reading/doing homework. The dietary information, time spent in physical activities and sedentary behavior were assessed at the beginning of each time interval.
Total energy intake has been suggested as one, but not the only, determinant of change in BMI. Therefore, we conducted secondary analyses (model 2) in which we additionally adjusting for total energy intake.
Ethics
The study was approved by the Human Subjects Committee at Brigham and Women’s Hospital, and the analyses presented in this article were approved by the institutional review boards at Brigham and Women’s Hospital.
Statistical analysis
We used several approaches to investigate the association between the m-KM score and BMI change. Our primary analysis examined associations of baseline quartiles of the m-KM score in each time period with change in BMI (e.g., 2004 m-KM and 2004–2006 change in BMI). The lowest quartile of m-KM was the reference group. Additionally, we examined
associations using continuous baseline m-KM score.
We also examined (1) the association of quartiles of 2–3 year change in m-KM score with concurrent 2–3 year change in BMI (e.g., 2004–2006 change in both m-KM and BMI) and (2) association of quartiles of 2–3 year change in m-KM score with subsequent 2–3 year change in BMI (e.g., 2004–2006 change in m-KM and 2006–2008 change in BMI). These time varying analyses used 7-years of follow up data.
The analysis assessing baseline m-KM score as a predictor of change in BMI was adjusted for baseline age, sex, BMI at the beginning of the period, physical activity, sedentary time and time of follow-up. The models examining the association between change in m-KM score and change in BMI were also adjusted for baseline m-KM score at the beginning of the period. Finally, the model assessing the association between change in m-KM score and subsequent change in BMI was also adjusted for change in BMI in the previous time interval. A possible interaction between baseline m-KM and change in m-KM score was also studied. In the Model 2 we additionally adjusted the analysis for quintiles of total energy intake.
In a sensitive analysis we examined whether there were interactions between adherence to the m-KM index at baseline and age, sex, weight status, physical activity, and sedentary
A
uthor Man
uscr
ipt
A
uthor Man
uscr
ipt
A
uthor Man
uscr
ipt
A
uthor Man
uscr
time. We also evaluated the relative importance of each domain in the m-KM by subtracting alternatively one domain at a time (or two when necessary) and calculating the association of baseline adherence to the m-KM minus one domain (or two when necessary) with change in BMI over the next 2–3 years. To preserve the comparability, we multiplied the β
coefficients obtained in these analyses by 15/16 (or 14/16 when two domains had been subtracted). (30)
Analyses were conducted with SAS software (version 9.3 SAS Institute, Cary, NC, USA). As the analyses were based on changes in BMI between two consecutive periods, only participants with data from two consecutive questionnaires were eligible for analysis. Thus it was a complete case analysis. In all the analyses we used generalized estimating equation with repeated measures within subjects (2004, 2006, 2008 and 2011) and clustering among siblings.
Results
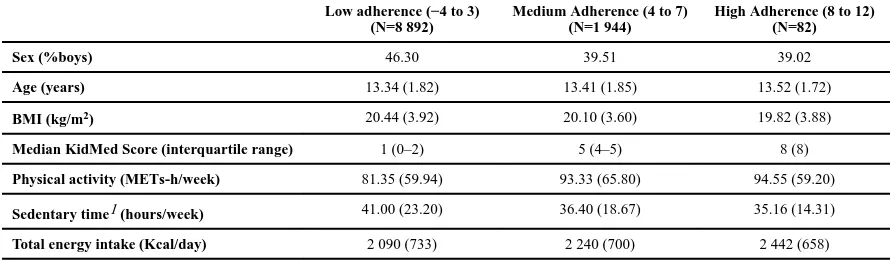
At baseline 81.4% of the sample were classified as poorly adherent to the m-KM index (median=1 point), 17.8% as moderately adherent (median=5 points), and 0.75% as highly adherent (median=8 points) (Table 2). We found a higher percentage of boys within the lowest category (46.3%) compared to the moderate (39.51%) and the high category (39.02%) of adherence to the m-KM index. At baseline, participants in the category of poorly adherent to the m-KM index had a higher BMI (mean=20.4 kg/m2), exhibited a more sedentary behavior (mean=41 hours/week), and engaged in less physical activity
(mean=81.35 METs-h/week) than those in the moderate category (20.1 kg/m2, 36.40 hours/ week and 93.33 METs-h/week, respectively) or in the high category (19.8 kg/m2, 35.16 hours/week and 94.55 METs-h/week, respectively). We found that youth in the category of high adherence to the MDP reported a higher energy intake (2 442 kcal/day) compared to their peers in the moderate and the poor adherence categories (2 240 and 2 090 kcal/day respectively).
When the m-KM score was modeled as a continuous variable, a two-point increase in baseline adherence was associated with a significant relative decrease in BMI over the next 2–3 years (β= −0.04, 95% Confidence Interval (CI) −0.07 to −0.02). The same results were found when total energy intake was considered a potential confounder. This association remained the same for the majority of times when we alternatively subtracted one domain (or two when necessary) from the m-KM score.
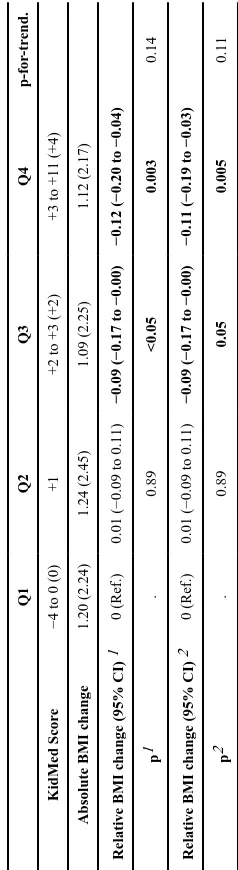
When m-KM score was categorized in quartiles (Table 3) we found that, compared to the lowest level (Q1) of adherence to the MDP, youth in the third (Q3) and fourth (Q4) quartiles (m-KM score median +2 and +4 respectively), exhibited significantly smaller gains in BMI over the next 2–3 years (β= −0.09, 95%CI −0.17 to −0.00 and β = −0.12, 95%CI −0.20 to −0.04 respectively), independent of sex, age, BMI at baseline, physical activity, sedentary time and time of follow-up. No significant linear trend was found. Similar results were found when we additionally adjusted for total energy intake.
A
uthor Man
uscr
ipt
A
uthor Man
uscr
ipt
A
uthor Man
uscr
ipt
A
uthor Man
uscr
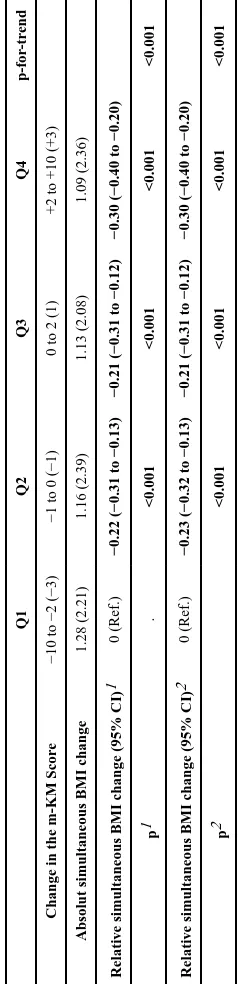
In further analyses, we examined a 2–3 year change in m-KM score as a predictor of 2–3 years change in BMI over the 7 years of follow-up. First, using models adjusted for sex, age, physical activity, sedentary time, time of follow-up and both BMI and m-KM score at baseline, we assessed the association between 2–3 year change in the m-KM score and concurrent change in BMI (Table 4). Compared to youth in the Q1 of m-KM score change (scores change from −10 to −2), we found that adolescents in Q2 (scores change from −1 to 0), Q3 (scores change +1) and Q4 (scores change from +2 to +10), had significantly smaller concurrent gains in BMI (β= −0.22 kg/m2, 95%CI −0.31 to −0.13; β= −0.21 kg/m2, 95%CI −0.31 to −0.12; and β= −0.30 kg/m2, 95%CI −0.40 to −0.20, respectively). The p-for-trend across the quartiles was highly significant (p<0.001). Very similar results were found when we additionally adjusted for total energy intake. The association was not modified by m-KM score at baseline (p for interaction=0.21 in the model adjusted for total energy intake).
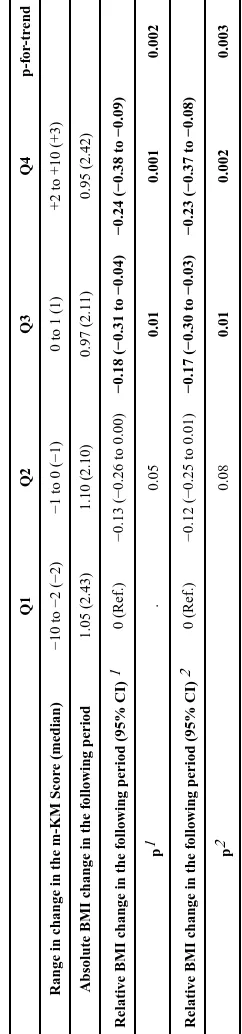
In addition, we assessed the association between 2–3 year change in the m-KM score and change in BMI in the subsequent 2–3 year period using models adjusted for sex, age, physical activity, sedentary time, time of follow-up, baseline m-KM score, and change in BMI in the previous time interval (Table 5). Compared to youth in the first quartile (Q1) of m-KM score change (scores change from −10 to −2), we found that adolescents in Q3 (scores change from 0 to +1) and Q4 (scores change from +2 to +10), had smaller gains in BMI (β= −0.18 kg/m2, 95%CI −0.31 to −0.04; β= −0.24 kg/m2, 95%CI −0.38 to −0.09; respectively) (p-for-trend=0.002). Very similar results were found when we additionally adjusted for total energy intake. The association was not modified by m-KM score at baseline (p for interaction=0.14 in the model adjusted for total energy intake).
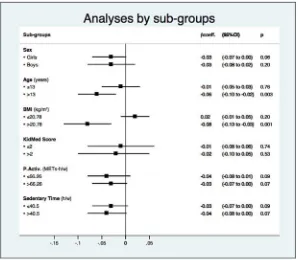
In a sensitive analysis (Figure 1) we found that a two-point increase in the baseline
adherence to the m-KM index had a stronger association with changes in BMI over the next 2–3 years among youth above the BMI median than their leaner peers
(p-for-interaction=0.01). No other significant interactions were found in the analyses examining possibly differences by gender, age, or level of physical activity or sedentary time.
Discussion
We found that compared to a sample of Spanish children and adolescents, relatively few youth in this prospective study of children and adolescents in the United States strongly adhered to the MDP (14). However, similarly to the Spanish study, we found that
adolescents who adhered to the MDP or increased their adherence had smaller BMI gains than their peers. Although the clinical relevance of the association we found may seem small, our results are consistent with those reported by previous cross-sectional studies in European children and adolescents that suggested an inverse association of the adherence to the MDP with waist circumference, waist-to-height ratio (17), and BMI (31). A recently published clinical trial among youth in Mexico found that obese children and adolescent randomly assigned to the MDP showed an improvement in BMI compared to those assigned to a standard diet after a 16-week intervention (32), but we are unaware of any other longitudinal studies of MDP in youth. Thus, our study is the first prospective study with a long follow-up period assessing the association between the adherence to the MDP and BMI change among adolescents.
A
uthor Man
uscr
ipt
A
uthor Man
uscr
ipt
A
uthor Man
uscr
ipt
A
uthor Man
uscr
Our observation that increases in adherence to the MDP were associated with smaller BMI gains might be analogous to the findings from a 2-year trial which randomly assigned moderately obese adults to a MDP, low-carbohydrate, or low fat diet group and found that both the MDP and low carbohydrate diet groups had significantly greater weight losses than those assigned to the low-fat diet group (7).
Not only did we observe an inverse association between 2–3 year change in adherence to the MDP and simultaneous 2–3 year change in BMI, but also we found an inverse association with BMI change in the subsequent 2–3 year period. Our results suggested that promoting the MDP might be a pragmatic tool to prevent excessive weight gain among adolescents.
Higher energy intake is suggested to be the principal determinant of weight gain. However, after having adjusted our analyses for total energy intake, our results suggest that other mechanisms may be also involved. Energy balance may be a better explanation for changes in BMI than total energy intake. In our study we found that youth in the highest category of adherence to the MDP reported higher total energy intake than their peers in the categories of medium and low adherence to the MDP, but they also reported lower sedentary time and higher physical activity, which may lead to a greater total energy expenditure. Besides, some studies suggest that macronutrient composition of diet can affect energy expenditure (33) and that the quality of some nutrients (especially fats and carbohydrates), and not only their quantity, should be considered when assessing the effect of any dietary pattern on heath status (34). Our observation that the m-KM score had a stronger association with BMI change among heavier youth suggests that the MDP may be considered as a useful dietary recommendation for overweight and obese adolescents.
It is important to acknowledge that there are some limitations to our study. The Youth/ Adolescent Questionnaire has been validated and the observed correlations are similar to those observed in validation studies of food frequency questionnaires among adults (25), however, it was not specifically designed to measure the KidMed Index, which made it difficult to directly assess some of the domains. In order to make the index appropriate for studying youth in the United States, we modified some domains of the original KidMed index and created the m-KM index, which, as of today, has not been formally validated. Our results suggest that the relative importance of each individual domain may be small since the association of two-point increase in baseline adherence to the m-KM index and change in BMI over the next 2–3 years was similar regardless of which 1–2 domains we subtracted from the index. Besides, the GUTS 2 participants are predominantly white children of nurses, which potentially limits generalizability of the results to non-white children and adolescents. In addition, data were self-reported. Although adolescents and young adults are known to underreport their weight, they are consistent in under-reporting, thus the weight change based on serial self-reports of weight and height has been found to be very accurate (24). Finally, although we have adjusted for potential confounding factors, since this is an observational study, we cannot completely rule out the possible existence of residual confounding.
Despite these limitations, this study has numerous strengths, including a large sample, the longitudinal design and the use of repeated measures. Moreover, in contrast to several
A
uthor Man
uscr
ipt
A
uthor Man
uscr
ipt
A
uthor Man
uscr
ipt
A
uthor Man
uscr
studies in adult populations that have used sample-median based indexes, the score in the m-KM index is built according to absolute cut-off points, making it possible the comparability between different samples. Moreover, the results were robust even after having adjusted for energy intake, and did not differ when assessing association with concurrent or subsequent BMI change.
Conclusion
We prospectively analyzed eating habits and other life-style factors in children and
adolescents in the GUTS 2 cohort in order to assess the association of adherence to the MDP and 2-y change in BMI over a 7-y of follow-up. We found that, according to the m-KM index, relatively few participants in this study strongly adhered to the MDP. Nevertheless, our results suggest that, independently of other factors, a higher adherence to the MDP was associated with smaller gains in BMI among children and adolescents. Moreover, 2–3 year change in the m-KM score was independently associated with 2–3 year changes in BMI in both the concurrent and subsequent 2–3 year period. The results remained significant when analyses were additionally adjusted for total energy intake.
Supplementary Material
Refer to Web version on PubMed Central for supplementary material.
Acknowledgments
The authors would like to thank the thousands of participants in the Growing Up Today Study II and their mothers. Sources of Support: The Growing up Today Study II is supported by the Breast Cancer Research Foundation and the grants R01-DK084001 and R01-HL096905 from the National Institute of Health.
Abbreviations
MDP Mediterranean dietary pattern
BMI Body mass index
GUTS 2 Growing Up Today Study 2
m-KM modified KidMed Index
MET Metabolic equivalent
Q1 First quartile
Q2 Second quartile
Q3 Third quartile
Q4 Fourth quartile
A
uthor Man
uscr
ipt
A
uthor Man
uscr
ipt
A
uthor Man
uscr
ipt
A
uthor Man
uscr
References
1. Kromhout D, Keys A, Aravanis C, Buzina R, Fidanza F, Giampaoli S, et al. Food consumption patterns in the 1960s in seven countries. Am J Clin Nutr. 1989; 49:889–94. [PubMed: 2718924] 2. Bach-Faig A, Berry EM, Lairon D, Reguant J, Trichopoulou A, Dernini S, et al. Mediterranean diet
pyramid today. Science and cultural updates. Public Health Nutr. 2011; 14:2274–84. [PubMed: 22166184]
3. Fundación Dieta Mediterránea. [Accessed 11/30, 2014] Pirámide de la diéta mediterránea: un estilo de vida actual. Guía para la población adulta. 2010. Available at: http://dietamediterranea.com/ piramide-dietamediterranea/
4. Estruch R, Ros E, Salas-Salvado J, Covas M, Corella D, Aros F, et al. Primary prevention of cardiovascular disease with a Mediterranean diet. N Engl J Med. 2013; 368:1279–90. [PubMed: 23432189]
5. Nordmann AJ, Suter-Zimmermann K, Bucher HC, Shai I, Tuttle KR, Estruch R, et al. Meta-analysis comparing Mediterranean to low-fat diets for modification of cardiovascular risk factors. Am J Med. 2011; 124:841–51. e2. [PubMed: 21854893]
6. Kastorini CM, Milionis HJ, Esposito K, Giugliano D, Goudevenos JA, Panagiotakos DB. The effect of Mediterranean diet on metabolic syndrome and its components: a meta-analysis of 50 studies and 534,906 individuals. J Am Coll Cardiol. 2011; 57:1299–1313. [PubMed: 21392646]
7. Moller K, Krogh-Madsen R. Weight loss with a low-carbohydrate, Mediterranean, or low-fat diet. N Engl J Med. 2008; 359:2170. author reply 2171–2. [PubMed: 19009671]
8. Mozaffarian D, Hao T, Rimm EB, Willett WC, Hu FB. Changes in Diet and Lifestyle and Long-Term Weight Gain in Women and Men. N Engl J Med. 2011; 364:2392–2404. [PubMed: 21696306] 9. Salas-Salvado J, Bullo M, Estruch R, Ros E, Covas MI, Ibarrola-Jurado N, et al. Prevention of
diabetes with Mediterranean diets: a subgroup analysis of a randomized trial. Ann Intern Med. 2014; 160:1–10. [PubMed: 24573661]
10. Benetou V, Trichopoulou A, Orfanos P, Naska A, Lagiou P, Boffetta P, et al. Conformity to traditional Mediterranean diet and cancer incidence: the Greek EPIC cohort. Br J Cancer. 2008; 99:191–195. [PubMed: 18594542]
11. Trichopoulou A, Costacou T, Bamia C, Trichopoulos D. Adherence to a Mediterranean diet and survival in a Greek population. N Engl J Med. 2003; 348:2599–2608. [PubMed: 12826634] 12. Sofi F, Macchi C, Abbate R, Gensini GF, Casini A. Mediterranean diet and health status: an
updated meta-analysis and a proposal for a literature-based adherence score. Public Health Nutr. 2014; 17:2769–82. [PubMed: 24476641]
13. Serra-Majem L, Garcia-Closas R, Ribas L, Perez-Rodrigo C, Aranceta J. Food patterns of Spanish schoolchildren and adolescents: The enKid Study. Public Health Nutr. 2001; 4:1433–38. [PubMed: 11918496]
14. Serra-Majem L, Ribas L, Ngo J, Ortega RM, Garcia A, Perez-Rodrigo C, et al. Food, youth and the Mediterranean diet in Spain. Development of KIDMED, Mediterranean Diet Quality Index in children and adolescents. Public Health Nutr. 2004; 7:931–35. [PubMed: 15482620]
15. Papadaki S, Mavrikaki E. Greek adolescents and the Mediterranean diet: factors affecting quality and adherence. Nutrition. 2015; 31:345–49. [PubMed: 25592013]
16. Santomauro F, Lorini C, Tanini T, Indiani L, Lastrucci V, Comodo N, et al. Adherence to Mediterranean diet in a sample of Tuscan adolescents. Nutrition. 2014; 30:1379–83. [PubMed: 25280416]
17. Schroder H, Mendez MA, Ribas-Barba L, Covas MI, Serra-Majem L. Mediterranean diet and waist circumference in a representative national sample of young Spaniards. Int J Pediatr Obes. 2010; 5:516–19. [PubMed: 20863166]
18. Mar Bibiloni M, Martinez E, Llull R, Maffiotte E, Riesco M, Llompart I, et al. Metabolic syndrome in adolescents in the Balearic Islands, a Mediterranean region. Nutr Metab Cardiovasc Dis. 2011; 21:446–54. [PubMed: 20211550]
19. Grao-Cruces A, Nuviala A, Fernandez-Martinez A, Porcel-Galvez AM, Moral-Garcia JE, Martinez-Lopez EJ. Adherence to the Mediterranean diet in rural and urban adolescents of
A
uthor Man
uscr
ipt
A
uthor Man
uscr
ipt
A
uthor Man
uscr
ipt
A
uthor Man
uscr
southern Spain, life satisfaction, anthropometry, and physical and sedentary activities. Nutr Hosp. 2013; 28:1129–35. [PubMed: 23889631]
20. Costarelli V, Koretsi E, Georgitsogianni E. Health-related quality of life of Greek adolescents: the role of the Mediterranean diet. Qual Life Res. 2013; 22:951–56. [PubMed: 22678354]
21. Strauss RS. Comparison of measured and self-reported weight and height in a cross-sectional sample of young adolescents. Int J Obes Relat Metab Disord. 1999; 23:904–08. [PubMed: 10490794]
22. Goodman E, Hinden BR, Khandelwal S. Accuracy of teen and parental reports of obesity and body mass index. Pediatrics. 2000; 106:52–58. [PubMed: 10878149]
23. Shannon B, Smiciklas-Wright H, Wang MQ. Inaccuracies in self-reported weights and heights of a sample of sixth-grade children. J Am Diet Assoc. 1991; 91:675–78. [PubMed: 2040781]
24. Field AE, Aneja P, Rosner B. The validity of self-reported weight change among adolescents and young adults. Obesity (Silver Spring). 2007; 15:2357–64. [PubMed: 17890505]
25. Rockett HR, Breitenbach M, Frazier AL, Witschi J, Wolf AM, Field AE, et al. Validation of a youth/adolescent food frequency questionnaire. Prev Med. 1997; 26:808–16. [PubMed: 9388792] 26. Tremblay MS, LeBlanc AG, Kho ME, Saunders TJ, Larouche R, Colley RC, et al. Systematic
review of sedentary behaviour and health indicators in school-aged children and youth. Int J Behav Nutr Phys Act. 2011; 8:98-5868-8-98. [PubMed: 21936895]
27. Lazarou C, Panagiotakos DB, Matalas AL. Physical activity mediates the protective effect of the Mediterranean diet on children’s obesity status: The CYKIDS study. Nutrition. 2010; 26:61–67. [PubMed: 19632093]
28. Ainsworth BE, Haskell WL, Whitt MC, Irwin ML, Swartz AM, Strath SJ, et al. Compendium of physical activities: an update of activity codes and MET intensities. Med Sci Sports Exerc. 2000; 32:S498–504. [PubMed: 10993420]
29. Jette M, Sidney K, Blumchen G. Metabolic equivalents (METS) in exercise testing, exercise prescription, and evaluation of functional capacity. Clin Cardiol. 1990; 13:555–65. [PubMed: 2204507]
30. Trichopoulou A, Bamia C, Trichopoulos D. Anatomy of health effects of Mediterranean diet: Greek EPIC prospective cohort study. BMJ. 2009; 338:b2337. [PubMed: 19549997]
31. Kontogianni MD, Farmaki AE, Vidra N, Sofrona S, Magkanari F, Yannakoulia M. Associations between lifestyle patterns and body mass index in a sample of Greek children and adolescents. J Am Diet Assoc. 2010; 110:215–21. [PubMed: 20102848]
32. Velazquez-Lopez L, Santiago-Diaz G, Nava-Hernandez J, Munoz-Torres AV, Medina-Bravo P, Torres-Tamayo M. Mediterranean-style diet reduces metabolic syndrome components in obese children and adolescents with obesity. BMC Pediatr. 2014; 14:175-2431-14-175. [PubMed: 24997634]
33. Ebbeling CB, Swain JF, Feldman HA, Wong WW, Hachey DL, Garcia-Lago E, et al. Effects of dietary composition on energy expenditure during weight-loss maintenance. JAMA. 2012; 307:2627–34. [PubMed: 22735432]
34. Mozaffarian D, Appel LJ, Van Horn L. Components of a cardioprotective diet: new insights. Circulation. 2011; 123:2870–91. [PubMed: 21690503]
A
uthor Man
uscr
ipt
A
uthor Man
uscr
ipt
A
uthor Man
uscr
ipt
A
uthor Man
uscr
Figure 1.
Association (β coefficient) between two-point increase in baseline adherence to the m-KM index and change in BMI over the next 2–3 years within subgroups of sex, age, BMI, baseline KidMed score, physical activity, and sedentary time.
All the analyses were adjusted for the rest of covariates and total energy intake. Age was stratified into at or below vs. above the median (13 years).
BMI was stratified into at or below vs. above the median (20.78 kg/m2).
m-KidMed score at baseline was stratified into at or below vs. above the median (2). P.Activ = Physical activity (MET-hours per week), was stratified into at or below vs. above the median (66.26 MET-hours per week).
Sedentary time (hours per week) was stratified into at or below vs. above the median (40.5 hours per week).
A
uthor Man
uscr
ipt
A
uthor Man
uscr
ipt
A
uthor Man
uscr
ipt
A
uthor Man
uscr
A
uthor Man
uscr
ipt
A
uthor Man
uscr
ipt
A
uthor Man
uscr
ipt
A
uthor Man
uscr
[image:13.612.78.495.122.401.2]ipt
Table 1
Modified KidMed Index (m-KM). Modifications appear in italics.
Consume one piece of fruit or fruit juice every day. +1
Consume a second fruit piece every day. +1
Usually eat vegetables (fresh or cooked) once per day. +1
Usually eat vegetables (fresh or cooked) more than once per day. +1
Usually eat fish at least 2–3 times per week. +1
Eat in a fast food restaurant one or more times per week. −1
Consume legumes more than once per week. +1
Eat pasta or rice almost every day (5 days or more per week).
Modified to restrict to < 4 serving per day of grain (including breakfast cereals).
+1
Eat cereal (or bread) as breakfast.
Modified to restrict to cereals with <10 g per of sugar serving and < 4 serving per day of total grain (including rice and pasta).
+1
Usually eat nuts (at least 2–3 times per week). +1
Use olive oil at home. +1
Skip breakfast. −1
Eat one dairy food as breakfast.
Restricted to 1% or 2% milk and < 4 serving per day dairy products.
+1
Eat commercial bakery products as breakfast. −1
Eat 2 yogurts and/or 40gr of cheese every day.
Restricted to low fat or non fat yogurt and cheese and < 4 serving per day of dairy products.
+1
Eat candies or sweets several times per day.
Modified to be ≥ 1 sweet every day.
A
uthor Man
uscr
ipt
A
uthor Man
uscr
ipt
A
uthor Man
uscr
ipt
A
uthor Man
uscr
[image:14.612.77.522.122.253.2]ipt
Table 2
Baseline demographic characteristics of the studied sample. Mean (SD) or median (interquartile range).
Low adherence (−4 to 3) (N=8 892)
Medium Adherence (4 to 7) (N=1 944)
High Adherence (8 to 12) (N=82)
Sex (%boys) 46.30 39.51 39.02
Age (years) 13.34 (1.82) 13.41 (1.85) 13.52 (1.72)
BMI (kg/m2) 20.44 (3.92) 20.10 (3.60) 19.82 (3.88)
Median KidMed Score (interquartile range) 1 (0–2) 5 (4–5) 8 (8)
Physical activity (METs-h/week) 81.35 (59.94) 93.33 (65.80) 94.55 (59.20)
Sedentary time1 (hours/week) 41.00 (23.20) 36.40 (18.67) 35.16 (14.31)
Total energy intake (Kcal/day) 2 090 (733) 2 240 (700) 2 442 (658)
1
A
uthor Man
uscr
ipt
A
uthor Man
uscr
ipt
A
uthor Man
uscr
ipt
A
uthor Man
uscr
ipt
T ab le 3Quartiles of adherence to the MDP and 2-year change in BMI o
v
er 7 years of follo
w up. (N= 3 942).
Q1 Q2 Q3 Q4 p-f or -tr end. KidMed Scor e
−4 to 0 (0)
+1
+2 to +3 (+2)
+3 to +11 (+4)
Absolute BMI change
1.20 (2.24) 1.24 (2.45) 1.09 (2.25) 1.12 (2.17) Relati v
e BMI change (95% CI)
1
0 (Ref.)
0.01 (−0.09 to 0.11)
−0.09 (−0.17 to −0.00)
−0.12 (−0.20 to −0.04)
p 1 . 0.89 <0.05 0.003 0.14 Relati v
e BMI change (95% CI)
2
0 (Ref.)
0.01 (−0.09 to 0.11)
−0.09 (−0.17 to −0.00)
−0.11 (−0.19 to −0.03)
p 2 . 0.89 0.05 0.005 0.11
KidMed score e
xpressed as range (median). BMI change e
xpressed as mean (SD).
1 Model 1: Adjusted for se
x, age, BMI at baseline, ph
ysical acti
vity (METs-h/week), sedentary time (hours/week) and time of follo
w-up.
2 Model 2: Adjusted for se
x, age, BMI at baseline, ph
ysical acti
vity (METs-h/week), sedentary time (hours/week), time of follo
w-up and total ener
gy intak
[image:15.612.92.211.243.678.2]A
uthor Man
uscr
ipt
A
uthor Man
uscr
ipt
A
uthor Man
uscr
ipt
A
uthor Man
uscr
ipt
T ab le 4Quartiles of 2-year change in the m-KM Score and simultaneous change in BMI o
v
er 7 years of follo
w-up. (N= 3 941).
Q1 Q2 Q3 Q4 p-f or -tr end
Change in the m-KM Scor
e
−10 to −2 (−3)
−1 to 0 (−1)
0 to 2 (1)
+2 to +10 (+3)
Absolut simultaneous BMI change
1.28 (2.21) 1.16 (2.39) 1.13 (2.08) 1.09 (2.36) Relati v
e simultaneous BMI change (95% CI)
1
0 (Ref.)
−0.22 (−0.31 to −0.13)
−0.21 (−0.31 to −0.12)
−0.30 (−0.40 to −0.20)
p 1 . <0.001 <0.001 <0.001 <0.001 Relati v
e simultaneous BMI change (95% CI)
2
0 (Ref.)
−0.23 (−0.32 to −0.13)
−0.21 (−0.31 to −0.12)
−0.30 (−0.40 to −0.20)
p 2 <0.001 <0.001 <0.001 <0.001
KidMed score e
xpressed as range (median). BMI change e
xpressed as mean (SD).
1 Model 1: Adjusted for se
x, age, m-KM score at baseline, BMI at baseline, ph
ysical acti
vity (METs-h/week), sedentary time (hours/week) and time of follo
w-up.
2 Model 2: Adjusted for se
x, age, m-KM score at baseline, BMI at baseline, ph
ysical acti
vity (METs-h/week), sedentary time (hours/week), time of follo
w-up and total ener
gy intak
[image:16.612.93.212.184.676.2]A
uthor Man
uscr
ipt
A
uthor Man
uscr
ipt
A
uthor Man
uscr
ipt
A
uthor Man
uscr
ipt
T ab le 5Quartiles of 2-year change in the m-KM Score and change in BMI in the follo
wing period o
v
er 7 years of follo
w-up. (N= 4 103).
Q1 Q2 Q3 Q4 p-f or -tr end
Range in change in the m-KM Scor
e (median)
−10 to −2 (−2)
−1 to 0 (−1)
0 to 1 (1)
+2 to +10 (+3)
Absolute BMI change in the f
ollo wing period 1.05 (2.43) 1.10 (2.10) 0.97 (2.11) 0.95 (2.42) Relati v
e BMI change in the f
ollo
wing period (95% CI)
1
0 (Ref.)
−0.13 (−0.26 to 0.00)
−0.18 (−0.31 to −0.04)
−0.24 (−0.38 to −0.09)
p 1 . 0.05 0.01 0.001 0.002 Relati v
e BMI change in the f
ollo
wing period (95% CI)
2
0 (Ref.)
−0.12 (−0.25 to 0.01)
−0.17 (−0.30 to −0.03)
−0.23 (−0.37 to −0.08)
p 2 0.08 0.01 0.002 0.003
KidMed score e
xpressed as range (median). BMI change e
xpressed as mean (SD).
1 Model 1: Adjusted for se
x, age, m-KM score at baseline, BMI change in the pre
vious time interv
al, ph
ysical acti
vity (METs-h/week), sedentary time (hours/week) and time of follo
w-up.
2 Model 2: Adjusted for se
x, age, m-KM score at baseline, BMI change in the pre
vious time interv
al, ph
ysical acti
vity (METs-h/week), sedentary time (hours/week), time of follo
w-up and total ener
gy
intak
[image:17.612.91.212.159.676.2]