The ADS All-Sky Survey
The Harvard community has made this
article openly available.
Please share
how
this access benefits you. Your story matters
Citation
Pepe, Alberto, Alyssa A. Goodman, and August A. Muench. 2012.
The ADS all-sky survey. In Astronomical Data Analysis Software
and Systems XXI: November 6-10, 2011, Paris, France, ed. Pascal
Ballester, Daniel Egret, and Nuria P. F. Lorente, ASP Conference
Series, Vol. 461, 275-278. San Francisco, CA: Astronomical Society of
the Pacific.
Citable link
http://nrs.harvard.edu/urn-3:HUL.InstRepos:11688783
arXiv:1111.3983v1 [astro-ph.IM] 16 Nov 2011
**Author**
c
**Copyright Year** Astronomical Society of the Pacific
The ADS All-Sky Survey
Alberto Pepe1, Alyssa Goodman1, and August Muench1
1Harvard-Smithsonian Center for Astrophysics
Abstract. The ADS All-Sky Survey (ADSASS) is an ongoing effort aimed at
turn-ing the NASA Astrophysics Data System (ADS), widely known for its unrivaled value as a literature resource for astronomers, into a data resource. The ADS is not a data repository per se, but it implicitly contains valuable holdings of astronomical data, in the form of images, tables and object references contained within articles. The objective
of the ADSASS effort is to extract these data and make them discoverable and available
through existing data viewers. The resulting ADSASS data layer promises to greatly enhance workows and enable new research by tying astronomical literature and data assets into one resource.
1. Introduction
The Astrophysics Data System (ADS) is the premier literature resource for the astro-nomical community. It maintains three bibliographic databases containing roughly 9 million records, 4.5 million scanned pages, and 1.2 million fulltext articles. Integrated in its databases, the ADS provides access and pointers to a wealth of external resources, including electronic articles, data catalogs and archives. While virtually all active as-tronomers use the Astrophysics Data System as a literature resource, very few know that it was originally intended as a data resource (Murray et al. 1992).
Nowadays, the ADS is not a data repository per se, yet it implicitly contains valu-able holdings of astronomical data, in the form of images, tvalu-ables and object references
contained within articles. The objective of the ADSASS effort is to extract these data
and make them discoverable and available through existing data viewers. The outcome of the ADSASS project consists of a data layer, usable by any astronomical program, which documents, links, and aggregates information about several astronomical data pointers.
We focus on the extraction of three categories of data. First, we plan to assemble astronomical object references provided and curated by external databases and “astro-tag” every article in the ADS. Similar to geotags—which are used to reference earth-based locations— astrotags are spatial and temporal annotations about celestial objects. Second, we employ optical data, in the form of images extracted from ADS articles to “astroreference” every image in the ADS fulltext corpus. Similar to georeferencing— which refers to the alignment of a map for overlay within a given earth-based coordinate system— astroreferencing allows astrometric alignment of an image of the sky accord-ing to given coordinates, orientation, and pixel scale. Third, we inspect the metadata of non-optical images (such as text and image caption) to assign programmatically a position or a source name.
2 Alberto Pepe, Alyssa A. Goodman, and August Muench
These data sources are then assembled to generate the ADS All-Sky Survey layer (ADSASS) composed of an all-sky literature heatmap, and an historical data layer. In this article, we present the technical implementation and proposed use of the ADSASS.
2. Technical implementation
[image:3.612.110.486.199.336.2]1
Literature Optical images Object Data Non Optical images PRIMARY DATABASE ADDITIONAL DATABASE ARTICLE-OBJECT MATCHING2
ASTROMETRIC MEASUREMENT3
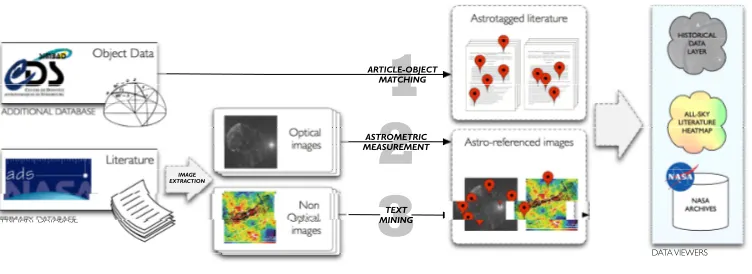
TEXT MINING Astrotagged literature Astro-referenced images HISTORICAL DATA LAYER ALL-SKY LITERATURE HEATMAP NASA ARCHIVES DATA VIEWERS IMAGE EXTRACTIONFigure 1. The ADS All-Sky Survey: Technical implementation
The procedures, data sources, and outcomes that are part of the ADS All-Sky Survey project are depicted, in a summarized format, in Figure 1. The principal data sources are the NASA ADS bibliographic database, and the SIMBAD object catalogue, maintained by the Centre de Donnes astronomiques de Strasbourg (CDS).
The first step of the astrotagging procedure involves using all the holdings of the ADS library for which object references exist to populate a database of astrotagged literature. This mechanism of article-object matching generates an initial database that associates ADS articles with their manually curated object references provided by CDS. The purpose of this first step is to aggregate and publish the conceptual linkages that al-ready exist between ADS and CDS holdings. The outcome of this article-object match-ing procedure is a database of astrotagged literature. For example, in this procedure
a paper by astronomer John Huchra which discusses theM31(Huchra & Brodie 1987)
would be astrotagged with the following elements: a) the referenced objects, each iden-tified by their SIMBAD reference name (e.g., M 31), and co-ordinates (e.g., 00 42
44.330,+41 16 07.50), and b) a timestamp, identified as the year of publication of the
article (e.g., 1987). However, this article-object matching procedure is only possible for the portion of the ADS database for which an object categorization exists. In steps 2 and
3, we attempt to annotate those papers/images for which no classification is available
by automatically inspecting articles for object and/or coordinate information.
As shown in Figure 1, we plan to extract images from all fulltext articles in the ADS. For the purpose of this project, extracted images of interest fall in two categories: optical images and non-optical images.
A sample extracted optical image is presented in the left portion of Figure 2 (a). The image was extracted from a recent article by Indriolo et al. (2010). When fed to
astrometry.net(Lang et al. 2010), this image is correctly resolved as:
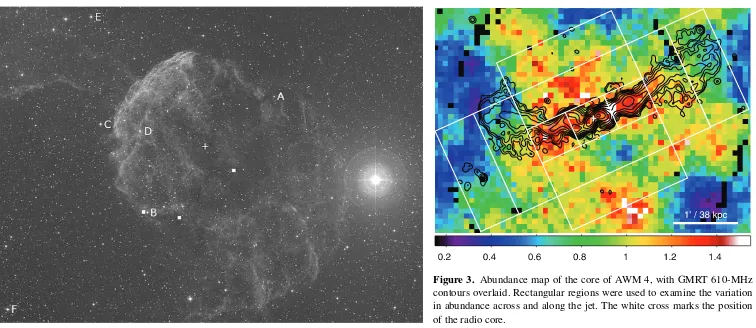
Figure 3.Abundance map of the core of AWM 4, with GMRT 610-MHz contours overlaid. Rectangular regions were used to examine the variation in abundance across and along the jet. The white cross marks the position of the radio core.
Figure 2. (a) On the left: a sample optical image from Indriolo et al. (2010) —
(b): On the right: a sample non-optical image from O’ Sullivan et al. (2011)
This reference information (supernova remnant IC443 and the triple-star system
Propus=Gem) would become part of the astrotags attached to this article, in addition to
a time stamp given by publication date. In this case, however, in addition to astrotagging the article, we would also astroreference the image, using the coordinates, orientation,
and pixel scale returned byastrometry.net. In this way, a database of
literature-extracted astroreferenced images is populated (step 2 of Figure 1).
When astrometric measurement fails, enough textual metadata may be available to assign either a position or a source name, and optionally a platescale and waveband to the images. An example of non-optical image is a metal abundance map from a recent paper by O’Sullivan et al. (2011), shown in Figure 2 (b). This image cannot be calibrated astrometrically, yet, the figure caption gives enough information to ex-tract the needed source name and wavelength metadata. In this case, it is clear from the caption that the source depicted in this cluster is the AWM 4 cluster of galaxies.
SIMBAD or NED can tell us that AWM4 is also known as RXC J1604.9+23559, with
coordinates RA: 16 04 57.0, DEC:+23 55 14. Thus, using figure caption metadata,
this article/figure would be astrotagged with name and coordinate information relative
to the aforementioned catalog objects (step 3 of Figure 1).
3. The ADS All-Sky Survey in action
The ADSASS will yield two products: an all-sky literature heatmap, built from the astrotagged literature database, showing what parts of the sky have been written about in the literature, and in what contexts; and an historical data layer, built from the
astroreferenced image database, offering literature-extracted images for analysis and
overlay on contextual images. Thanks to the proliferation of virtual observatory data viewing systems over the past few years, the options for visualizing these layers are many, and they include compatible all-sky viewers such as the WorldWide Telescope (Microsoft), Aladin (CDS), Google Sky (Google), and MASTview10 (NASA).
4 Alberto Pepe, Alyssa A. Goodman, and August Muench
inventory of astrotagged ADS literature, to enable on-demand faceted visual knowl-edge discovery for any target or topic. For example, a graduate student will be able to generate on the fly a heatmap of the Orion molecular cloud to figure out which parts of the cloud have existing molecular line data, where they are missing, and where specific science topics (e.g., jets and outflows) have been explored in published works.
Second, the faceted heat map of the ADSASS will enable new forms of data dis-covery. Consider the problem of discovering published data on “the radial velocities of young stars” in a particular region of interest. A purely text-based literature search using those words would miss targets of interest only mentioned in the literature as, for example, “host stars” in “exoplanet surveys”. Instead of this text-only search, exploring the faceted heat map of the ADSASS, researchers will be able to traverse related data and objects using a visualization-aided literature search.
Third, researchers investigations of the ADSASS historical data layer will facil-itate the study of astrophysical events, thanks to its synoptic image view. Eruptive events, such as an accretion driven outburst in a very young star, reveal objects that were previously invisible. Synoptic monitoring surveys such as the Palomar Transient Factory are designed to identify these eruptive events but on relatively short timescales. The historical data layer will capture and expose data that was never saved as such in the first place, extending the time baseline for many parts of the sky back almost 100 years (much longer than the epoch provided by the Digital Sky Surveys), and providing a framework to identify solitary or recurrent astrophysical events.
4. Conclusion
The ADS All-Sky Survey reunites data and literature holdings into a powerful astro-nomical research tool. The mission of the ADSASS is to “liberate” data sources that are contained in scientific papers as images, tables, object references, and metadata. The publication of these data in the form of a faceted heat map of the sky and a histor-ical data layer will enable new forms of astronomhistor-ical research and ultimately augment the intrinsic value of the scientific papers in which those data were embedded.
Acknowledgments. The ADS All-Sky Survey was selected for funding as part of the NASA Research Opportunities in Space and Earth Sciences (ROSES-2011) for the Astrophysics Data Analysis Program (ADAP). The authors would like to thank collab-orators and project supporters T. Boch of CDS, A. Accomazzi of ADS, D. Hogg of NYU, J. Fay of Microsoft Research, and A. Conti of STScI.
References
Huchra, J., & Brodie, J. 1987, AJ, 93, 779
Indriolo, N., Blake, G. A., Goto, M., Usuda, T., Oka, T., Geballe, T. R., Fields, B. D., & McCall, B. J. 2010, ApJ, 724
Lang, D., Hogg, D. W., Mierle, K., Blanton, M., & Roweis, S. 2010, AJ, 137
Murray, S. S., Brugel, E. W., Eichhorn, G., Farris, A., Good, J. C., Kurtz, M. J., Nousek, J. A., & Stoner, J. L. 1992, in ESO Conference and Workshop Proceedings, vol. 43