AUSTRALIA’S EQUITY HOME BIAS AND CORPORATE GOVERNANCE
Anil V Mishra1
School of Accounting, Economics and Finance University of Southern Queensland
Australia
Abstract
This paper constructs the float adjusted measure of home bias and explores the determinants of Australia’s equity home bias by employing International Monetary Fund’s high quality dataset (2001 to 2005) on cross border equity investment. The paper finds that information asymmetries arising due to countries regulatory and legal environment have significant impact on Australia’s equity home bias. Trade linkages are found to have a significant impact on Australia’s equity home bias.
Australian investors exhibit a preference for English speaking and common legal origin countries. Transaction costs, though statistically significant, have a very low value to suggest a minor impact on Australia’s home bias. This paper finds low diversification motives of Australian investors.
JEL Classifications: G11, G15, G30
Keywords: float; governance indicators; coordinated portfolio investment survey; rule of law.
1
AUSTRALIA’S EQUITY HOME BIAS AND CORPORATE GOVERNANCE
1 Introduction
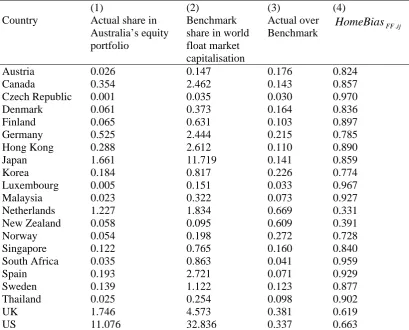
The traditional international capital asset pricing model (ICAPM) based on Sharpe (1964) and Lintner (1965) predicts that investors should hold equities from countries around the globe in proportion to world market capitalisation. However, empirical facts suggest that international portfolios are heavily biased towards domestic assets (French and Poterba (1991), Cooper and Kaplanis (1994), Tesar and Werner (1995), Ahearne et al. (2004)). This phenomenon is termed as “home bias” and it can be defined as the situation where investors hold far too high a share of their wealth in domestic securities compared with the optimal share predicted by the traditional theory of portfolio choice. For instance, the actual domestic equity holding of Australia in 2002 was 81.67% whereas the ICAPM benchmark percentage was 1.84.
The empirical investigation into the home bias puzzle is important for several reasons. First, one of the major problems in the research on home bias has been relatively poor quality of data on cross border holdings. In the past, the cross border holdings were estimated using accumulated capital flows and valuation adjustments (Tesar and Werner (1995)). Warnock and Cleaver (2002) show that capital flows data are ill suited to estimate bilateral holdings. This paper contributes to the existing literature by employing the International Monetary Fund’s (IMF’s) Coordinated Portfolio Investment Survey (CPIS) dataset on bilateral equity holdings for the years 2001 to 2005. CPIS reports data on foreign portfolio asset holdings (divided into equity, long term debt, and short term debt) by residence of issuer. In 1997, IMF conducted the first CPIS wherein 29 countries participated; the next survey was conducted in 2001 wherein 69 countries participated and now CPIS is being conducted on an annual basis.
Second, there are several papers investigating the home bias puzzle related to individual countries viz. Japan (Kang and Stulz (1997)), Sweden (Dahlquist and Robertsson (2001)), Korea (Kim and Wei (2002)) and United States (Ahearne et al (2004), Dahlquist et al (2003)). Mishra and Daly (2006) and Mishra (2007) study Australia’s cross border portfolio investment using CPIS data. There is no study that exclusively focuses on Australia’s equity home bias. This is the first study that focuses exclusively on Australia’s equity home bias.
on institutions that support corporate governance in a country as well as on the risks of predation by state. Home bias will tend to reduce in countries whose institutions support decentralized ownership. This paper contributes to the existing literature by examining the impact of host countries’ legal and governance environment on Australia’s home bias. Fifth, this paper also empirically investigates the role of direct barriers viz. transaction costs; information asymmetries arising due to culture (language, legal origin) and proximity (distance); and control variables viz. trade links, historical risk adjusted returns and covariance on Australia’s equity home bias. Sixth, overall this paper fills in the gap by empirically investigating the phenomenon of home bias in the Australian context; which is critical to understanding international portfolio positions and capital flows.
This paper provides answers to the following questions: Which factors are important in explaining Australia’s equity home bias? Are factors related to culture and proximity important in explaining Australia’s equity home bias? Do trade linkages provide explanation for Australia’s equity home bias? Do share trading costs associated with destination countries’ stock exchanges affect Australia’s equity home bias? Do destination countries’ legal and governance environments influence Australia’s equity home bias? Do investors’ diversification motives primarily influence Australia’s equity home bias?
This paper is structured as follows: Section 2 provides literature review of the home bias puzzle. Section 3 describes float adjusted measure of home bias. Section 4 describes the determinants of home bias and presents some stylized facts. Section 5 provides empirical specification. Section 6 describes the empirical results and finally, section 7 concludes.
2 Literature Review
obtain unique solutions for taxes under extreme assumptions that taxes depend on the country of investment, or on the origin of investor. Cooper and Kaplanis (1994) find that hedging against inflation risk cannot explain the home bias.
For Japan, Kang and Stulz (1997) find that foreign investors concentrate on equity investments in firms that are large; firms that export more and firms with good accounting performance. For Sweden, Dahlquist and Robertsson (2001) find that non-resident investors are mostly institutional investors and that the holdings of stocks by non-resident investors exhibit biases that are also typical of resident institutional investors. Their findings are consistent with Kang and Stulz (1997). For Finland, Grinblatt and Keloharju (2001) show that language matters in an investor’s portfolio allocation. Finnish investors whose native language is Swedish are more likely to own stocks of companies in Finland that have annual reports in Swedish and whose CEOs speak Swedish than those investors whose native language is Finnish. For Korea, Choe et al (2001) find that foreign investors buy at higher prices than resident investors and sell at lower prices. Kim and Wei (2002) find that a significant information asymmetry exists between the resident foreign investors and non-resident foreign investors. They base their finding by testing the hypothesis that non-resident foreign investors may herd more than resident foreign investors like Korean subsidiaries and branches of foreign institutions as the latter have more timely information about the country they live in. Hau (2001) finds that proprietary trades on the German stock market do better when they are geographically closer to Frankfurt. For US, Ahearne et al. (2004) test the home bias puzzle by employing the data on US holdings of foreign equities. They find that information cost is a major determinant of a country’s weight in US investor’s portfolio. For Australia, Mishra and Daly (2006) state that the major determinants of Australia’s geographical allocation of portfolio investment indicate a broad correspondence between stock market capitalisation of destination countries and the allocation of Australian financial investments but with some deviations from that baseline, where the deviations are correlated with Australian trade patterns. Mishra (2007) examines the bilateral, source and host factors driving portfolio equity investment across a set of countries using CPIS data on international equity holdings at the end of 1997, 2001 and 2002. He states that the bilateral equity investment is strongly correlated with the underlying patterns of trade in goods and services. The information asymmetries and cultural-institutional proximity are important for bilateral equity investment. The size of domestic stock market is the key correlate of aggregate foreign portfolio equity asset and liability holdings. The scale of aggregate foreign equity asset holdings is larger for richer countries.
governance. They show that US investors underweight those foreign countries in their portfolios which have closely held firms. They construct an estimate of the world float portfolio. They also analyse Swedish firm level data on foreign ownership and closely held shares and show that the weight of a Swedish firm in the portfolio of foreign investors is inversely related to the fraction of firm held by controlling share holders.
3. Float adjusted Home Bias
Suppose the source country is i and the host country is
j
. Share ofi
′
s
equity in countryj
( )
I
ji is the ratio of
i
′
s
holdings of countryj
equities to countryi
′
s
total equity portfolio.
I
ij = Countryi
′
s
holdings of countryj
equities (1)Country
i
′
s
total equity portfolioCountry
i
′
s
total equity portfolio = Investment by countryi
′
s
residents in home equities + Investment by countryi
′
s
residents in foreign equities. (2)In this paper, country i is the source country, Australia. In other words, Australia’s total equity portfolio is investment by resident Australians in home equities plus investment by Australians in foreign countries.
Investment by country
i
′
s
residents in home equities = Countryi
′
s
market capitalisation -Country
i
′
s
equities held by foreign investors. (3)In other words, investment by resident Australians in home equities = Australia’s market capitalisation - Australia’s equities held by other countries. The market capitalisation value is determined from Federation Internationale des Bourses de Valeurs (FIBV) database of World Stock Exchanges. The equity data is from IMF’s CPIS dataset on cross border portfolio equity investment for the years 2001 to 2005. Appendix A lists those countries whose cross border equity investment (CPIS data) in Australia and Australia’s equity investment abroad, is available over the years 2001 to 2005.
adjusted returns, investors should hold equities from countries around the world in proportion to their market capitalisation.
It follows that share of country
i
′
s
equities invested in countryj
( )
I
j*
, is the ratio of market
capitalisation of country
j
in the world market capitalisation.I
j∗
=
world j
MC
MC
(4)
where MCj is the market capitalisation of country
j
and is the world marketcapitalisation. This ratio is the benchmark of portfolio holdings to which the actual portfolio share is compared.
world
MC
Ahearne et al (2004) employ the traditional approach to measure home bias in United States. The equity home bias is the deviation from the ICAPM benchmark, defined as one minus the ratio of foreign equities in the US and world portfolios.
ij
HomeBias =
−
∗j j i
I
I
1
(5)The traditional theory of home bias calculates the world market portfolio assuming that all shares issued by a corporation could potentially be held by foreign investors. Dahlquist et al (2003) state that in countries with poor investor protection, firms tend to controlled by large share holders so that foreigners can hold only a small portion of issued shares that are freely traded or floated. Firms outside the United States are typically controlled by large resident shareholders (La Porta et al (1999)). These large resident share holders are the controlling share holders, who only sell their shares as a control bloc for a price significantly above the open market share trade prices. Shares held by the controlling share holders are also known as closely held shares. The controlling share holder would not sell his shares without being paid a premium to reflect the benefits he derives from control. The controlling share holders may be officers, directors, and their immediate families, shares held in trusts, shares held by pension benefit plans, and shares held by individuals who hold 5% or more of the outstanding shares. The Japanese closely held shares represent the holdings of the ten largest shareholders.
non-insiders) can hold
(
1
−
α
)
of the firm. Foreign investors can only hold a fractiona
of the shareheld by non-insiders. Foreign investors hold
a
(
1
−
α
)
of the firm if they have no home bias. Dahlquist et al (2003) state that portfolio investors cannot hold the world market portfolio, but can only hold the world market portfolio of shares not held by insiders; which is also known as the float adjusted world market portfolio. If all investors hold the float adjusted world market portfolio, then as insider holdings fall, foreign investors can buy a fraction of shares sold by insiders equal to the weight of the country in the float adjusted world market portfolio. But if foreign investors do not hold the float adjusted world market portfolio, then there is no necessary relation between a change in insider ownership and a change in shares held by foreign investors because all the shares sold by insiders could be bought by local investors.This paper calculates the float adjusted portfolio for countries and also float adjusted world market portfolio from DataStream’s Worldscope database. The float adjusted market capitalisation for a country is the sum of the values of free float market capitalisation for all the firms in that country. Free float market capitalisation is free float number of shares multiplied by the latest available share price, in millions of currency units. Free float number of shares is the percentage of total shares in issue available to ordinary investors i.e. the total number of shares less the closely held shares. Appendix B provides annual data on the number of firms with free float market value.
∑
=
mjm
j
MVFF
MVFF
(6)where MVFFj is the float adjusted market capitalization for country
j
, is the freefloat market capitalization of firm
m
in countryjm
MVFF
j
and∑
mjm
MVFF
is the sum of free floatmarket capitalisation of all firms in country
j
.∑
=j
j
world MVFF
MVFF (7)
where is the sum of free float market capitalisation for the countries in the world.
Appendix B lists the countries whose free float market capitalisation data is used for calculating the world float adjusted market capitalisation.
∑
j
j
MVFF
I
FF j∗
, =
world j
MVFF
MVFF
(8)
Finally, the free float home bias measure is
ij FF
HomeBias , =
−
∗j FF
j i FF
I
I
, ,
1
(9)where is the float adjusted measure of home bias, is the float adjusted
measure of country ij FF
HomeBias ,
I
FFj ,is
i′
equity holdings in countryj
and is float adjusted world marketportfolio of country
∗
j FF
I
,j
.Home bias is equivalent to normalizing source country holdings in host country by the country’s float market capitalisation and then dividing by the share of host country holdings in the worldwide float market capitalisation. The empirical analysis in this paper employs the float adjusted home bias measure for the years 2001 to 2005.
[INSERT TABLE 1]
(9). A greater value of home bias measure corresponds to a lower weight in Australia relative to world portfolios and thus, a higher degree of bias.
4. Determinants of Home Bias and some stylized facts
Some of the possible sources of home bias in the Australian investors equity holdings may be due to explicit costs, proximity costs, regulatory and corporate governance information costs, trade and diversification motives. These sources of home bias are discussed below:
4.1 Explicit Costs
Black (1974), Stulz (1981), Cooper and Kaplanis (1986), Aherane et al (2004) state that investors face explicit costs related to equity investment viz. transaction fees, taxes, commissions and the costs of gathering information.
(i) Transaction Costs
(
TransactionCostj)
Home bias can arise due to high transaction costs associated with trading foreign equities. The transaction cost data is derived from Elkins-McSherry Co. (www.elkins-mcsherry.com). Elkins-McSherry Co. receives trade data on all global trades by institutional traders and computes measures of trading costs. The data consists of average trading costs as a percentage of trade value for active managers in a universe of 42 countries. The data are quarterly, from the last quarter of 1995 through the fourth quarter of 2006. In 1998, the institutional traders in the data represented 136 firms, of which 105 were pension funds, 27 were investment managers, and 4 were brokers. These institutions accounted for 28 billion shares in 632,547 trades, using 700 global managers and 1000 brokers (Domowitz et al 2001).
The transaction cost comprises of three cost components viz. commissions, fees and market impact costs. This paper takes into account the total cost comprising of all the three cost components for the end quarter of years 2001 to 2005. Investors would underweight high transaction cost countries in their portfolios and accordingly, this variable is expected to have positive impact on the measure of home bias.
4.2 Proximity Costs
investors preference for equity investment. The following section discusses two proximity measures of home bias: distance and language.
(i) Distance
(
Distij)
Geographical distance is a barrier to interaction among economic agents and cultural exchange.
Investors prefer investing in countries which are in geographic proximity due to lower
information costs arising from cultural similarities and familiarity. The paper employs
logarithm of distance value obtained from Indo.com2 site. Indo.com uses data from US census
and a supplementary list of cities around the world to find latitude and longitude of two places
and then calculates distance between them (as the crow flies). This variable is expected to have
a positive impact on the measure of home bias.
(ii) Language
(
Languageij)
ij
Language is the common language dummy variable which is equal to one if source and host
country share a common language; otherwise its value is zero. Investors prefer to invest in foreign countries that share a common language with their home country. Common language may better enable investors to read company financial reports and financial press analysis. This may enhance investors’ familiarity with destination countries’ financial system and thus reduce investors’ information costs. Data on language is from the World Factbook 20063 which reports the official, major and unofficial languages from all over the world. Countries such as Australia, New Zealand, UK and US share English as a common language; while Italy, Japan, Malaysia, South Korea and Indonesia have their own languages. This variable is expected to have a negative impact on the measure of home bias.
4.3 Regulatory and Corporate Governance Information Costs
The cross country differences in accounting practices, disclosure requirements and regulatory environments give rise to information asymmetries between local and foreign investors. This paper investigates the impact of host countries’ regulatory environments and corporate governance standards on Australia’s home bias. These legal and governance indices are
2
http://www.indo.com/distance/
3
expected to have a negative impact on Australia’s home bias. A brief description of these legal and governance indices is provided below:
4.3.1 La Porta et al (1998) legal indicators
This paper considers legal origin dummy, efficiency of judicial system indices and rule of law indices from La Porta et al (1998) to investigate their impact on home bias.
(i) Legal Origin
( )
LO
Common origin to the legal system uses a dummy variable for similarity in institutions. This paper assigns a dummy value of 1 if the source and host country have the same legal origin otherwise it is zero. Laws in different countries are typically not written from scratch, but rather transplanted from a few legal families or traditions. In general, commercial laws come from two broad traditions: common law, which is English in origin and civil law, which derives from Roman law. The modern commercial laws originate from the three major families French, German and Scandinavian, in the civil law tradition. The three major law tradition families that have global impact are English common law and the French and German civil law. In case of individual countries, the resulting laws reflect both the influence of their families and country specific law characteristics. This variable is expected to have a positive impact on foreign equity holdings.
(ii) Efficiency of judicial system
(
EFF
)
The efficiency of judicial system index is developed by the country risk rating agency Business International Corporation. This index assesses the efficiency and integrity of the legal environment as it affects business, particularly foreign firms. It may be taken to represent investors’ assessments of conditions in the country in question. This index scales from 0 to 10, with lower scores for lower efficiency levels and is averaged over the period from 1980 to 1983. In this paper, the efficiency of judicial system index has the lowest value (3.25) for Thailand and the highest value (10) for US, UK, Japan, Sweden, Switzerland, Singapore, Finland, Netherlands, New Zealand and Norway. This variable is expected to have a negative impact on Australia’s equity home bias.
(iii) Rule of law
(
ROL
)
with lower scores for less tradition for law and order and is average of the months of April and October of the monthly index between 1982 and 1995. In this paper, the rule of law index has the lowest value (4.2) for South Africa and the highest value (10) for US, UK, Japan, Sweden, Switzerland, Singapore, Denmark, Canada, Belgium, Austria, Finland, Netherlands, New Zealand and Norway. This variable is expected to have a negative impact on Australia’s equity home bias.
4.3.2 Kaufmann et al (2006) governance indicators
Kaufmann et al (2006) indicators describe various aspects of the governance structures of a broad cross-section of countries. The indicators have been constructed on the basis of information gathered through a wide variety of cross-country surveys as well as polls of experts. The indicators cover 213 countries and territories for 1996, 1998 and 2000, and annually for 2002 to 2005. In 2005, they estimate the indicators on 276 individual variables measuring different dimension of governance, by employing 31 different datasets from 24 different sources. They construct six indicators each representing a different dimension of governance viz. voice and accountability, political instability, government effectiveness, regulatory burden, rule of law and graft. The variables are standardized to have a mean of zero and a standard deviation of one. The larger the values, the better they indicate their institutional quality.
Voice and accountability index focuses on various indicators related to political
process, civil rights, and institutions that facilitate citizen control of government actions, such as media independence. Political stability and lack of violence
(
VACC
)
( )
PS
index combines indicators that measure the risk of a destabilization or removal from power of the government in a violent or unconstitutional way.Government Effectiveness index comprises of indicators that measure the quality of
bureaucracy, the competence of civil servants, the quality of public service provision and the
credibility of the government’s commitment to its policies. Regulatory Quality
(
index consists of indicators related to the regulations of exports, imports, business ownerships, equities ownerships, banking, foreign investment, price controls, tariffs, unfair competitive practices etc.(
GE
)
)
)
RQ
Rule of Law index measures concepts related to enforceability of government and
private contracts, fairness of judicial process, speediness of judicial process, violent and
organised crimes, trust in legal system, patent and copyright protection etc. Control of
Corruption index focuses on the measure of corruption within the political system, the
rate of severity of corruption within the state, the intrusiveness of the country’s bureaucracy, corruption among public officials etc. Average
(
CC
)
(
AVE
)
is the average of the Kaufmann et al (2006) governance indicators. Average takes into account the effect of various governance dimensions that determine simultaneously the location of portfolio equity investment.4.4 Trade and Diversification
Mishra (2007) and Lane and Milesi Feretti (2004) state that bilateral equity investment is strongly correlated with the underlying patterns of trade in goods and services. This paper examines the impact of trade on Australian investors’ equity home bias.
Bohn and Tesar (1996) state that investors are momentum traders or return chasers, who base their equity investment decisions on the stock markets past performance. They state that investors tend to move into markets where returns are expected to be high and retreat from markets when predicted returns are low. This paper examines the investors diversification motives on Australia’s equity home bias.
4.4.1 Trade
(
Tradeij)
Trade
is the average of imports and exports normalised by the destination country’s GDP. This measure is in accordance with Aherane et al (2004). Australian investors are better informed about those foreign firms, with which Australia has trading relations. Australian investors are better able to attain accounting and regulatory information on foreign markets through trade. Consequently, investors may be inclined to hold the stocks of foreign companies with whose products they are most familiar. This variable is expected to have a negative impact on the measure of home bias. The data on imports and exports is taken from IMF’s Direction of Trade Statistics and GDP data is from World Bank’s World Development Indicators.4.4.2 DiversificationMotives
This paper employs two measures i.e. covariance and reward to risk ratio to investigate the diversification motives of Australian investors.
The financial economics literature suggests that the greater the comovements between financial assets of two countries, the lower the benefit of diversification. When the correlation between source country and host country is small, source country investors enjoy a larger diversification gain from investing in host country; they have greater desire to increase their equity holdings in host country. Therefore the degree of home bias of source country for host country will be smaller. The covariance between source and host country is computed using return data from DataStream’s Morgan Stanley Capital International (MSCI). The return data is calculated from MSCI monthly stock market indices for months ranging from January 1995 to December 2005.
(ii) Reward to risk ratio
( )
RRjReward to risk ratio is the ratio of mean monthly return to standard deviation. This measure is in accordance with Ahearne et al (2004). Investors might tend to underweight those countries in their portfolios, whose stock markets have performed poorly, based on their information of past stock returns. This variable is expected to have negative impact on the measure of home bias. The return data is calculated from Datastream’s Morgan Stanley Capital International (MSCI) monthly stock market indices for months ranging from January 1995 to December 2005.
5. Empirical Specification
This paper is based on Cooper and Kaplanis (1986) theoretical framework. They derive efficient portfolios in a world where there are barriers to cross border investment, which depend both on the domicile of the investor and his country of investment. This paper regresses the measure of home bias (discussed in section 3) on a vector of explanatory variables that includes explicit costs, proximity costs, regulatory and corporate governance information costs, trade and diversification motives (discussed in section 4).
(
)
(
) ( )
(
ij) (
ij)
( )
j(
ij)
jij j j FFij
COV
RR
Trade
Language
Dis
nCost
Transactio
trol
CapitalCon
HomeBias
χ
α
α
α
α
α
α
α
α
+
+
+
+
+
+
+
+
=
7 6 5 4 3 2 1 0 (10)where : Float adjusted measure of home bias, : Capital
control measure of destination country, : Transaction cost associated with
share trading in destination country, : Distance in kilometre between capital city of
source and host country, : Common language dummy with value equal to one if
source and host country have same language otherwise the value is zero, : Trade is the FFij
HomeBias CapitalControlj
average of imports and exports normalised by the destination country’s GDP, : Reward to
risk is the ratio of destination country’s mean monthly return to standard deviation, :
Covariance of monthly returns of source and host country,
j
RR
ij
COV
j
χ
: random error term.HomeBiasFFij =
β
0 +β
1(
EFF)
+β
2(
ROL)
+β
3( )
LO +ε
j (11) where EFF: Efficiency of judicial system, : Rule of law, : Legal origin dummy with value equal to 1 if source and host country have the same legal origin otherwise it is 0,ROL
LO
j
ε
: random error term. EFF,ROL
andLO
indices are from La Porta et al (1998).(
)
(
)
( )
( )
( )
( )
( )
(
AVE
)
FFijj ijCC
RL
RQ
GE
PS
VACC
Trade
HomeBias
ω
γ
γ
γ
γ
γ
γ
γ
γ
γ
+
+
+
+
+
+
+
+
+
=
8 7 6 5 4 3 2 1 0 (12)where : Trade is the average of imports and exports normalised by the destination
country’s GDP,
VACC
: Voice and Accountability, : Political Stability and Lack of Violence, : Government Effectiveness, : Regulatory Quality,ij
Trade
PS
GE
RQ RL: Rule of Law,CC
:Control of Corruption,
AVE
: Average,ω
j: random error terms.6. Empirical Results
The empirical results are based on panel regression of equations (10) to (12), for the years 2001 to 2005. Appendix A gives the list of host countries for the years 2001 to 2005. Only those countries are included for which cross border equity investment in Australia and Australia’s equity investment abroad are available from CPIS.
[TABLE 2]
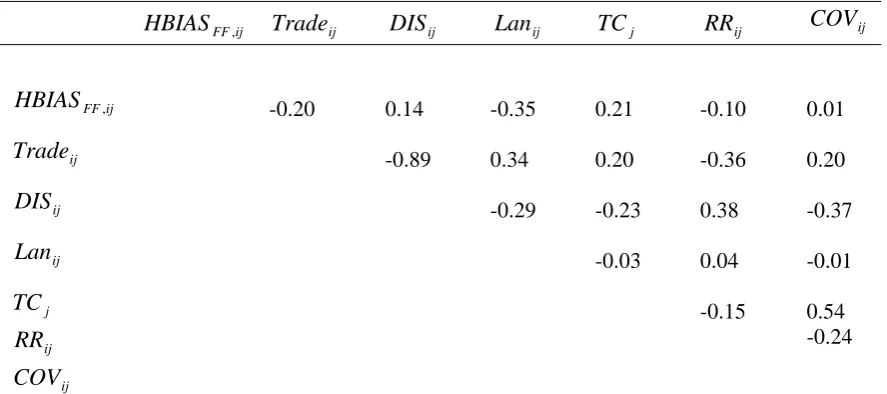
Table 2 presents the correlation matrix for the variables used in the paper. The measure of home bias is negatively related to trade, language dummy and reward to risk ratio; and positively related to distance, transaction cost and covariance. Overall, the correlation matrix does not indicate serious correlation among the variables.
[TABLE 3]
facilitates portfolio equity investment among the countries and consequently reduces equity home bias. The transaction cost variable is positive and significant at 1 percent level. However, the value of transaction cost variable is very low (0.00) which implies that it does not have a major influence on Australia’s equity investment.
Column (2) indicates regression results where the independent variables are trade, language and transaction cost. Language variable is significant at 1 percent level and is negative. This implies that Australian investors prefer investing in English speaking countries. Speaking a common language English, enables Australian investors to better understand the financial system and regulatory environment of the host countries thus facilitating their investments. In 2004; Australia’s equity investment in English speaking countries was around 69 % of its total crosses border equity investment (author’s own calculations based on IMF’s CPIS dataset for 2004). The trade variable is still negative but losses significance from 5 percent to 10 percent. This suggests that some of the contribution from trade may reflect lower information costs which are also captured through common language. The transaction cost variable is still positive and significant at 1 percent level. However, the value of transaction cost variable is very low (0.00) which implies that it does not have a major impact on Australian investors’ equity home bias.
Column (3) indicates the impact of distance and transaction cost on home bias. Distance variable is positive and significant at 10 percent. Investors prefer investing in countries which are in geographic proximity due to low information costs. The major equity investment destinations of Australia are United States and United Kingdom, which are located at greater distances as compared to some Asian countries. Mishra and Daly (2006) state that Asian financial markets are not well developed. Australian investors prefer United States and United Kingdom because these countries are among the world’s largest economies with major shares of the world’s share and bond markets. The transaction cost variable is positive and significant at 1 percent level; however it’s very low value (0.00) further confirms that it does not have a major influence on Australia’s equity investment.
[TABLE 4]
motives of investors. Trade variable enters with a negative sign and is significant at 5 percent. Transaction cost variable is positive and significant at 5 percent.
Column (2) includes trade, transaction cost and reward to risk ratio as the independent variables. Reward to risk ratio is employed instead of covariance, as a robustness check to investigate the diversification motive. If portfolio decisions were based on past returns, then Australian investors might tend to underweight countries’ whose stock markets have performed poorly. The reward to risk ratio variable is negative and significant at 5 percent. This indicates return chasing behaviour of Australian investors. This is in accordance to the finding of Brennan and Cao (1997) who state that when domestic investors of country
j
havecumulative information advantage in the domestic market, the trade of foreign investors in market
j
is positively related to the return of countryj
. This happens because foreigninvestors revise the means of their predictive distributions according to the realized public signals by more than the better informed domestic investors do. Again, trade and transaction cost variables are significant and maintain their sign as per column (1).
Column (3) includes trade, language, transaction cost and covariance as the independent variables. Covariance is positive and insignificant which implies low diversification motive of Australian investors. Language is negative and significant at 5 percent. Trade is negative but losses significance from 5 percent to 10 percent. This further reinforces that some of the contribution from trade may reflect lower information costs which are also captured through common language. Transaction cost variable is positive and significant; however its value is very low (0.00). This further provides support that transaction cost has low impact on Australia’s equity home bias.
As a robustness check, column (4) replaces covariance variable of column (3) with reward to risk ratio variable; other independent variables i.e. trade, language and transaction cost are similar to those in column (3). The reward to risk ratio variable is negative and significant at 10 percent. This suggests return chasing behaviour of Australian investors. Trade, language and transaction cost variables have similar sign and significance as those in column (3).
Overall results of table 4 confirm Australia’s equity investment in English speaking destination countries and also Australian investors not driven primarily by diversification motives. The results are in accordance with Sarkissian and Schill (2004) and Aviat and Couerdacier (2004).
Table 5 illustrates the impact of La Porta et al (1998) indices i.e. rule of law, efficiency of judicial system and legal origin dummy on home bias in the Australian context. Column (1) examines the effect of rule of law index on home bias. Rule of law variable is negative and significant. This implies that Australian investors less underweight countries with high tradition of law and order in their portfolios. Column (2) investigates the impact of efficiency of judicial system on home bias. Efficiency of judicial system variable is negative and significant. This suggests that Australian investors weight those countries in their portfolios which have efficient judicial system. Finally, column (3) examines the effect of legal origin dummy variable on home bias. Legal origin dummy variable is negative and significant. This suggests that Australian investors weight countries having similar culture and origin in their portfolios. Investors are better able to better understand the legal and regulatory environment of the countries having same legal origin as their own and accordingly prefer to invest in those countries.
[TABLE 6]
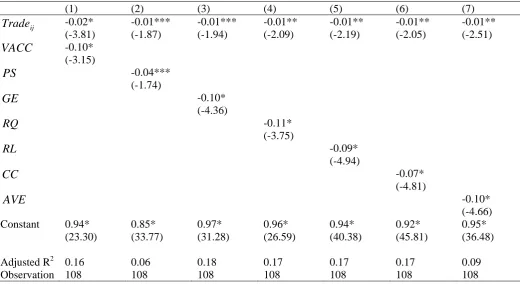
the location of portfolio equity investment, then by including them individually might lead to an omitted variable bias. Therefore, column (7) indicates the effect of governance indicators grouped together (average) on home bias. The average of governance indicators variable is negative and significant. This implies that Australian investors weight those countries in their portfolios which have proper corporate governance system in place.
Overall, results of Table 5 and Table 6 suggest that better governance in the destination countries would lead to an increase of Australian investors’ equity investment. Investors weight countries in their portfolios which have efficient governing systems, high tradition of law and order, transparent corporate governance, effective policies related to trade and development, and regulatory system for control of corruption.
7. Conclusion
This paper employs IMF’s high quality CPIS dataset on cross border equity investment to investigate the determinants of equity home bias in the Australian context. The data itself indicates some interesting stylized facts about the home bias puzzle.
The traditional studies on home bias assume that investors can hold world market portfolio. However, in a world with controlling share holders; portfolio investors can only hold the world portfolio of shares that are not available to controlling shareholders (world float portfolio). This paper constructs the float measure of home bias for the years 2001 to 2005 and explores the determinants of Australia’s equity home bias.
Trade links are found to have a negative and significant impact on home bias; implying that trade alleviates certain information asymmetries in terms of familiarity with the financial and legal environment of the countries; cultural barriers etc. Information flows positively affect both cross-border finance and trade. Trade in goods and trade in assets become complementary: firm managers learn about each other by trading goods and/or securities. Trading in goods market reduces informational asymmetries in the financial markets (and vice versa).
This paper finds low diversification motives of Australian investors. Transaction costs are positive and statistically significant; however their values are very low.
This paper also investigates the impact of destination countries legal and governance environment on Australia’s home bias. Investors weight countries in their portfolios which have efficient governing systems, high tradition of law and order, transparent corporate governance and effective policies related to trade and development.
Overall the results indicate that both regulations and information costs have impact on Australia’s cross border equity holdings. Even among countries for which regulatory barriers to foreign equity holdings are small, cultural barriers seem to constitute quite significant barrier to equity holdings.
References
Ahearne, Alan G., Griever, William L. and Warnock, Francis E., 2004, Information costs and home bias: an analysis of US holdings of foreign equities, Journal of International Economics, 62: 313-336.
Aviat, A. and N. Coeurdacier. 2004, The Geography of Trade in Goods and Asset Holdings, DELTA. Mimeo.
Black, F., 1974, International capital market equilibrium with investment barriers, Journal of Financial Economics, 1.
Bohn, H., Tesar, L., 1996, US equity investment in foreign markets: Portfolio rebalancing or return chasing, American Economic Review, 86(2): 77-81.
Brennan, M. and H. Cao. 1997. International Portfolio Investment Flows. Journal of Finance
52(2): 1851-80.
Choe, H., B. Kho and R.M. Stulz, 2001, Do domestic investors have more valuable information about individual stocks than foreign investors?, NBER Working Paper 8073. NBER, Cambridge, MA.
Cooper, I.A. and D.R. Lessard, 1981, International Capital Market Equilibrium with Deadweight Costs to Foreign Investment, Unpublished Paper.
Cooper, I. and E. Kaplanis, 1986, Costs to crossborder investment and international equity market equilibrium in J. Edwards, J. Franks, C. Mayer and S. Schaefer (eds.), Recent Developments in Corporate Finance, Cambridge University Press, Cambridge.
Coval, J., and T. Moskowitz, 1999, Home Bias at Home: Local Equity Preference in Domestic Portfolios, Journal of Finance, 54, 2045-2073.
Coval, J., and T. Moskowitz, 2001, The Geography of Investment: Informed Trading and Asset Prices, Journal of Political Economy, 109, 811-841.
Dahlquist, M., and G. Robertsson, 2001, Direct foreign ownership, institutional investors, and firm characteristics, Journal of Financial Economics, 59: 413-440.
Dahlquist, M., L. Pinkowitz, R. Stulz, and R. Williamson, 2003, Corporate Governance and Home Bias, Journal of Financial and Quantitative Analysis, 38(1): 135-157.
Domowitz, I.., J. Glen, A. Madhaven, 2001, Liquidity, volatility, and equity trading costs across countries and over time, International Finance, 4(2), 221-255.
French, K., and J. Poterba, 1991, Investor diversification and international equity markets, American Economic Review, Papers and Proceedings, 222-226.
Gehrig, Thomas, 1993, An Information Based Explanation of the Domestic Bias in International Equity Investment, Scandinavian Journal of Economics, 95(1): 97-109.
Grinblatt, M. and Keloharju, M., 2001, How distance, language and culture influence stockholdings and trades, Journal of Finance, 56: 1053-1073.
Hasan, Ifekhar and Yusif, Simaan, 2000, A Rational Explanation for home country bias, Journal of International Money and Finance, 19: 331-361.
Hau, H., 2001, Location matters, Journal of Finance, 56:1959-1983.
International Monetary Fund, 2006, Direction of Trade Statistics, IMF Washington, DC.
International Monetary Fund, 2006, Portfolio Investment: Coordinated Portfolio Investment Survey (CPIS): Metadata, IMF, Washington, DC.
Kang, Jun-Koo and Stulz, R., 1997, Why is There Home Bias? An Analysis of Foreign Equity Ownership in Japan, Journal of Financial Economics, 46(1): 3-28.
Kaufmann, D., A. Kraay, and P. Zoido-Lobaton, 2006, Governance Matters V: Governance Indicators for 1996-2005, World Bank Policy Research Working Paper Series No. 4012.
Kho, B.C., R.M Stulz and F.E Warnock, 2006, Financial Globalization, Governance and the Evolution of the Home Bias, NBER Working Paper 12389.
Kim, Woochan and Wei, Shang-Jin, 2002, Foreign Portfolio Investors Before and During a Crisis, Journal of International Economics, 56: 77-96.
La Porta, R., F. Lopez-de-Silanes, and A. Sheifer, 1999, Corporate ownership around the world, Journal of Finance, 54: 471-517.
La Porta, R., F. Lopez-de-Silanes, A. Sheifer, and R. Vishny, 1998, Law and Finance. Journal of Political Economy, 106: 1113-1155.
Lane, P.R. and G.M. Milesi-Ferreti, 2004, International Investment Patterns, IISC Discussion Paper No. 24.
Lintner, J., 1965, The valuation of risky assets and the selection of risky investment in stock portfolio and capital budgets, Review of Economics and Statistics, 47:103-124.
Merton, R., 1987, A simple model of capital market equilibrium with incomplete information, Journal of Finance, 42: 483-510.
Mishra, A.V., 2007, International Investment Patterns: Evidence Using A New Dataset, Research In International Business And Finance, 21(2): 342-360.
Mishra, A. and K., Daly, 2006, Where Do Australians Invest?, Australian Economic Review, 39(1): 47-59.
Portes, R., H. Rey and Y. Oh., 2001, Information and Capital Flows: The Determinants of Transactions in Financial Assets, European Economic Review,45 (May): 783-96.
Sarkissian, S. and M.J., Schill, 2004, The Overseas Listing Decision: New Evidence of Proximity Preference, The Review of Financial Studies, 17 (3): 769-809.
Sharpe, W., 1964, Capital asset prices: A theory of market equilibrium under the condition of risk, Journal of Finance, 19: 425-442.
Stulz, R., 1981, On the effects of barriers to international investment, Journal of Finance, 36: 923-934.
Tesar, L., and Werner, 1995, Home bias and high turnover, Journal of International Money and Finance, 14: 467-493.
Warnock, F. and C. Cleaver, 2002, Financial centers and the geography of capital flows, International Finance, 6(1): 27-59.
Appendix A: Countries
2001 2002 2003 2004 2005
Hong Kong Denmark Finland France Germany Greece Hungary Ireland Italy Japan South Korea Malaysia Netherlands New Zealand Norway Singapore South Africa Spain Sweden Switzerland UK US Canada Belgium Luxembourg Austria Denmark Finland France Germany Greece Ireland Italy Japan Malaysia South Africa Spain Sweden Switzerland UK US Canada Belgium Luxembourg Austria Brazil Hong Kong Denmark Finland France Germany Greece Hungary Ireland Italy Japan Malaysia Netherlands New Zealand Norway Singapore South Africa Spain Sweden Switzerland Thailand UK US Canada Belgium Luxembourg Austria Hong Kong Czech Republic Denmark Finland Germany Japan South Korea Malaysia Netherlands New Zealand Norway Singapore South Africa Spain Sweden Thailand UK US Canada Luxembourg Austria Hong Kong Czech Republic Finland Germany Japan South Korea Malaysia Netherlands Norway Singapore Thailand Turkey UK US Luxembourg
Appendix B: Number of Firms in respective countries for calculation of free float market capitalisation
Note: Data on the number of firms is per year. Data on number of firms for Czech Republic, Bangladesh, Mauritius and Iceland correspond to market capitalization as float adjusted market capitalization is not available for these countries.
Table 1: Australia’s portfolio equity investment (2004)
Country
(1)
Actual share in Australia’s equity portfolio
(2)
Benchmark share in world float market capitalisation
(3)
Actual over Benchmark
(4)
ij FF
HomeBias ,
Austria 0.026 0.147 0.176 0.824
Canada 0.354 2.462 0.143 0.857
Czech Republic 0.001 0.035 0.030 0.970
Denmark 0.061 0.373 0.164 0.836
Finland 0.065 0.631 0.103 0.897
Germany 0.525 2.444 0.215 0.785
Hong Kong 0.288 2.612 0.110 0.890
Japan 1.661 11.719 0.141 0.859
Korea 0.184 0.817 0.226 0.774
Luxembourg 0.005 0.151 0.033 0.967
Malaysia 0.023 0.322 0.073 0.927
Netherlands 1.227 1.834 0.669 0.331
New Zealand 0.058 0.095 0.609 0.391
Norway 0.054 0.198 0.272 0.728
Singapore 0.122 0.765 0.160 0.840
South Africa 0.035 0.863 0.041 0.959
Spain 0.193 2.721 0.071 0.929
Sweden 0.139 1.122 0.123 0.877
Thailand 0.025 0.254 0.098 0.902
UK 1.746 4.573 0.381 0.619
US 11.076 32.836 0.337 0.663
Table 2: Correlation Matrix (2001 to 2005)
ij FF
HBIAS , Tradeij DISij Lanij TCj RRij COVij
-0.20 0.14 -0.35 0.21 -0.10 0.01
ij FF
HBIAS ,
ij
Trade -0.89 0.34 0.20 -0.36 0.20
ij
DIS -0.29 -0.23 0.38 -0.37
ij
Lan -0.03 0.04 -0.01
j
TC -0.15 0.54
ij
RR -0.24
ij
COV
Note: *,** and *** indicate significance at the 1%, 5% and 10% levels, respectively. White corrected t-statistics in parenthesis. : Float adjusted home bias measure, : Capital control measure of destination country, : Transaction cost associated with share trading in destination country, : Distance in kilometre between capital city of source country and host country, : Common language dummy with value equal to one if source and host country have same language otherwise the value is zero, : Trade is the average of imports and exports normalised by the destination country’s GDP, : Reward to risk is the ratio of destination country’s mean monthly return to standard deviation, : Covariance of monthly returns between source country and destination country.
ij FF
HBIAS , CCj
j
TC
ij
DIS
ij
Lan
ij
Trade
ij
RR
ij
Table 3: Australia’s Home Bias (2001 to 2005) (1) (2) (3)
ij
Trade -0.01** (-2.43) -0.01*** (-1.68)
ij
Dis 0.14*** (1.65)
ij
Lan -0.07* (-2.65)
j
TC 0.00* (3.52) 0.00* (3.33) 0.00* (2.90)
Constant 0.68* (15.62)
0.72* (15.67)
0.08 (0.23)
Adjusted R2 0.12 0.17 0.07
Observation 108 108 108
Note: Refer note of Table 2.
Table 4: Effect of diversification on Australia’s Home Bias (2001 to 2005) (1) (2) (3) (4)
ij
Trade -0.01** (-2.50) -0.02* (-2.93) -0.01*** (-1.71) -0.01** (-2.03)
ij
Lan -0.07** (-2.54) -0.07** (-2.36)
j
TC 0.00** (2.51) 0.00* (3.32) 0.00* (2.87) 0.00* (3.22)
ij
RR -0.25** (-2.26) -0.18*** (-1.69)
ij
COV 0.00 (0.79) 0.00 (0.33)
Constant 0.67* (15.15)
0.72* (16.32)
0.71* (14.59)
0.74* (17.07)
Adjusted R2 0.13 0.14 0.17 0.18
Observation 108 108 108 108
[image:30.595.81.387.484.678.2]Table 5: Effect of Legal Indices on Home Bias (2001 to 2005) (1) (2) (3)
ROL
-0.02*(-4.31)
EFF -0.02*
(-2.63)
LO
-0.06**(-2.08) Constant 1.03* (22.02) 0.99* (14.85) 0.83* (45.69)
Adjusted R2 0.08 0.05 0.03
Observation 98 98 108
Note: *,** and *** indicate significance at the 1%, 5% and 10% levels, respectively. White corrected t-statistics in parenthesis.
ROL
: Rule of law. EFF : Efficiency of judicial system.Legal Origin. Legal Indices are from La Porta et al (1998).
:
LO
Table 6: Effect of Governance Indices on Home Bias (2001 to 2005)
(1) (2) (3) (4) (5) (6) (7) ij Trade -0.02* (-3.81) -0.01*** (-1.87) -0.01*** (-1.94) -0.01** (-2.09) -0.01** (-2.19) -0.01** (-2.05) -0.01** (-2.51)
VACC
-0.10* (-3.15)PS
-0.04***(-1.74)
GE
-0.10*(-4.36)
RQ -0.11*
(-3.75)
RL -0.09*
(-4.94)
CC
-0.07*(-4.81)
AVE
-0.10*(-4.66) Constant 0.94* (23.30) 0.85* (33.77) 0.97* (31.28) 0.96* (26.59) 0.94* (40.38) 0.92* (45.81) 0.95* (36.48)
Adjusted R2 0.16 0.06 0.18 0.17 0.17 0.17 0.09
[image:31.595.63.584.480.764.2]Note: *,** and **** indicate significance at the 1%, 5% and 10% levels, respectively. White corrected t-statistics in parenthesis. : Trade is the average of imports and exports normalised by the destination country’s GDP. Voice and Accountability , Political Stability and Lack of Violence ( ), Government Effectiveness ( ), Regulatory Quality ( ), Rule of Law (
ij
Trade
(
VACC
)
PS
GE