COMPARING THE DEGREE OF AGREEMENT OF
INTRAOCULAR PRESSURES IN PATIENTS WITH
KERATOCONUS USING GOLDMANN
APPLANATION TONOMETER, DYNAMIC CONTOUR
TONOMETRY & TONOPEN
DISSERTATION SUBMITTED AS PART OF FULFILMENT FOR THE
MS BRANCH III (OPHTHALMOLOGY) DEGREE EXAMINATION OF
THE TAMILNADU DR.M.G.R.MEDICAL UNIVERSITY, TO BE HELD
BONAFIDE CERTIFICATE
This is to certify that this dissertation entitled ―To compare the degree of agreement of intraocular pressures in patients with Keratoconus using Goldmann Applanation Tonometry, Dynamic Contour Tonometry & Tonopen ‖ done towards fulfilment of the requirements of the Tamil Nadu Dr. MGR Medical University, Chennai, for the MS Branch III (Ophthalmology) examination to be conducted in April 2015, is a bona fide work of Dr.Shishir Verghese, postgraduate student in the Department of Ophthalmology, Christian Medical College, Vellore.
Dr. Shishir Verghese; MBBS
Pg Registrar
BONAFIDE CERTIFICATE
This is to certify that this dissertation entitled ―To compare the degree of agreement of intraocular pressures in patients with Keratoconus using Goldmann Applanation Tonometry, Dynamic Contour Tonometry & Tonopen ‖ done towards fulfilment of the requirements of the Tamil Nadu Dr. MGR Medical University, Chennai, for the MS Branch III (Ophthalmology) examination to be conducted in April 2015, is a bona fide work of Dr.Shishir Verghese, postgraduate student in the Department of Ophthalmology, Christian Medical College, Vellore.
BONAFIDE CERTIFICATE
This is to certify that this dissertation entitled ―To compare the degree of agreement of intraocular pressures in patients with Keratoconus using Goldmann Applanation Tonometry, Dynamic Contour Tonometry & Tonopen ‖ done towards fulfilment of the requirements of the Tamil Nadu Dr. MGR Medical University, Chennai, for the MS Branch III (Ophthalmology) examination to be conducted in April 2015, is a bona fide work of Dr.Shishir Verghese, postgraduate student in the Department of Ophthalmology, Christian Medical College, Vellore
Dr.Pushpa Jacob, DO, DNB, FICO, FRCS Professor,
Department of Ophthalmology, Christian Medical College, Vellore- 632001
ACKNOWLEDGEMENTS
CONTENTS
1.
Introduction
2.
Aims and objective
3.
Review of literature
4.
Material and methods
5.
Results
6.
Discussion
7.
Limitation of the study
8.
Conclusions
9.
Recommendation
10.
Bibliography
11.
Annexure
I.
Annexure : IRB permission letters
II.
Annexure : Information Sheet
III.
Annexure : Consent Sheet
IV.
Annexure : Patient Profile
V.
Annexure : Pictures
Degree of Agreement of Intraocular pressures in patients with keratoconus using
Goldman Applanation Tonometer, Dynamic Contour Tonometer and Tonopen
Shishir Verghese, Pushpa Jacob & Arathi Simha
Department of Ophthalmology, Christian Medical College, Vellore
Abstract
Aim: The aim of this study was to measure and compare the intraocular pressure (IOP) in patients with keratoconus using Goldman Applanation Tonometer (GAT), Dynamic Contour Tonometer (DCT) and Tonopen and evaluate the possible influence of central corneal thickness (CCT) on the intraocular pressure measured with the three tonometers.
Methods: This was a prospective case control study of 41 keratoconus patients and 100 normal patients where the intraocular pressure was measured with the GAT, DCT and Tonopen. CCT was measured with an ultrasound pachymeter.
found to be reproducible with all three tonometers.
Conclusion: All three methods of measuring IOP with GAT, Tonopen and DCT showed fair to good correlation, with an excellent agreement shown between GAT and Tonopen. Intraocular pressure measured with DCT and CCT corrected IOP measured with GAT are recommended as suitable methods for IOP measurement for keratoconus patients. It is also important to choose an instrument which is best suited for a particular patient and should be consistently used for the long term follow up. There was no influence of CCT on IOP measurements with the three tonometers in keratoconus. All three methods of IOP were found to be reproducible.
INTRODUCTION
Keratoconus
Symptoms are highly variable and depend on the stage of progression of the disorder with the patient having no symptoms early on in the disease. Hence the early forms of the disease may go undetected unless anterior corneal topography is studied.
In the past 30 years computer technology and biotechnology has had a major influence in improving our understanding as well as in the diagnosis and management of keratoconus. Many devices are available for measuring the anterior corneal topography, with computer assisted videokeratography which generate colour coded maps. Topographic indices are currently the most sensitive and sophisticated devices for confirming the diagnosis of keratoconus.(1)
Management options include treatment with contact lenses, collagen cross linking, intrastromal ring segments, thermokeratoplasty and in severe cases lamellar or penetrating keratoplasty.
Recording and monitoring of Intra Ocular Pressure (IOP) is essential in patients with keratoconus. Glaucoma or ocular hypertension may co-exist in patients with keratoconus and following penetrating keratoplasty or refractive surgery for keratoconus. After penetrating keratoplasty, up to 30% of patients may have raised IOP or glaucoma, risking both optic nerve damage and graft failure. It is therefore important that reliable measurement of IOP is made in these patients to assist in the diagnosis and monitoring of treatment.
especially in cases of advanced keratoconus due to larger applanating area and the IOP measurement may not be consistent due to the variability in corneal thickness and alteration in ocular surface. Hence the search for better, reproducible methods of measuring IOP which is least influenced by factors like central corneal thickness, corneal curvature, corneal irregularity, corneal rigidity and corneal hysteresis. To overcome these problems involved in estimating the IOP in eyes with keratoconus, studies have looked into the measurement and variation of IOP as measured by other methods of tonometry like Tonopen, Dynamic Contour Tonometry (DCT) and the Ocular Response Analyzer (ORA) which may be more suited for eyes with keratoconus.
The Tonopen is a hand held battery operated instrument and has a smaller applanating surface as compared to GAT. Most studies agree that there is good correlation with GAT IOP especially within the normal range of IOP.(4–8) Studies have also shown that the Tonopen is relatively independent of the CCT especially in patients with Keratoconus and post penetrating Keratoplasty.(9) In eyes with increased CCT (>584 μm), the tonoPen tended to
produce, consistently, higher IOP readings than GAT. (10)
DCT is a relatively new digital tonometer that uses the principle of contour matching instead of applanation. Studies have found that IOP as measured by DCT is relatively independent of CCT, corneal curvature or axial length.(11–13) It has also been found to be accurate in eyes with keratoconus(14–16) corneal oedema (17) and post penetrating keratoplasty.(16)
AIMS &
Aims
To measure and compare the IOP in patients with keratoconus and normals using three methods: GAT, Tonopen and DCT.
To measure the (CCT) in these patients and look for the possible influence of CCT on the IOP measured by the three methods mentioned above.
Objectives
To measure the IOP in patients with keratoconus (cases) and in normals (controls) using three methods : GAT, DCT and Tonopen and correlate the degree of agreement between them
To measure the CCT using ultrasound pachymetry in cases and controls and evaluate the possible influence of CCT on IOP measured by the three instruments.
REVIEW OF
Review of literature
Keratoconus
Keratoconus is an ectatic non inflammatory corneal disorder, usually bilateral, characterised
by a progressive corneal protrusion and decreased vision. There is central corneal thinning,
the apex of the cone usually centred just below the visual axis, associated with irregular
astigmatism and myopia due to the progressive corneal protrusion.
It was first described in the year 1850 by a British physician John Nottingham. (18) Though an uncommon disorder the estimated incidence reported is approximately 1 per 2000 in the
general population with higher incidence in refractive surgery candidates.(1,19,20) A prevalence study from Maharashtra, in central India, reported a prevalence rate of 2.3%.(21)
.
Classically the disease starts in the adolescent age group and progresses through the third and
fourth decade of life.(1,3,21,22) It is a condition associated with a progressive degeneration of corneal stroma due to changes in the biochemical properties of the cornea. (1,23–29)
Corneal structure in keratoconus
inferotemporally have been revealed. These types of cones often can be distinguished on slit-lamp examination or evaluation of the anterior corneal topography in keratoconus patients.(1)
Ectatic conditions of the cornea such as keratoconus are progressive. There is distortion of corneal curvature and is thought to be associated with weaker corneas. There is evidence that both the anterior and posterior curvatures are affected in keratoconus and in suspects. The
stromal thinning and posterior stress line, suggest that posterior surface geometry may be
altered independent of the anterior corneal surface even in the early stage of disease.(2)
Recent models of keratoconus pathogenesis have postulated that the biochemical alteration may be the consequence of the distortion of the lamellar matrix in the stroma which does not
follow the orthogonal pattern, thus there are regions of highly aligned collagen intermixed
with regions in which the collagen alignment is poor.(2)
Keratocyte apoptosis and abnormal regulation of collagenase, protease and tissue inhibitors of matrix metalloproteinases-1 and -3 may play a role in the development of stromal ultra structural defects. Even though there has been progress in the understanding of the biomechanical properties of the condition, when it comes to diagnosis and treatment there is limitation in measuring the biomechanical properties due to lack of availability of reliable equipment as of yet.(30–33)
Corneal thickness in keratoconus
Classification and detection techniques for keratoconus
The diagnosis involves a careful clinical examination followed by biomicroscopy,
biomicroscopy signs. However, identification of early cases (forme fruste) with no specific corneal findings is challenging.
Diagnosing the early disease is important for screening patients for refractive surgery.
Keratoconus suspects are cases which do not show biomicroscopic signs but only subtle
topographic changes.(2) Rapid evolution of corneal imaging technology has led to the progress in geometric characterisation of keratoconus.
A newer nomenclature has been proposed which combines information from genetics,
biochemistry, tomography and biomechanics; which are obtained from diagnostic tests. Five
states have been recognized in the new nomenclature which are progressive symptomatic
keratoconus, non progressive symptomatic keratoconus, progressive asymptomatic, non
progressive asymptomatic and keratoconus suspect. (36)
Various keratoconus diagnosis, staging, and progression criteria are in clinical use. These include data from clinical evaluation, topography and topometry derived indicators.
The assessment of keratoconus severity and visual function has yielded poor results in keratoconic eyes when compared with several anterior-surface–derived topographic parameters, including K, pachymetry, and surface-asymmetry indices.(19,38,40)
Other published reports also indicate the limitations in specificity and sensitivity of traditionally employed keratoconus criteria.4,8,9
Thus, the refinement and augmentation of early diagnostic criteria for keratoconus is of clini-cal significance because it may enable more timely intervention(41)
The Gold standard grading scheme proposed by Mc Mohan et al was in use which classified
keratoconus into keratoconus suspect, mild, moderate and severe keratoconus.(42)
Rabinowitz described a classification scheme of keratoconus suspect, early keratoconus and
keratoconus. Their classification was based on the analysis of the topographic data such as
KISA % index where K is the central K reading, I-S is the inferior superior steepening, A is
the AST index (Sim K1 –SimK2)(43)
Mahmoud et al proposed the cone location and magnitude index and Maeda et al proposed
the keratoconus prediction index and keratoconus index. Smolek and Klyce developed neural
classification indices and Chastang et al developed a binary decision tree on the basis of
topographic indices.(38,44,45)
Advance imaging technologies like the optical coherence tomographers, systems combining
the scanning slit and Placido disk technologies, and systems based on the Scheimpflug
photography techniques are commercially available. These systems allow the pachymetry
distribution as well as the evaluation of the volume of the cornea.
to quantify the severity of keratoconus or no keratoconus like pattern is reported. Thus keratoconus can be differentiated from a wide range of pathologies. The false positive rate of 1 out of 43 and a false negative rate of 2 in 130 was reported .(1, 3)
The Klyce Madea Classification system:
This system uses indices like SimKl, SimK2, and Surface Asymmetry Index (SAI)—and five new indices—the Differential Sector Index (DSI), the Opposite Sector lndex (OSI), the Center/Surround Index (CSI), the Irregular Astigmatism Index (I A I), and the Analyzed Area (AA)..
Various Alogrithms used for detecting and classifying keratoconus
Alogrithms Indices Used Comments
Rabinowitz Central K, I-S value, Sim K & SRAX index
Could only differentiate Keratoconus from normals
Klyce Madea SimKl, SimK2, and SAI five new indices : DSI, OSI,CSI, I A I & the AA
Differentiated keratoconus from normals and other pathologies as well
Smolek Klyce
(Neural
Network
approach
SimKl, SimK2, and SAI five new indices : DSI, OSI,CSI, I A I & the AA
One network detects and classifies clinical keratoconus & keratoconus suspects from confounding topographic patterns. 2nd network quantifies the severity of cone that matches the topographic pattern of clinical keratoconus or keratoconus suspects
KISA% KISA% = (K) x (I–S) x
(AST) x (SRAX) X 100
Intraocular pressure (IOP) in keratoconus
Structural changes of the cornea in keratoconus lead to difficulties in the accurate measurement of intraocular pressure by applanation tonometry and therefore IOP reading is generally lower than expected.(27) Generally keratoconus is a condition which is associated with a low intraocular pressure and is not thought to be associated with glaucoma.(28,35)
However in hospitals where keratoconus patients are referred for evaluation a greater
number have been diagnosed as glaucoma suspects and many of them have been found to
develop glaucomatous optic neuropathy despite a normal IOPrecording.
Accurate intra ocular pressure (IOP) measurements are important in keratoconus because
glaucoma and keratoconus can co- exist.
Corneal parameters affecting IOP measurements with various tonometers
The corneal parameters are the main source of error in IOP measurement for all the devices
but data islimited.(15,47,48) The morphological changes in keratoconus include alterations in the rigidity and elasticity of cornea and thinning of the central cornea in later stages of the
disease however, the peripheral corneal thickness is probably unaffected. (1) A larger within
the study co-efficient of variation (COV) was reported for keratoconus patients as compared
to normals (12.3%,-range-5.7% to 27.4) from the perspective of meta analysis generated
normative values for adult CCT. Pachymetry has been found to be useful in cases of
keratoconus and other corneal degenerations survey opthal 2000.
An average CCT of 0.434 mm has been calculated from these studies which are clearly much
lower than the values from normal corneas. These changes associated with keratoconus may
applanation tonometry, the reading generally being lower than as expected.(49) Patients with severe keratoconus may present with acute hydrops which is characterized by presence of
stromal oedema and hence in such condition, IOP measured was falsely low even though the
corneal thickness was high.(17)
The Goldmann applanation tonometer is the gold standard for IOP measurements. However
under and over estimations occur with this device when the corneal thickness is outside
normal limits.(50,51).
This is because the Goldman applanation tonometer and other devices based on the principle
of applanation for IOP measurement are affected by variations in the corneal
thickness.(28,48,52,53)
Like the Goldmann tonometry, many studies have shown that corneal abnormalities influence
the IOP measured by non contact tonometers. The dynamic contour tonometer (DCT) is
expected to be unaffected by corneal properties.(15,54)
Firat et alrr conducted a study to determine the agreement between IOP readings obtained by
GAT, non contact tonometer (NCT) and the DCT to determine the influence of corneal
parameters like corneal thickness (CCT), thinnest corneal thickness (TCT), steepest
Keratometry, corneal curvature(CC), corneal volume(CV) and posterior corneal curvature
(PCC) on the IOP readings in keratoconus and normal eyes. They found that the IOP
measurements were significantly different between the various tonometers in the keratoconus
group as compared to the normals. In the keratoconus group the corneal parameters ie the
thinnest corneal thickness, steepest keratometry, the corneal curvature, the CCT and posterior
corneal curvature had a significant influence on the GAT and noncontact tonometer but not
on the DCT. In the control group the thinnest corneal thickness and CCT influenced the GAT
Firat et al found that dynamic contour tonometer seemed to be unaffected by corneal
parameters but the IOP readings measured with DCT as compared to other tonometers were
significantly different in keratoconus patients from those in the normal eyes. The differences
in the biochemical parameters of the keratoconic corneas as compared to the normal eyes
could be responsible for this difference. Bayer et al(55) showed that the dynamic contour tonometer was significantly affected by corneal hysteresis and the corneal resistance factor in
keratoconic eyes. This could be attributed to the design of the dynamic contour tonometer,
which is not an applanation tonometer. The corneal geometrics and viscoelasticity of the
keratoconic eyes could influence the conformable design of the DCT resulting in the
difference in the accuracy of IOP measurement in keratoconic patients as compared to
normals.
The corneal volume is significantly reduced due to corneal tissue loss during progression of
keratoconus.(56,57) However none of the tonometers were affected by the corneal volume..
Modalities of tonometry and corneal thickness (10)
Intraocular pressure describes the tension exerted by the aqueous humor on the intraocular
tissues due to a balance between the production and drainage. Precise IOP measurement is
influenced by variables like the circadian rythem and the influence of corneal biochemical
properties.
An easy to use and reliable and accurate tonometer is desirable for IOP measurements, the
principle of applanation or indentation is the one on which most commercially available
tonometers measure IOP. The force exerted on the external corneal surface is s the pressure at
cavity. This is measured as the force applied (F) to the outer corneal (A). The pressure related
to the corneal propertiesb(Pcp) and (tIOP) gives the true IOP measurements.
(Equation 1) F/A=Pcp+tIOP
This equation takes into consideration the fact that all individuals have identical corneal
thickness and viscoelasticity. However corneal thickness and elastic properties of the cornea
vary depending on the age, race, and corneal abnormalities or even between fellow eyes.
Thus accurate IOP measurements depend on the corneal thickness, curvature and
biomechanical properties.
Tonometers are of two types
1. Applanation – contact and non contact tonometers
2. Non applanation
Applanation tonometers
A. Goldmann Applanation Tonometer
B. This tonometer was developed in the 1950’s and is based on the Imbert-Fick law. This
law states that ―The pressure in a sphere filled with fluid and surrounded by an
infinitely thin and flexible membrane is measured by the counter pressure which just
flattens the membrane to the plane‖. This being an hypothetical model Goldmann and
Schmidt suggested that this would give precise results in the patients having an
average central corneal thickness between 500 and 525 microns.
This tonometer is used worldwide and still remains the Gold standard for tonometry. It was
found by the ocular hypertension study that eyes with thinner CCT are at increased risk of
actual IOP, while in eyes with CCT of more than 555µm, it overestimates IOP.(58) There is no clear evidence to suggest that in case of irregular corneas and in patients post penetrating
keratoplasty and refractive surgery there could be inaccuracies in IOP measurements.
Similarly in keratoconus, high astigmatism and stromal scarring, GAT may show inaccurate
readings due to inaccracy of CCT measurements. Brooks et al(59) stated that GAT measurements were significantly lower at the apex of the cone as compared to measurements
taken at the flatter or thicker areas of the cornea. In keratoconus, the GAT measurements
were approximately 5.3 ± 2.2 mm of Hg lower than that recorded by non applanation
tonometry, which seemed to provide measurements closer the actual intraocular
pressures.(14)
Similar findings have been reported by other authors in patients following penetrating
keratoplasty, LASIK, LASEK and PRK. One should be aware in clinical settings that the IOP
could be over or underestimated in situations with variations in CCT. Since GAT is the Gold
standard for IOP estimation, all other tonometers are compared to readings of the GAT.
.
C. Tono-Pen XL (Mentor O&O Inc; Norwell, MA, USA)
This is a light weight contact electronic applanation tonometer, which is portable and easy to
calibrate and operate. Its digital monitor minimises user bias and due to its small contact area
(2.36mm2 compared to 7.35 mm2 in GAT), it is recommended for IOP measurements in
irregular corneas. It is also useful when patient is not cooperative, allowing measurements in
both supine and sitting positions. A minimum of four measurements is necessary to get an
average value. It also provides a coefficient of variation which ideally should be less than five
However studies have shown that Tonopen does over or underestimate IOP without a
consistent pattern. Salvetat et al(60) found that Tonopen underestimated GAT by 0.5 ± 4.5 mmHg. In eyes with CCT>584 microns the Tonopen tends to consistently give readings,
higher than GAT. With regard to irregular corneas Mollan et al(9) evaluated IOP with four different tonometers in eyes with keratoconus and found that Tonopen overestimated GAT by
3.6 ± 10.1mmHg. He also found in this group of patients that as compared to GAT readings
the Tonopen overestimated IOP values for lower IOPs (by GAT) and underestimated the
higher IOPs compared to the GAT measurements. It seemed to be less dependent on CCT in
keratoconus that GAT. Though it may prove useful in irregular corneas due to its smaller
contact area the results should be interpreted with caution especially in eyes with increased
CCT.
D. Perkins Handheld Tonometer (Medtronic Solan, Jacksonville, FL, USA)
The Perkins applanation tonometer is a portable handheld device, considered to be the gold
standard for portable tonometry. Few studies have shown a close agreement between the
Perkins tonometer and GAT.(61,62) with a mean difference of 1.0 mmHg between the two tonometers.(61)
It is useful for the determination of the daily curve of IOP in the supine position. As
breath-holding (required for GAT measurements, taken in sitting position) and thus thorax
compression may cause transitory elevations of IOP, the Perkins tonometer may provide
more reliable measurements in cases where a transitory high IOP is recorded in sitting
E. Corneal Hysterisis & the Ocular Response Analyser (Reichert Ophthalmic
Instruments, Depew, New York, USA
Corneal Hysteresis (CH) is an indication of viscous dampening of the cornea, reflecting the capacity of the corneal tissue to absorb and dissipate energy. It is a biomechanical property(64) of the corneal tissue to recover its original shape after an external force is applied. CH is weakly correlated with CCT, is almost constant throughout the day(65) and seems un-associated with refractive error or axial length.(27,66)
Keratoconus corneas are associated with low corneal hysteresis.(9) The Ocular response analyser is an instrument capable of measuring the corneal hysteresis. It is a fully automated stand-alone non-contact tonometer with an electro-optical system that scans the central cornea. It uses a bi directional applanation process in which an air pulse deforms the cornea inwards past the applanation point. After the applanation point is detected the air is turned off and the cornea is allowed to return to normal. Two independent pressure values are derived from these applanation points. The difference between the two measurements (inward and outward applanation) is termed corneal hysteresis.
Even though the overall difference between GAT IOP and IOPcc was not significant, it tended to be bigger for increasing CCT values. ORA has been used in keratoconus to study the IOP, CRF and CH.(69)
F. Non-contact Tonometer or Air-puff Tonometer (Reichert Ophthalmic
Instruments, Depew, New York, USA)
This is a non contact applanation tonometer initially created in the 1950’s by Grolman for
faster and simpler screening of IOP by optometrists. Briefly, an air-puff causes a transient
applanation of the cornea, while an infrared light beam is reflected by the flattened surface.
The amount of light reflected during the applanation period is compared with the time the
air-puff took to cause applanation, allowing this device to provide an electronic measurement of
the IOP. It also provides the ocular pulse amplitude (OPA) and tonographic measurements
that estimate the aqueous outflow efficiency of the trabecular meshwork according to
manufacturer information.
Modern non-contact tonometers have been found to correlate very well with GAT IOP, even
though they tend to systematically overestimate IOP by 0.12–0.58 mmHg.(72–74)
Non contact tonometers are likely to be more influenced by CCT than GAT. In thinner
corneas, there seems to better correlation between the tonometers, while in thicker corneas,
non-contact tonometry systematically yields higher readings than GAT.(75) The device is less operator dependent and there is no risk of infection transmission. (72 -74)
G. Pneumato-tonometer (Mentor model 30, Classic Reichert, USA) c
required to take the measurement. The air puff causes a transient applanation of the cornea and the infrared beam is reflected by the flattened surface. The amount of light reflected during the applanation period is compared with the time the air puff took to cause applanation. It provides real time readings of IOP through a non invasive applanation method. It can be used to measure IOP in contact-lenses wearers.(76) It significantly underestimates GAT measurements at lower IOP and overestimates these at higher IOP.(77) For example, for GAT IOP measurements <10 mmHg, the difference is around 2.0 mmHg, while for GAT IOPs ≥25, the difference is 0.6 (GAT - pneumotonometer et al). Also, as the GAT values increase, the pneumatonometer increasingly overestimates IOP.(77) In eyes with keratoconus, the pneumatonometer underestimates IOP by about 1.5 mmHg lower than GAT.(14) Similar to the air-puff tonometer, this device is a screening tool which can be easily used by non-specialized personnel.
Non Applanation Tonometry Devices
A. Dynamic Contour Tonometry - Pascal Tonometer (SMT, Swiss Microtechnology
AG, Zurich, Switzerland
DCT is a relatively new digital tonometer, mounted on the slit-lamp and uses the principle of contour matching instead of applanation. The tip of the tonometer has a concave surface and allows the cornea to maintain its natural shape; when pressure on both sides are equal and corneal distortion is minimal.
appositional force of one gram on the cornea and when the piezo-resistive pressure sensor is subjected to a change in pressure, the electrical resistance is altered and the tonometer’s computer calculates a change in the pressure according to a change in the resistance. The DCT measures the diastolic intraocular pressure and the Ocular pulse amplitude (OPA). Addition of the diastolic IOP to the OPA gives the value of systolic IOP. (Diastolic IOP + OPA= systolic IOP).
The OPA represents the average difference between the systolic and diastolic IOP within 6 heart beats. The OPA provides an alternate measure of the ocular blood flow.(78)
The DCT is said to be largely independent on the structural properties of the cornea and give an IOP recording which is closer to the true IOP.(11,13,79)
Many studies have shown that the DCT gives an accurate recording in patients with keratoconus,(14–16) corneal edema (17), post penetrating keratoplasty(11,15,80) and refractive surgery.(29,50) The DCT provides a quality check score (Q) and it ranges from 1 which is the optimum value to 5 which is unacceptable. For clinical and research purposes a score of 1 or 2 is considered reliable according to the manufacturer’s information.
Most of the studies are on agreement that DCT tends to overestimate GAT by about 2.3 -3.4
mmHg, depending on the IOP level, CCT and other corneal properties.(11,13,50,60) Milla et al(81) found an optimal agreement between DCT and GAT when the CCT was between 540 and 545 μm. As the CCT and the IOP increased, the difference between both tonometers also
increased.(60)
In eyes with keratoconus, the difference between DCT and GAT ranged from 4.3 to 5.3
mmHg with DCT recording higher values than GAT.(9,14,16) DCT seems to be largely independent of CCT in those patients. In eyes that had undergone keratoplasty and refractive
surgery, DCT seems to be less influenced by changes in corneal properties following these
with the increasing evidence of being largely independent of corneal properties, tonometry
with DCT is a promising tool in clinical practice.
B. Tonometry-I care tonometer (Tiolat, Helsinki Finland)
This contact tonometer is based on the rebound principle described by Dekking and Coster in 1967. It uses a light probe containing a permanent magnet that is launched towards the eye using a solenoid. The probe hits the eye and bounces back. The same solenoid, inside which moves the probe, is used to detect the movement and impact of the probe, because the moving magnet induces voltage in the solenoid. The motion parameters measured during impact are used to estimate the IOP.(84,85)
It is a handheld, portable tonometer that displays the IOP reading digitally and does not require topical anaesthesia. Following 6 measurements, the device automatically determines the mean pressure and the standard deviation. It can be easily used by the patient himself and by non-specialized personnel.
Recent reports about its accuracy have been conflicting. Van der Jagt and Jansonius(86) found that I-Care slightly overestimated GAT by 0.6 mmHg (mean difference between 0.0 and 1.2 mmHg) even though this was not significant. On the other hand, Nakamura et al(60,84,87–89) studying a population that ranged from normal subjects to ocular hypertensives and glaucoma patients found that I-Care overestimated IOP, as compared to GAT, by 1.40±4.29 mmHg, and that this disparity tended to increase along with corneal thickness. They suggested that corneal thickness could affect the duration of the impact of the rebound tonometer, causing an overestimation in thicker corneas.
measurements taken with the I-care tonometer. Measurements with I-Care should always be interpreted with regard to CCT when used in a clinical basis.
C. Phosphene Tonometry (Proview, Bausch & Lomb Pharmaceuticals, Inc., Tampa,
Fla.)
The pressure phosphene tonometer (PPT) is a self-tonometry device that was first described in 1998(91).It uses the entoptic phenomenon of pressure phosphene to evaluate IOP.(92,93) The PPT is initially applied perpendicular to the eyeball through the partially closed eyelid and the applied pressure is increased gradually until the moment when the patient clearly perceives a dark circle with a ring of light around the outer circumference (well-formed phosphene).The device is then removed from the eyelid and IOP can be read from the dial.(92,93)
The PPT presents several advantages, as it is a non contact device which does not need to be applied on the cornea but on the lid so there is no need of a topical anaesthetic. It is not influenced by corneal biomechanical properties and can be used to measure patient-specific, diurnal variations/.(91–93) . It has also been reported to have good reproducibility when used by patientsits accuracy is controversial.(94)
To summarise various types of tonometers as listed above are available commercially each of them having their own specific advantages and disadvantages. In general these devices are clinically used for diagnosis and patient follow up and also as a screening tool.
measurement but for a regular follow up of the same patient and to assess the reduction in IOP after treatment is started.
The GAT measurements however remain irreplaceable because most studies available evaluate efficacy of procedures and efficacy of anti-glaucoma drugs on the basis of GAT values. Hand held tonometers show a fairly good agreement with GAT except for PPT and are good devices for screening purposes. Tonopen with reduced surface area and ease of use is useful in uncooperative patients with irregular corneas where accuracy of measurement can be affected. Newer devices like the ORA and DCT provide information not only on IOP but ocular hysteresis also.
It has helped build all the available knowledge regarding aqueous humour dynamics and IOP monitoring and remains a module for comparing all other devices. Readings from newer IOP devices should not be interchanged even in the normals and the same device should be used by the clinician depending on which one suits best for a particular patient.
Summary of Tonometers
Tonometers Portability Accuracy Relative to GAT Accuracy Irregular Corneas Accuracy Corneal Thickness
GAT - - -
Perkins + Good
concordance
- -
Tonopen + Depends on
IOP level
- -
ORA - Overstates + +
NCT
+/- Depends on device model and IOP level
- -
DCT - Overstates - +
Pneumotonometer + Overstates + -
Review of important studies
Studies in normal patients
In a prospective study by Kauffmann et al comparing GAT and DCT in normal eyes (n=228), IOP measurements and analysis of the effects of CCT, corneal curvature, axial length, and anterior chamber depth was done. Intra- and inter observer variability was evaluated by measuring the IOP in 8 eyes by 4 observers. A high concordance was shown between the IOP readings obtained by DCT and GAT. However, IOP readings were persistantly higher with DCT than with GAT. Regression analysis showed no effect of the CCT and other factors on the DCT. They concluded that DCT IOP was highly acordant with GAT IOP readings but do not vary with variations in CCT and have a lower intra- and inter-observer variability. They concluded that DCT was an appropriate tonometer for routine clinical use.
Tonnu et al (n=105), measured IOP in patients with glaucoma and ocular hypertension using GAT, Tonopen, Ocular Blood flow Pneumotonometer (OFB), and Canon TX-10 non-contact tonometer (NCT). Independent observers took three IOP measurements with each instrument, and two with GAT. They obtained mean IOP differences of 0.4 mmHg between GAT observers, and 0.6 mmHg, 0.1 mmHg, and 0.7 mmHg between GAT and Tonopen, OBF, and NCT, respectively. A moderate inter-instrument concordance was shown between the NCT and GAT and poor concordance between the Tonopen and OBF with GAT. The differences between the GAT and OBF and between GAT and Tonopen, thereby probably interdicting the OBF and Tonopen from routine clinical use as objective tonometry methods to measure IOP in normal eyes.
59 (SD 0.36). They showed a correlation (r =0.83) in normal eyes, but tonopen overestimated the IOP (p<0.001) in these eyes. They concluded that the tonopen consistently overestimated the IOP in an unpredictable pattern.
Studies in Keratoconus
In a prospective study by Papastergiou et al (n=156), IOP measurements in keratoconus (n=64) was compared with age matched controls using GAT, DCT, and the NCT. In the control group (n=92), an interrelation between DCT, GAT, and NCT IOP measurements was noted. In keratoconus, GAT and NCT IOP measurements were incomparably lower than DCT measurements (5.3 ± 2.2 mmHg and 4.75 ± 1.7 mmHg, respectively). DCT IOP in both groups was not significantly affected by CCT.
Schadle et al, measured IOP in 114 eyes with keratoconus using GAT and DCT in a randomized order. The Pentacam recorded the CCT, minimal corneal thickness (MCT), and corneal topography. In all the four groups of keratoconus with variable CCT and MCT values, depending on the grade of Amsler's classification were evaluated. The study showed that DCT IOP was higher than GAT IOP (mean difference 1.6 ± 2.6 mmHg). In keratoconus, both methods seem to be independent of CCT and therefore are equally, but not interchangeably, applicable when monitoring IOP. They concluded that both GAT and the DCT are equally suitable for determination of IOP in keratoconus which are independent of the thickness of the cornea. However, for clinical monitoring one should always use the same measurement techniques since the DCT measures approximately 1.6 mmHg higher pressures as compared to GAT. Further analysis revealed that the CCT and MCT were notably different in corneas of different Amsler grade
Meyenberg et alcompared DCT with GAT in 30 eyes with keratoconus and 29 eyes
following Penetrating Keratoplasty (PK). GAT and DCT IOP values were taken in these eyes after pachymetry and corneal topography. DCT IOP was significantly higher than GAT IOP in both study groups (4.1 ± 2.3 mmHg in keratoconus and +3.1 ± 2.5 mm Hg after PK.) In comparison to DCT, GAT IOP was significantly higher in PK eyes than in keratoconus. The correlation between the two tonometry methods was moderate in both groups. In
the keratoconus group, it was seen that DCT gave a significantly higher IOP value than GAT in both groups. IOP measured with DCT and GAT showed a considerable variation, however DCT was not completely independent of biomechanical properties of irregular corneas than when compared to GAT.
three patient groups were significantly higher when measured by OBF pneumotonometer. A Linear regression analysis was done which showed that patients with FED had a significant increase in IOP with increasing CCT of 0.18 mm Hg/10μ using GAT, 0.15mmHg/10μ with the tonopen, and 0.26 mmHg/10μ with the OBF pneumotonometer. In patients with Keratoconus and after PK, linear regression analysis did not reveal any significant consequence of CCT on IOP. A multivariate linear regression model controlling for age, sex, graft size, and patient group, showed that the effect of CCT on Tonopen IOP (0.13 mm Hg/10 μ CCT) and GAT (0.14 mm Hg/10 μ CCT) were significantly lesser than for the OBF pneumotonometer (0.26 mm Hg/10 μ CCT) They found that the mean IOP values using the OBF pneumotonometer were significantly higher than those made using the GAT or Tonopen in all these corneal pathologies. The OBF pneumotonometer was found to be most afflicted by alteration in CCT. For all three instruments, the affinity between IOP and CCT depended on the corneal pathology and was immense in FED.
Jackson Barreto et alcompared DCT with GAT in 10 keratoconus patients and 12 normals. It was found that the DCT readings were higher than GAT in keratoconic patients but lower than the DCT readings in the control group. The dissemblance between both methods was statistically significant in keratoconus (P < 0.0002) This may have been probably due to discrepancy between the radius of corneal curvature in keratoconus and the DCT tip, the significant thinning of these corneas, or other corneal biomechanical abnormalities like abnormal hysteresis.
enlisted in the study which included 29 eyes of patients with keratoconus, 21 eyes after PK for keratoconus and 3 eyes with PMD. Severity of ectasia was determined by videokeratography and ultrasound pachymetry. Mean GAT, DCT and Tonopen IOP were 14.3 ± 4.1, 16.1 ± 2.9 and 13.8 ± 4.1 mm Hg, respectively. The differences of mean IOP values between GAT and DCT and Tonopen and DCT were statistically significant, whereas the difference between GAT and Tonopen was not. Both GAT and Tonopen IOP values were significantly higher in the PK eyes than the KC and PMD eyes, whereas DCT IOP value was not. DCT values were not significantly different in PK versus non-PK eyes It was found that DCT provided a higher IOP than Tonopen and GAT in both keratoconus and PMD and DCT gave the same values in both conditions. The DCT IOP was not influenced by the CCT which will probably make it more reliable in measuring IOP in patients with keratoconus and PMD
controls and independent of the biomechanical properties of cornea, where as NCT appeared to be dependent on corneal biomechanical properties
.
In a prospective study by Attila Bayer et al; to determine the agreement between DCT, GAT, and ORA in keratoconus and the effect of corneal biomechanics on IOP values obtained by these devices. IOP values were obtained with the ORA, DCT, and GAT in random order in one hundred twenty eyes of sixty keratoconus patients after they underwent a BCVA, slit lamp biomicroscope examination and corneal topography. The mean CCT obtained was 464.08 ± 58.4μ. The mean difference between IOPcc and GAT, IOPcc and DCT, GAT and DCT, IOPg and GAT and IOPg and DCT was greatly statistically significant. A multivariate regression analysis showed DCT IOP and GAT IOP values were significantly associated with CH and CRF (P<0.0001) for both groups and it was found that DCT seemed to be dependent on CH and CRF and DCT IOP tended to be higher in comparison to GAT IOP. ORA measured IOPcc and this value was not dependent on the CCT and was in contrast to the IOP measured with DCT in keratoconus.
MATERIALS &
Materials and Methods
Study Design
This is a case control study conducted in the department of Ophthalmology, Christian Medical College Vellore from August 2013 – September 2014.
Study population
Cases: Patients with keratoconus who are recruited from the outpatient department of the department of Ophthalmology, Christian Medical College, Vellore.
Controls: Normal patients who are recruited from the outpatient department of the department of Ophthalmology, Christian Medical College, Vellore.
Inclusion criteria for Cases/Keratoconus
Keratoconus was diagnosed based on any one or more of the following signs.
External signs; Rizzuti’s sign, Munson’s sign,
Scissoring reflex on retinoscopy
Slit lamp findings of Fleicher’s ring or Vogts striae or corneal thinning and
Inclusion Criteria for normals (controls)
Normal individuals were defined as
Age less than 40 years
Emmetropes, myopes, hyperopes and regular astigmatism upto 2D
No ocular pathology seen on slit lamp examination
Regular axial topography pattern (round, oval or symmetric bow tie)
Average corneal power < 47.5D & flat Keratometry> 38.50D
Keratoconus Prediction Index less than 0.23as recorded by videokeratography.
Exclusion criteria for cases and controls
Corneal epithelial defects, scarring and oedema,
Uveitis,
Un-cooperative patients,
Presence of nystagmus
DCT fails to give a quality factor of 1 or 2 after 3 attempts
Institutional Review Board
Methodology
This is a prospective comparative case series.
Among patients attending the out-patient department of Ophthalmology, Christian Medical College, Vellore patients diagnosed as keratoconus and as normals underwent a videokeratography (TOMEY, topographic modelling system IV, Japan). Those satisfying clinical and videographic criteria (ANNEXURE VI) for cases and controls were invited for the study. The study procedure was explained to the patients.
Those agreeing to participate in the study were recruited into the study after signing the informed consent. All the IOP recordings were done by the principal investigator.
After topical application of a local anaesthetic Paracain (Proparacaine hydrochloride 0.5%), first the IOP was measured with the Goldmann Applanation Tonometer (GAT), (Haag Streit, Koeniz, Switzerland), 2 recordings were taken in both eyes within a period of 1 minute ; in keratoconus patients the two readings were taken with one in the axis of astigmatism and the other 90 degrees opposite to it in a period of 1 minute. The second method of measurement of IOP was with the Dynamic Contour Tonometry (DCT) (PASCAL, Ziemer Switzerland); 2 readings were obtained from both eyes, with quality factor of 1 or 2, the second reading was taken after 2-3 minutes. The third method of measurement of IOP was with a Tonopen AVIA (Reichert, Buffalo NY) and 2 consecutive recordings with 5% standard deviation within a period of 1 minute were obtained from both eyes. As the DCT and tonopen provided a readout on liquid crystal display, prior knowledge of the GAT result would not influence the result and made it unnecessary to randomize the IOP measurements, but however the investigator was masked to the results.
The principal IOP recordings (values) were noted down by an optometry student/intern so as to prevent bias. The tests were repeated after one hour to look for the reproducibility of IOP with these instruments. Following recording of intraocular pressures, the central corneal thickness was recorded in all recruits using an ultrasound pachymeter (SP -100, TOMEY, USA) by an experienced optometrist.
Statistical Analysis of Data
Sample Size Calculation
Sample size calculation was based on the desired precision of Intraclass Correlation (ICC).
The desired lower limit of 0.50 for ICC's of 0.70, 0.65 and 0.60 (interval widths of 0.40, 0.30 and 0.20 respectively)
for 3 measurements require 67, 149 and 398 respectively. We decided to aim for a total sample size of 100. This
sample size would also meet the requirements for the Bland- Altman analysis
ICC Prescision Confidence Interval Sample Size
1. 0.70 0.20 95% 67
2. 0.65 0.15 95% 149
3. 0.60 0.10 95% 398
In view of comparison between the two groups a sample size of 100 in each group was arrived at.
Results
A total of 173 eyes of 141 patients were evaluated and included in the study. Two groups of patients were studied. There were 73 eyes from 41 keratoconus patients (cases) and 100 eyes of 100 normal patients (controls) included in the study.
Demographic Profile
Their demographic profile is shown in table 1 and 2
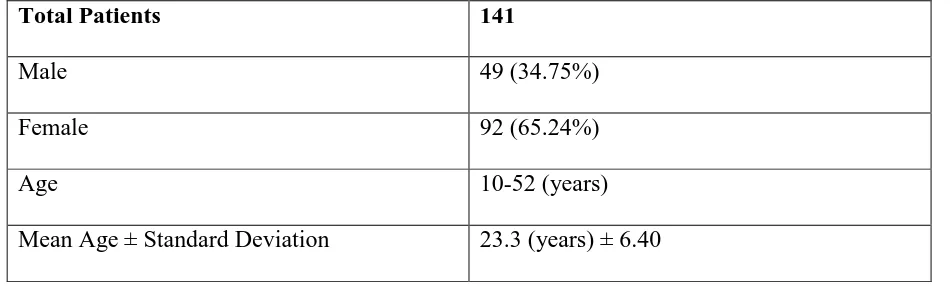
Table1: Demographic Profile of all patients
Total Patients 141
Male 49 (34.75%)
Female 92 (65.24%)
Age 10-52 (years)
[image:50.595.63.538.315.458.2]Mean Age ± Standard Deviation 23.3 (years) ± 6.40
Table 2: Demographic Profile of cases and controls (N=141)
Patients Cases (n=41) Controls (n=100)
Male 18 (43.90%) 31 (31%)
Female 23 (56.09%) 69 (69%)
Age 10-52 (years) 13-38 (years)
Mean Age ± Standard Deviation 22.3 (years) ± 8.1 24.4 (years) ± 4.49
56.09 % of the cases were females and the age ranged from 10 to 52 years. 69% of the
Gender Distribution
[image:51.595.73.446.183.422.2]The graph below depicts the gender distribution of our study population.
Figure 1: Gender distribution in cases and controls
Majority of the participants in our study population were females
0 10 20 30 40 50 60 70
Cases N =41 Controls N =100
Males
Females 23
18
69
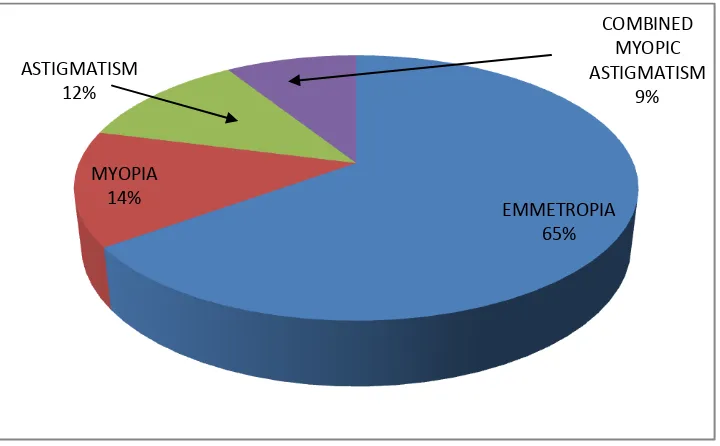
Refractive errors in control group
We studied the distribution of refractive errors among controls
[image:52.595.74.434.221.444.2]Distribution of refractive errors among controls as shown in Figure 2
Figure 2 Distribution of refractive error among controls
In the control group 65% of eyes had emmetropia
EMMETROPIA 65% MYOPIA
14% ASTIGMATISM
12%
COMBINED MYOPIC ASTIGMATISM
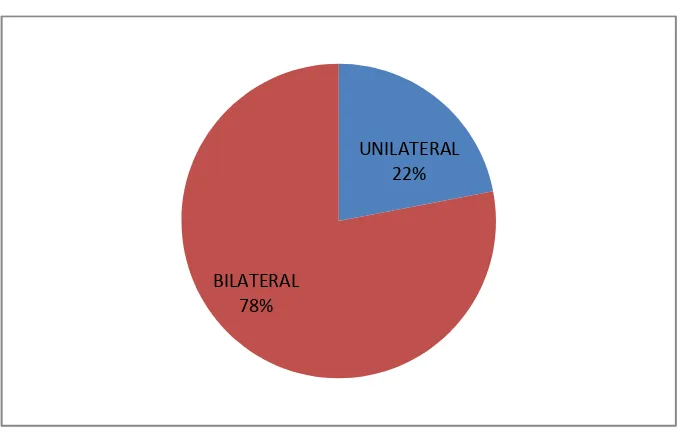
Laterality among Keratoconus
The number of patients who had unilateral or bilateral keratoconus is depicted in figure 3
Figure 3 Unilateral vs Bilateral (n=41)
78% of the cases had bilateral keratoconus
Keratometry Reading
[image:53.595.72.420.177.393.2]We studied the minimum or the flat keratometry readings of the cases and controls and they are given in Table 3
Table 3 Flat Keratometry Reading
Patient Keratoconus Controls
Mean Flat K ± SD 53.18 D ± 5.47 44.61D ± 1.5
Range 43.47 D – 67.40D. 41.37 D –47.48D
Flat keratometry reading ranged from 43.47 to 67.40 D among the keratoconus
UNILATERAL 22%
Signs of Keratoconus
We looked at the classical described signs of keratoconus in our patients and they are described in table 4
Table 4 Signs of Keratoconus
Signs of Keratoconus No of eyes
Munson’s sign 38
Vogt’s striae 54
Fleicher’s Ring 47
Intraocular Pressure (IOP) measurements
We studied the distribution of the IOP measurements with the three different tonometers in keratoconus and the results are shown in table 5
Table 5 IOP in keratoconus with GAT, DCT & Tonopen
Tonometer Mean IOP (mmHg) ± SD Range (mmHg)
Goldmann Applanation Tonometer 12.06 ± 2.12 8-16 Dynamic Contour Tonometer 14.83 ± 2.49 10-21
Tonopen 12.34 ± 1.88 8-17
The IOP measured with DCT was noted to be higher than with GAT and Tonopen in
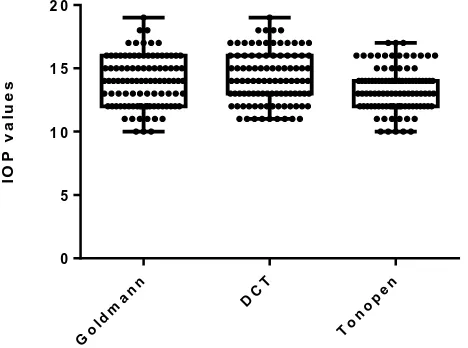
Box and Whisker plot
The box and whisker plot shows the mean and range of IOP as obtained by the various tonometers among normals and keratoconus
The IOP distribution in keratoconus as obtained by GAT, DCT and Tonopen is shown in Figure 4.
Figure 4Box and Whisker plot of IOP distribution in keratoconus
In keratoconus the 50th percentile was 12mm Hg for GAT, 14mm Hg for DCT and 12mm Hg
for tonopen.
The distribution of IOP measurements with the three different tonometers among normals are shown in table 6
Table 6 IOP in control group
Tonometer Mean IOP (mmHg) ± SD Range (mmHg)
Goldmann Applanation Tonometer 13.94 ± 1.96 10-19 Dynamic Contour Tonometer 14.22 ± 2.04 11 -19
Tonopen 13.36 ± 1.70 10-17
Figure 5 Box and Whisker plot of IOP distribution in control Eyes
In the control group the 50th percentile was 14mm Hg for GAT, 14mm Hg for DCT and 13mm
Hg for Tonopen.
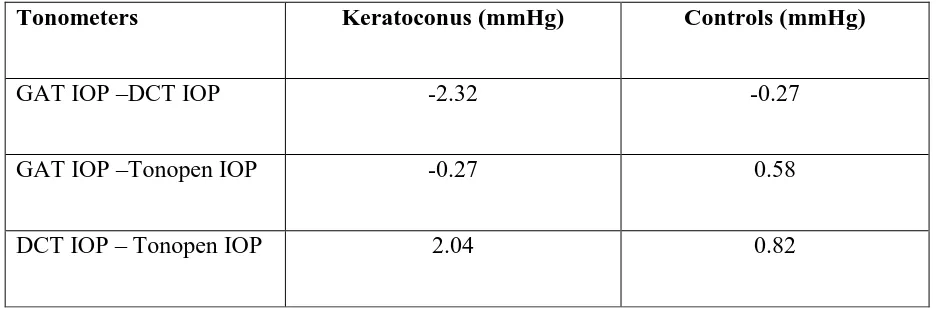
Intraocular Pressure difference
[image:59.595.64.532.249.404.2]We analysed the mean difference in IOP between the various tonometers in patients with keratoconus and normals and the results are shown in table 7
Table 7 Mean Difference in IOP between cases and controls
Tonometers Keratoconus (mmHg) Controls (mmHg)
GAT IOP –DCT IOP -2.32 -0.27
GAT IOP –Tonopen IOP -0.27 0.58
DCT IOP – Tonopen IOP 2.04 0.82
The mean difference in IOP between the tonometers was different for keratoconus and
Intraclass correlation coefficient (ICC)
We analysed the ICC for the three tonometers in both cases and controls and the results are shown in table 8
Table 8 Intraclass Correlation between tonometers in cases and controls
Tonometers ICC (keratoconus) with 95% CI
P value ICC (controls) with 95% CI
P value
GAT -DCT 0.62 (-0.09 – 0.84) <0.001 0.64 (0.42 -0.77) <0.001
GAT-Tonopen 0.83 (0.73 -0.89) <0.001 0.81 (0.68 – 0.88) <0.001
DCT-Tonopen 0.51 (0.46 -0.61) <0.001 0.59 (0.25 -0.57) <0.001
In both keratoconus and controls a fair to good agreement was shown between GAT and
DCT, an excellent agreement between Tonopen and GAT and a fair agreement between DCT
Mean IOP
[image:61.595.66.527.189.369.2]We analysed the median IOP with the three tonometers among keratoconus and controls and the results are given in Table 9
Table 9 Mean IOP in Keratoconus and controls
Tonometers Mean ± SD Median ± SD Mean Median
GAT 12.06 ± 2.12 12 13.94 ± 1.96 14
DCT 14.83 ± 2.49 14 14.22 ± 2.04 14
Tonopen 12.34 ± 1.88 12 13.36 ± 1.70 13
The median (inter quartile range [IQR]) of GAT IOP among keratoconus was 12 (10 -14). Similarly the median (IQR) of GAT IOP among controls was 14 (12 -16). There was a statistical significant difference in the median GAT IOP values among cases and controls (p value< 0.001).
The median (IQR) of DCT IOP among keratoconus was 14 (12 -16). Similarly the median (IQR) of DCT IOP among controls was 14 (12 -16). There was no statistical significant difference in the median DCT IOP values among cases and controls (p value = 0.80
The median (IQR) of Tonopen IOP among keratoconus was 12 (11 -13). Similarly the median (IQR) of Tonopen IOP among controls was 13 (12 -14). There was a statistical significant difference in the median Tonopen IOP values among cases and controls (p value< 0.001). There was a statistical significant difference in the median Tonopen IOP values among keratoconus and controls (p value< 0.001).
Keratoconus Cases
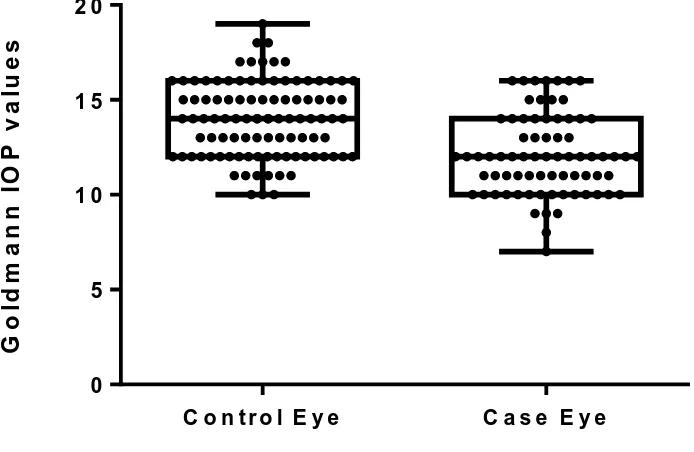
Box and Whisker plot of IOP distribution
[image:62.595.90.437.234.460.2]The IOP distribution with GAT, DCT and Tonopen among keratoconus and controls using the Box and Whisker plot are given in Figures 6, 7 and 8.
Figure 6 Box and Whisker plot of IOP distribution with GAT among keratoconus and controls
The GAT IOP values were higher in the controls than those obtained in keratoconus.
G o ld m a n n I O P v a lu e s
C o n t r o l E y e C a s e E y e
Figure 7 Box and Whisker plot showing IOP distribution with DCT among keratoconus
and controls
The DCT IOP values were similar in keratoconus as well as controls
D
C
T
I
O
P
V
a
lu
e
s
C o n t r o l E y e C a s e E y e
Figure 8 Box and Whisker plot of IOP distribution with Tonopen among keratoconus and controls
The Tonopen IOP values were slightly less in keratoconus than in controls.
. T o n o p e n I O P v a lu e s
C o n t r o l E y e C a s e E y e
Correlation analysis of IOP measurements
[image:65.595.92.501.256.576.2]Figure 9 shows the correlation analysis of IOP measurements (mm Hg) when taken with DCT and GAT in keratoconus eyes. The Univariate Linear Regression analysis method was used and the correlation was statistically significant (r2 = 0.27, P < 0.001).
Figure 9 Scatter plot of GAT and DCT along with Best Fit line and its 95% CI
In the regression analysis in keratoconus group between DCT and GAT, it was shown that
for every 1 mmHg rise of IOP with the Goldman applanation tonometer there was a
0.60mmHg rise of IOP with the DCT. The GAT values correlated well with DCT in the
Figure 10 shows the correlation analysis of IOP measurements taken with DCT and GAT in the control group. The correlation was significant (r2 = 0.18, P < 0.001).
Figure 10 shows the scatter plot of GAT and DCT along with Best Fit line and its 95%
CI
In the control group s the IOP increased by 1mm Hg with GAT there was an increase in
0.44mm Hg with the DCT, p < 0.001). The correlation between DCT and GAT was
Figure 11 shows the correlation analysis of IOP measurements when taken with Tonopen and GAT in the keratoconus group. The correlation was significant (r2 = 0.51, P < 0.001).
Figure 11 Scatter plot of Tonopen and GAT along with Best Fit line and its 95% CI
In the regression analysis between Tonopen and GAT in the keratoconus group, it was shown
that as IOP measured with GAT increased by 1mmHg there was an increase in 0.63mmHg
with the Tonopen (p < 0.001). The Tonopen and GAT IOP measurements correlated well in
Figure 12 shows the correlation analysis of IOP measurements when taken with Tonopen and GAT in the control group. The correlation was significant (r2 = 0.51, P < 0.001).
Figure 12 Scatter plot of Tonopen and GAT along with Best Fit line and its 95% CI
In the regression analysis between Tonopen and GAT in the control group, , it was shown
that as IOP measured with GAT increased by 1mmHg there was an increase in 0.62mmHg
with the Tonopen (p < 0.001). The Tonopen and GAT IOP measurements correlated well in
Figure 13 shows the correlation analysis of IOP measurements when taken with DCT and Tonopen in keratoconus group. The correlation was significant (r2 = 0.43, P < 0.001).
Figure 13 Scatter plot of DCT and Tonopen along with Best Fit line and its 95% CI
In the regression analysis between DCT and Tonopen in the keratoconus group, it was shown
that as IOP measured with Tonopen increased by 1mmHg there was an increase in
0.87mmHg with the DCT. The DCT and Tonopen IOP measurements correlated well in
keratoconic eyes.
Figure 14 shows the correlation analysis of IOP measurements when taken with DCT and Tonopen in controls. The correlation was significant (r2 = 0.27, P < 0.001).
Figure 14 Scatter plot of DCT and Tonopen along with Best Fit line and its 95% CI
In the regression analysis between DCT and Tonopen in controls, it was shown that as IOP
measured with Tonopen increased by 1mmHg there was an increase in 0.61mmHg with the
Correlation of IOP with Central Corneal Thickness (CCT)
The CCT among keratoconus and controls is given in Table 10
Table 10 Mean CCT in cases and controls
Parameters Keratoconus Controls
Mean CCT (μ) ± SD 457.16 ± 4.68 520.37 ± 2.89
Range 325 -552 440-577
The mean CCT in the keratoconus group was 457.16μ and in the control group was 520.37μ
Table 11 Mean CCT and IOP in cases and controls
Group Mean CCT
(μ)
Mean IOP GAT
(mmHg)
Mean IOP DCT
(mmHg)
Mean IOP Tonopen
(mmHg)
Cases 457.16 ± 4.68 (325 -552)
12.068 ± 2.12 (8-16)
14.83 ± 2.49 (10-21)
12.342 ± 1.88 (8-17)
Controls 520.37±2.89 (440-577) 13.94 ±1.96/ (10-19) 14.22±2.0 (11 -19) 13.36±1.70 (10-17)
IOP measured with DCT was noted to be higher than with GAT and Tonopen in the
keratoconus group, but in the control group, DCT values obtained were similar to that
The co relation between GAT IOP and CCT in the keratoconus and control group is shownin Figure 15 and 16
Figure 15Scatter plot of GAT IOP against CCT in keratoconus along with best fit line
The correlation coefficient of GAT IOP and CCT in the keratoconus group was found to be 0.20 and this was not statistically significant (P = 0.091)
Figure 16Scatter plot of GAT IOP against CCT in the controls along with best fit line.
The correlation coefficient of GAT IOP and CCT in the control group was found to be 0.13 and this was not statistically significant (P = 0.195).
The co relation between DCT IOP and CCT in the keratoconus and control group is shown in Figure 17 and 18
Figure 17 Scatter plot of DCT IOP against CCT in keratoconus along with best fit line
The correlation coefficient of DCT and CCT in keratoconus group was found to be 0.10 and this was not statistically significant (P = 0.451).
Figure 18 Scatter plot of DCT IOP against CCT in controls along with best fit line
The correlation coefficient of DCT and CCT in controls was found to be 0.04 and this was not statistically significant (P = 0.661).
The co relation between Tonopen IOP and CCT in the keratoconus and control group are shown in figures 19 and 20
Figure 19 Scatter plot of Tonopen IOP against CCT in keratoconus
The correlation coefficient of Tonopen IOP and CCT in the keratoconus group was found to be 0.17 and this was not statistically significant (P = 0.135).
Figure 20 Scatter plot of Tonopen IOP against CCT in controls
The correlation coefficient of Tonopen and CCT in the control group was found to be 0.09 and this was not statistically significant (P = 0.369)
There was poor correlation of DCT and Tonopen IOP with CCT in both groups but a near
significance with GAT IOP was seen in both group (cases and controls)
Bland Altman Analysis of agreement between GAT, DCT and Tonopen
Table 12 Bland Altman Analysis of agreement between GAT, DCT and Tonopen IOP in
keratoconus
Tonometer Men difference ± SD (mmHg) 95% Limits of Agreement(mmHg)
GAT – DCT -2.31 ± 2.28 -6.79 to 2.16
GAT – Tonopen -0.27 ± 1.52 -3.27 to 2.75
Figure 21 Bland – Altman plot showing agreement between GAT and DCT IOP
The mean difference between GAT IOP and DCT IOP was -2.32 ± 2.28 (-6.79 to 2.16).. A systematic error of -2.31 was revealed. For greater values of GAT IOP, the DCT showed a positive value.
B la n d - A lt m a n P lo t o f G o ld m a n n & D C T ( C a s e E y e s )
A v e r a g e
D
if
fe
r
e
n
c
e
0 5 1 0 1 5 2 0
Figure 22 Bland – Altman plot