“A STUDY TO EVALUATE THE EFFECTIVENESS OF LAUGHTER THERAPY ON DEPRESSION AMONG ELDERLY PEOPLE IN SELECTED
OLD AGE HOME, ERODE DISTRICT.”
THE TAMILNADU DR M.G.R. MEDICAL UNIVERSITY
Of the requirements for the degree of
Sri Adichunchanagiri Shikshana Trust ®
Dharmarathnakara Dr.Mahalingam Institute of
1
“A STUDY TO EVALUATE THE EFFECTIVENESS OF LAUGHTER THERAPY ON DEPRESSION AMONG ELDERLY PEOPLE IN SELECTED
OLD AGE HOME, ERODE DISTRICT.”
By
301231351
Dissertation Submitted to
THE TAMILNADU DR M.G.R. MEDICAL UNIVERSITY
Chennai, Tamil Nadu
In partial fulfilment
Of the requirements for the degree of
Master of Science
In
Mental Health Nursing
Sri Adichunchanagiri Shikshana Trust ®
Dharmarathnakara Dr.Mahalingam Institute of Paramedical Sciences and Research,
Sakthi Nagar, Bhavani, Erode.
APRIL 2014
“A STUDY TO EVALUATE THE EFFECTIVENESS OF LAUGHTER THERAPY ON DEPRESSION AMONG ELDERLY PEOPLE IN SELECTED
THE TAMILNADU DR M.G.R. MEDICAL UNIVERSITY
2
“A STUDY TO EVALUATE THE EFFECTIVENESS OF LAUGHTER
THERAPY ON DEPRESSION AMONG ELDERLY PEOPLE IN SELECTED
OLD AGE HOME, ERODE DISTRICT.”
Approved by DMIPSR College Research Committee
Principal : --- Prof.Mrs.K.Kalaivani, M.Sc., (Nursing) Professor in Community Health Nursing, Principal, DMIPSR College of Nursing, Sakthi Nagar, Bhavani, Erode – 638315
Research guide : ---
Mrs.Deepa.K, M.Sc (Nursing)
Reader cum HOD of Mental Health Nursing DMIPSR College of Nursing,
Sakthi Nagar, Bhavani, Erode – 638315
Medical Guide : --- Dr.P.Selvan, M.S., (Gen.Surgeon)
Register Number: 72323
Chief Medical Officer, Raghav Hospital, Appakudal, Bhavani, Erode – 638315
A Dissertation submitted to
The Tamil Nadu Dr. M.G.R. Medical University, Chennai In partial fulfilment of the requirement for
Degree of Master of Science in Nursing
VIVA VOCE:
1. INTERNAL EXAMINER: ---
2. EXTERNAL EXAMINER: ---
3
ENDORSEMENT BY HEAD OF THE INSTITUTION
This is to certify that the dissertation entitled “A STUDY TO EVALUATE
THE EFFECTIVENESS OF LAUGHTER THERAPY ON DEPRESSION
AMONG ELDERLY PEOPLE IN SELECTED OLD AGE HOME, ERODE
DISTRICT.” is a bonafide research work by Mr.Ebenezer under the guidance of
Mrs.K.Deepa, M.Sc.,(N), Reader, Dharmarathnakara Dr.Mahalingam Institute of
Paramedical Science and Research, Sakthi Nagar, Erode.
Date:
Place: Sakthi Nagar
Signature of the Principal,
Prof.Mrs.K.Kalaivani, M.Sc., (N),
Principal cum Professor in Community Health Nursing, DMIPSR College of Nursing,
4
ENDORSEMENT BY THE RESEARCH GUIDE
This is to certify that the disseration entitled “A STUDY TO EVALUATE
THE EFFECTIVENESS OF LAUGHTER THERAPY ON DEPRESSION
AMONG ELDERLY PEOPLE IN SELECTED OLD AGE HOME, ERODE
DISTRICT.” is a bonafide research work done by M. Ebenezer in parital fulfillment
of the requirement for the degree of Master of Science in Mental Health Nursing.
Date : Signature of the Research Guide
Place : Sakthi Nagar Mrs. Deepa. K, M.S.c (N), Reader,
Cum HOD of Mental Health Nursing,
Department,
DMIPSR College of Nursing
Sakthi Nagar, Bhavani,
5
ACKNOWLEDGEMENT
“Teachers are reservoirs from which, through the process of education, students
draw the water of life”
Gratitude is the way of expressing our response towards others. I humbly express my heartfelt gratitude to the Almighty for his presence throughout the study.
I am proud to acknowledge the love, support and prayers of my lovable family in every phase of the study.
This study would not be fruitful without the guidance of the teachers, well wishers and those have been a part of this study and I would like to thank them one and all.
With the blessings of his holiness Jagadguru Padmabhushana Dr. Sri. Sri. Sri.
Balagangadharanatha Mahaswamiji, I am immensely grateful to Sri. Sri. Sri.
Nirmalanandhanatha Mahaswamiji, President, Sri Adichunchanagiri Shikshana
Trust and Dr. N. Mahalingam, Chairman of Sakthi Group of Companies, granting me an opportunity to undergo the course at Dharmarathnakara Dr. Mahalingam Institute of Paramedical Sciences and Research, Sakthinagar.
My heartfelt thanks to Sri. B.T. Ramachandra, Secretary and Correspondent, Dharmarathnakara Dr. Mahalingam Institute of Paramedical Science and Research, Sakthi Nagar for his encouragement and support, by providing all the facilities for the successful completion of this study.
My immeasurable thanks is submitted to Prof.Mrs.K.Kalaivani, M.Sc., (N),
Principal, Dr.Mahalingam College of Nursing, Sakthi Nagar, for her generous
6
I extend my thanks to Mrs. K. Deepa, M.Sc., (N), Reader cum HOD of Mental health Nursing Department, for her valuable suggestions and guidance throughout the study.
I cordially thank Mrs. R. Tamilzhselvi, M.Sc., (N), Lecturer, Mental Health Nursing department, for her valuable guidance and suggestions throughout the study.
I extend my thanks to our class co-ordinator, Mrs. Gnanadhinahari,
M.Sc,(N),Reader cum HOD of, Medical Surgical Nursing Department, for her
guidance and suggestions throught the study.
I extend my sincere gratitude to Mrs. Janaki, M.Sc., (N), Vice principal,
Reader cum HOD of, obstetrics Gynecological Nursing department, for her timely
advice and guidance.
I extend my thanks to Mrs. Hemalatha, M.Sc., (N), Reader cum HOD of, Pediatric Nursing department for her timely advice and guidance.
I also extend my thanks to Mrs. Sri Deepa, M.Sc., (N), Lecturer, community Health Nursing department for her timely advice and guidance.
I also accord my respect and gratitude to all the faculties of DMIPSR for their timely assistance, cooperation and support throught the period.
I express my sincere thanks to Dr. Selvam M.S (Gen. Surgeon) for valuable suggestions and guidance in the formulation of tool.
I render my thanks to all the experts who validated tool and provided constructive and valuable opinions.
Grateful acknowledgement is extened to Dr. Dhanapal, M.Sc., M.Phil, Ph. D
Department of Statistics, Erode Professor in statistics for his valuable help in
7
I also extend my thanks to Mrs. T.S.Sumithra Devi, M.A., and M.Phil who edited the study.
I extend my sincere thanks to Mr. K.Kumar M.L.I.Sc, Libraian for the successful completion of study.
My sincere thanks to all the teaching and non teaching staffs, who have contributed their valuable help.
My sincere thanks to all my friends and beloved juniors for their constant help, ideas and for standing with me during the odds. I also extend my thanks to Mr.
K.Madeshwaran, Sri Vijayalakshmi Computers for making me successful in all
the encounters and difficulties faced during the study.
I am proud to acknowledge the love, support and patience of my beloved parents Mr. Manoharan and Mrs. Suguna and all my family members for their encouragement, emotional support, and prayers which kindled enthusiasm in completion of this research to a successful one.
8
TABLE OF CONTENTS
S.NO CHAPTER PAGE NO
I. INTRODUCTION
II. REVIEW OF LITERATURE
III. METHODOLOGY
IV. DATA ANALYSIS AND INTERPRETATION
V. DISCUSSION
VI. SUMMARY
VII. BIBLIOGRAPHY
9
LIST OF TABLES
S.No Tables Page
No
1. Distribution of demographic variables
2. Pre-test and post test mean score
3. Level of depression score
4. Effectiveness of laughter therapy
10
LIST OF FIGURES
S.No Figure Page No
1. Conceptual frame work
2. Schematic representation of the study design
3.
Simple pie diagram showing distribution of elderly people according to their age
4.
Simple bar diagram showing distribution of elderly people according to their sex
5.
Cylindrical diagram showing percentage wise distribution of elderly people according to their marital status
6.
Daughunt diagram showing distribution of percentage wise distribution of elderly people according to their educational status
7.
Conical diagram showing distribution of elderly people according to their health status
8.
Simple bar diagram showing distribution of elderly people according to their number of children
9. Level of depression
10. Effectiveness of laughter therapy
11.
11
LIST OF ANNEXURE
S.No Content
1. Letter seeking and granting permission to conduct pilot study 2. Letter seeking and granting permission to conduct Main study 3. Letter seeking expert opinion on validity of the tool
4. Content validity certificate
5. Training certificate in laughter therapy 6. Data collection tool (english and tamil) 7. Editor’s letter
12
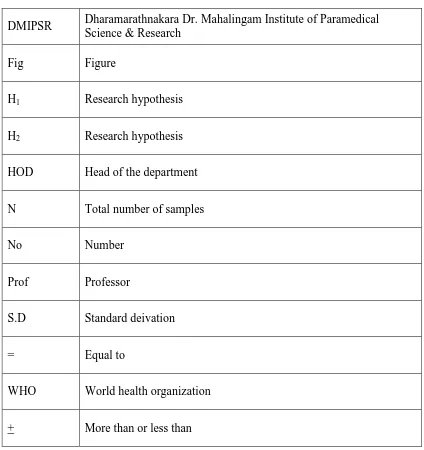
LIST OF ABBREVIATIONS USED
DMIPSR Dharamarathnakara Dr. Mahalingam Institute of Paramedical Science & Research
Fig Figure
H1 Research hypothesis
H2 Research hypothesis
HOD Head of the department
N Total number of samples
No Number
Prof Professor
S.D Standard deivation
= Equal to
WHO World health organization
[image:12.595.98.522.154.604.2]13
ABSTRACT
STATEMENT OF THE PROBLEM:
“A STUDY TO EVALUATE THE EFFECTIVENESS OF LAUGHTER THERAPY ON DEPRESSION AMONG ELDERLY PEOPLE IN SELECTED OLD AGE HOME, ERODE DISTRICT.”
OBJECTIVES OF THE STUDY:
1. To assess the level of depression among elderly people
2. To evaluate the effectiveness of laughter therapy on depression among elderly people
3. To findout the association between pre-test level of depression among elderly people with their selected demographic variables
METHODS:
The research approaches adopted for this study was quantitative approach, the research design adopted for this study was quasi-experimental (pre-experimental design) one group pretest and post test design
Result:
The maximum numbers of elderly people, 54% were in age group of 60 to 70 years
The proporation of 50 elderly people ,56% was females The proporation of 50 elderly peoples ,74% was married The proporation of 50 elderly people, 72% were uneducated.
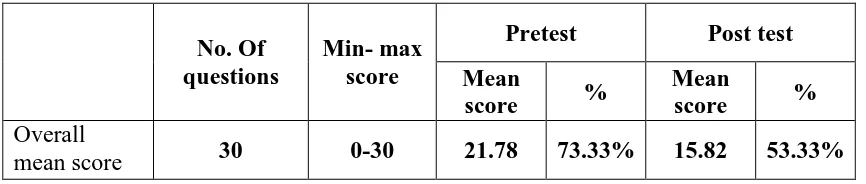
The major findings of the study showed that the pretest mean score (21.78) 73.33% and post test mean score was (15.82) 53.33%
14
score.Whereas, the post test score was no depression 12%, mild depression was 66% moderate and severe depression was 22%.
It revealed that laughter therapy was found to be effective in reducing the depression among elderly people.
15
CHAPTER - I
INTRODUCTION
“An ounce of prevention is better than a pound of cure”.
Population ageing is the most significant emerging demographic phenomenon in the world today. In 1950, the world population aged 60 years and above was 205 million (8.2 percent of the population) in 2000. By 2050, the proportion of older persons 60 years and above is projected to rise to 21.1 percent, which will be two billion in number. Asia has the largest number of world’s elderly (53 percent), followed by Europe (25 percent). This pressure of increasing numbers of elderly will intensify in the next 50 years.
A cheerful heart is good medicine, but a broken spirit saps a person’s strength. Over the yearly many physical benefits to laughter have been reported by doctors and health care professionals Patients are in need of the therapeutic effects of humor and laughter. The ability to see the laughter in a situation and laugh feely with others can be an effective way to take care of our own body, mind and spirit.
Geriatric psychiatry is concerned with preventing, diagnosing and treating psychological disorders in older adults. It is also concerned with promoting congruity. Persons with a healthy mental adaptation to life are likely to liver lungs than those stressed with emotional problem.
Stress typically describes a negative condition that can have an impact on one’s mental and physical well – being, but it is unclear what exactly defines stress and whether or not stress is a cause in an effect or the process connective the two
16
promote health enhances immune system performance and copes with illness. Laughter can reduce stress, promote good health, and enhance the quality of life.
The physical effects of laughter on the body involve increased breathing, oxygen use and heart rate, which stimulate the circulatory system.
Children as they grow up tend forget their moral and social responsibilities towards their parents, parents toil hard and spend their precious lives with the sale aim of ensuring a bright and secure future for their children.
As soon as they get settled in their life, they tend to neglect their old parents considering them as a burden. Advancing age is often associated with loss of key social support systems due to the death of a spouse or siblings, retirement and relocation of residence.(narayan, 2010).
Some of the other problems which elderly face in their life are fear of their death of closing someone else, frustration with disability or slowing down of their cognitive disabilities of daily living, sensory deficits, loneliness isolation from their family member’s etc. migration of children to abroad, lack of personal to take care of them, problems with children and being isolated are some of the other factors that lead the elderly to stay in old age homes.
17
Need for the Study:-
The elderly are prized resources that are need to create a awareness to safeguard the health and dignity of vulnerable section of society and help them like the rest of their lives with dignity. Elderly are the most rapidly growing segment of population. In India there are about 77 million elderly populations.
A study conducted on global estimation of the elderly population. It reveals that there are 30.2 percent of total population consists of elderly and this will increase to 72 percent by 2050. The study also reports that the elderly in Asia are also expected to increase from 1 million in 2003 to 7 million in 2050.
WHO reports that there are 236 elderly people per 10,000 suffer from mental illness mainly due to ageing, physical problems, socio-economic factor, cerebral pathology, emotional attitude and family structure stress occurs in approximately 10 to 15 percent of all community dwelling elderly over 65 years of age. The prevalence rate increases from 50 to 75 percent among institutionalized adults.
A study was conducted about the social problems of the aged rural population in India, the study reported 55% of the old age people are being respected, 26 percentages were neglected. 46.8% were happy and 53.4% were unhappy. The study revealed that stress related problems such as depression are found commonly in the later group and the government should take initiation for further more studies in the area.
18
symptoms, prevents suicidal ideation, improve cognitive and functional status in order to improve the recovery of a good quality of life as well as the mortality risk.
The world health organization estimated that the prevalence rate of depressive disorders among the elderly generally varies between 10% and 20% the community based mental health studies in India have revealed that the point prevalence of depressive disorders in the elderly Indian population varies between 13 and 25%. Though India is the second most populated country in the world in terms of elderly population of 60 years and above, depression in the elderly population of 60 years and above depression in the elderly is not yet perceived as a public health problem in India (Barua, 2011).
M.C. D. 2009 conducted an epidemiological study to compare the prevalence
of depression among elderly living in institutional setting and residence the sample size for the study was 2640 and they were selected through stratified random sampling technique. The participants were screened through geriatric mental status. The results found that the incidence of depression among the elderly living in institution was 27% and in home it was 9.3% (Mc Dougall, 2007)
A comparative study was conducted among the elderly population aged above 60 years living in old age home and community. The sample size was 50 and they were selected from each group using randomized sampling technique. Samples were recruited through the geriatric depression scale. The comparative results showed that depression was more prevalent among the elderly diving in old age home (Gopal.
2009).
19
experimental and control group. They were recruited through the life satisfaction index tool. Experimental group was provided. Laughing sessions for a period of 6 months and control group was not given intervention. The study results showed that after implementing laughter therapy for the elderly their stress levels decreased significantly (Roopa, 2010).
Through extensive review the present researcher identified that the depression among the elderly is highly remarkable. Further the effectiveness of laughter therapy was proved to be effective among the depressed elderly through various studies.
STATEMENT OF THE PROBLEM:-
“A STUDY TO EVALUATE THE EFFECTIVENESS OF LAUGHTER THERAPY ON DEPRESSION AMONG ELDERLY PEOPLE IN SELECTED OLD AGE HOME ERODE. DISTRICT”.
OBJECTIVES OF THE STUDY:-
4. To assess the level of depression among elderly people
5. To evaluate the effectiveness of laughter therapy on depression among elderly people
6. To findout the association between pre-test level of depression among elderly people with their selected demographic variables
HYPOTHESIS:-
H1 : There is a significant difference between the pre-test and post-test level of Depression among elderly people.
20
OPERATIONAL DEFINITION:-
Effectiveness:-
It refers to the change in the level of depression after implementation of laughter therapy.
Laughter therapy:-
It refers to the use of humor to promote overall health and wellness. It aims to use the natural physiological process of laughter to help relieve physical or emotional stress.
Depression:-
It refers to any change in an individual life that causes alteration in the physical, mental or emotional status which is assessed through the geriatric depression scale.
Elderly:-
It refers to elderly men and women with depression residing at old age home between 60-80 years of age and above.
Old age home:-
An institution providing professional care to the elderly like their residential setting.
Assumption:-
21
CONCEPTUAL FRAME WORK
Roy’s adaptation model modified (1964) Roy’s adaptation model (modified) was used in the study. This model explains the concept of adaptation of the person. The person receives input / stimuli from internal and external environment. Integration of human and environment results in adaptation. Roy’s model characterized as a system theory with a strong analysis of intervention the components are:
Input, control, process, output
INPUT:
The stimuli are like:
Focal stimuli: focal stimuli are those, which most immediately confront the
person. In this study, it refers to depression.
Contextual stimuli:
Contextual stimuli are those other stimuli that influence the situation. It includes elderly feelings of anxiety, stress, fatigue, worthlessness and hopelessness.
Residual stimuli:-
Residual stimuli include the attitude of the elderly and their previous experience. These are those internal factors whose current effects are unclear.
Control:
Individuals have biological abilities to cope with the changing environment. Roy has described these abilities as regulator coping mechanism and considered as the person’s adaptive system.
Coping mechanisms:-
22
Regulator sub system:
The regulator sub system (laughter therapy) responds automatically through neuron – chemical process, during laughter therapy which stimulates the circulatory system and boosts the immune system.
Cognator subsystem:
The cognator subsystem responds through higher, complex process of perception, informational processing, judgments and emotion. The samples use the cognator subsystem by perceiving, processing and learning the information given by the researcher regarding laughter therapy.
In this study role function mode is responds positively to laughter therapy
Interdependence mode involves the willingness to give to others and accept
from others. In this study, it denotes the maintenance of good inter personal relationship between the researcher and the elderly people perceives the importance of laughter therapy
Out put:
Output is the out come of the process; it may be the adaptive response or non adaptive response. In this study the adaptive response, laughter therapy was effective in reducing depression and ineffective response is laughter therapy was not effective in reducing in depression.
Adaptive modes:
23
Physiological mode involves the body’s basic needs and ways of dealing with
adaptation. In this study, physiological mode is the need to protect them by acceptance of laughter therapy provided by the researcher.
Self concept mode involves the belief and feeling about on self. In this study,
24
Ineffective response:
Laughter therapy is not effective in reducing depression. STIMULI Focal stimuli: Depression Contextual stimuli: Age, Sex, Education Status, Marital Status, Health Status, Number of Children Residual stimuli:
Previous experience, on perceived stress.
[image:24.595.83.779.89.487.2]Adaptive response: Laughter therapy is effective in reducing depression. Feed Back
Fig. 1: Modified Roy Adaptation model, 1984 (conceptual frame Work) Interdependence Mode: Maintains good
interpersonal relationship accept and practice laughter therapy
Role Function Mode: Accept laughter therapy and enhance role CONTROL Coping mechanism Cognator: Perceiving the importance and accepting laughter therapy. Regulator:
Neuro chemical process
Self Concept Mode:
Believe that it is important for them to practice laughter therapy.
25
CHAPTER –II
REVIEW OF LITERATURE
Review of literature is a broad, and comprehensive, in depth, systematic and critical review of scholarly, publications, and published scholarly printed materials and audio visual materials and personal communications.
Review of literate is an essential step in the research project, it provides basis for future investigations, justifies, the need for the study, troughs light on the feasibility of the study, reveals constraints of data collection and other relates, the finding from one study to another with the hope to established a comprehensive study of scientific knowledge in professional discipline, from which valid and pertinent theories may be developed.
The investigator carried out an extensive review of literature on the research topic, in order to give deeper insight into the problem and to collect maximum relevant information for building the foundation of the study.
In order to collect the information, the investigator used online resources like, website and latest books a journals, review was done on the research and non – research materials.
The present chapter illustrates the literature pertinent to the study. This was included under the following headings.
2.1. Literature related to elderly depressed people. 2.2. Literature related to laughter therapy
26
2.1. LITERATURE RELATED TO ELDERLY DEPRESSED PERSONS
Grover (2010) conducted a cross sectional study in the elderly population of a
rural community in west Bengal to estimate the prevalence of depression. The samples for the study included 183 elderly subjects and it was found that 60% of the elderly population was inflicted to depression. The results concluded that depression was more common among the elderly men (42.4%) and women (77.6%) respectively.
Gupta (2009) conducted a study to analyze the incidence of depression in the
elderly aged over 60 years. A total of 204 elderly subjects were selected through systemic random sampling technique and they were screened using the clinical interview schedule to find their depression. The results showed that 48.2% of the samples were subjected to depression.
(Devi, 2007) Conducted a survey among the elderly to assess the level of
depression. The sample size for the study was 100 and they were investigated through a structured questionnaire. The results revealed that majority of the elderly had moderate depression (58%) and (19%) of them had severe depression.
Sherina, 2005 conducted a cross sectional study to find out the prevalence of depression among elderly participants aged 60 years. Sample size for the study was 210 and they were selected based on randomized sampling technique. The respondents were screened using Geriatric depression scale. The results revealed that 18% of the elderly were exposed to depression.
Rajkumar, 2003 performed a descriptive study to find the prevalence of
27
geriatric mental state examination. The result showed that geriatric depression was more prevalent among 17% of the elderly subjects.
(Sharif, 2003) conducted a descriptive study to determine the prevalence of
level of depression among the elderly in a selected geriatric institution. The sample size for the study was 26 elderly subjects who were selected based on randomized sampling and Zung self – rating depression scale was used to analyze their level of depression. The result showed that 22 samples had moderate depression and 2 samples had severe depression respectively.
(Sherina, 2000) conducted a descriptive study to examine the prevalence of
depression among the elderly aged over 65 to 100 years. Sample size was 3599 and they were selected randomly through the diagnostic interview schedule to assess their depression. The results showed that 71.8% of these elderly were subjected to have
depression.
2.2. LITERATURE RELATED TO LAUGHTER THERAPY
(Youn, 2011) conducted a study among the elderly aged over 65 years to examine the impact of laughter therapy on depression and sleep quality. Sample size for the study was 109 elderly and they were divided into experimental and control group. Experimental group was implemented laughter therapy four times in one month. Their depression and sleep quality was assessed using geriatric depression scale and sleep quality index. The results showed that there was a significant increase in sleep quality and decrease in depression of the elderly after implementing laughter therapy.
28
period, participants had significant reduction in their stress levels, depression, diabetes and blood pressure. The concept behind this is, the laughter improves the lung capacity and oxygen levels in the blood. Further, some clients reported that reduced frequency of asthmatic attacks and a decrease in the usages of nebulizers (Narayan, 2010).
(Prazak, 2009) conducted a descriptive study to explore the laughter stimulus
in a population of older adult. They selected 130 hospital auxiliary personal aged over 50 years and they were interrogated for the study. They were questioned for the factors that make them to laugh. Their responses revealed in nine themes in two major categories such as people or animal and situations or events. Telling jokes represented the largest category of situation or events (50%). Hence laughter can be used by nurses as an effective tool to take care of the elderly.
(Lund, 2008) conducted the study to assess the effectiveness of laughter therapy among the bereaved widowed men and women. The sample size for the study was 292 and their stress levels were assessed. After implementing laughter and happiness strongly influenced their positive bereavement adjustments. The study concluded that bereaved spouses finally exhibited lower grief and depression.
29
(Gelkopf, 2006) conducted a study to determine the impact of humorous movies on psychopathology on clients with chronic schizophrenia. The sample size for this study was 29 psychiatric patients selected from a psychiatric hospital. The study group viewed humorous movies for a period of two months and the control group viewed neutral movies for the same period. Patient’s psychopathology was assessed before and after the intervention with positive and negative symptom sale. The results showed that the clients had an improvement in social functioning.
(Gelkopf, 2004) conducted a study to findout the potential therapeutically effects of laughter on hospitalized schizophrenic clients. The experimental group was 30 in total and exposed to 70 humorous movies for a period of 3 months whereas, in control group, it was exposed to different kinds of movies. Both groups were tested for their emotional and mental wellbeing using the cognitive orientation of health questionnaire. The results revealed significant improvement on the patients wellbeing.
(Bethea, 2003) intervened a survey among the family care givers of older adults to evaluate the effectiveness of laughter therapy. The selected 23 family members were interviewed and they included humorous aspects while caring for the elderly with their behavioral and cognitive problems. The results proved that laughter can be a useful strategy while caring for the elderly by their caretakers.
30
2.3. Literature related to laughter therapy and depression
Hirsh RD et al (2010) conducted a study on laughter therapy in the depressed
elderly. It shows significant improvements only in the experimental group for resilience and satisfaction with life (p<0.05). Analyses of the subgroups with atleast medium to severe depression showed further significant effects for cheerfulness, seriousness, bad mood, and satisfaction with life (p<0.05). These severely affected patients seemed to profit best from laughter therapy. The results indicate the efficacy of this specific therapeutic intervention for older depressed patients.
Dr.Narayan (2008) combined laughter yoga with cognitive restructuring, with
patients suffering from stress, diabetes, Asthma, depression and high blood pressure. The results showed a reduction in stress levels, depression, diabetes and blood pressure among some of the participants. Because laughter improves the lung capacity and oxygen levels in the blood.
Dr. Gita Suraj Narayan (2008) carried out a research study on the Bio
psycho-social impact of laughter therapy on stroke patients. It reveals that a reduction in the post-stroke depression enhanced mobility and the ability to walk without walking aids. Therapy helped patients recover from cognitive deficits resulting from stroke including perceptual disorders, speech problems, and problems with attention and memory and improved communication and relations between the patients and significant others.
31
three weeks, the investigators found that laughter yoga participants experienced significant reductions in their baseline blood pressures as well as their cortical level and decrease the perceived level of stress.
Nandi et.al (2007) epidemiological survey conducted at rural population in
Calcutta found that 24.1% of subjects aged 60 and above suffered from depression. In a geriatric psychiatric community survey in a sub urban population near madras found 24% of the subjects in the community suffered from depression and that is the most common psychiatric disorder in the aged.
Walter M et al (2007) conducted a study on laughter therapy in patients with
late – life depression or Alzheimer’s disease. The result shows that depressive patients receiving laughter therapy showed the highest quality of life after treatment. In addition, patients with depression in both therapy groups showed improvements in mood, depression score, and instrumental activities of daily living.
Seaward BL (1992), On the basis of the study on laughter’s healing potential.
32
CHAPTER - III
METHODOLOGY
This chapter deals with the description of the research approach, design, setting, population, criteria for sample selection, sample and sampling technique, development and description of tool, procedure for data collection and plan for data analysis
Research approach:-
The research approach adopted for this study is an evaluative approach. Quantitative approach evaluative approach.
Research design:-
For this study the research design chosen is quasi experimental design. Which include manipulation randomization and absence of control group, the design chosen is one group pre-test and post test design.
Group Pre-Assessment Intervention Post Assessment
Quasi experimental RO1 X O2
Key:-
O1 - Pre assessment of level of depression among elderly people.
O2 - post assessment of level of depression among elderly people.
33
Variables:-
Variables are concepts at various manipulated levels of abstraction that are measured or controlled in the study. The variables mainly included in this study are independent and dependent variables.
Independent variables:-
Laughter therapy programme is the independent variables.
Dependent variables:-
Dependent variable is the depression among elderly people
Site:-
The site selected for present study is old age home
Setting:-
The setting for present study in recreation hall
Population:-
Old age home, Erode district.
Sample:-
Elderly people in selected old age home, Erode district.
Sample size:-
50 samples
Sampling technique:-
Purposive sampling technique was used.
Criteria for sample selection:- Inclusion criteria:-
1. Those who are in the age group of above 60 years 2. Both male and female
34
Exclusive criteria:-
1. Hearing disabilities 2. Sensory impairment.
Description of the instrument:-
The tool consists of two sections.
Section A : Demographic variables of the depressed elderly people Section B : Questionnaire regarding depression among elderly people
Section A : Demographic variables of the depressed elderly people:-
It consists of selected demographic variables like age, sex, marital status, educational status, health status and Number of children.
Section B : Questionnaire regarding depression among elderly people:-
The geriatric depression scale was formulated by gesavage in 1983. It is also items questionnaire with simple “yes” (or) “No” answers to rate the level of depression in elderly. It takes 20 minutes to administer the geriatric depression scale.
Scoring:-
35
Score interpretation:-
Total score - 30
Score of 0-9 - No depression Score of 10-19 - Mild depression
Score of 20-30 - Moderate and severe depression.
Reliability of the instrument:-
The reliability of the instrument was estimated by Karal Pearson co-efficient correlations. The reliability value of the instrument was (0.9) and it was found to be reliable.
Validation of the instrument:-
The content validity of the instrument was assessed by obtaining opinion from five experts in the field of mental health nursing and medicine. The experts suggested that the geriatric depression scale to assess the level of depression.
The present study aimed to evaluate the effectiveness of laughter therapy on depression among elderly people in selected old age home.
Pilot study:-
It is a small scale version or trail run of the main.
The pilot study was conducted in Blessing India mission, Harur Tk, Dharmapuri (D.T) Tamilnadu, 5 samples was selected, after getting permission from the concerned old age home and prior information was given to the participants. The topic was explained and the study was conducted, data analysis was done by using descriptive and inferential statistics and found that the study was feasible.
Data collection procedure:-
36
Total samples of the main study were 50 elderly people. Data was collected from the samples by administering structured interview questionnaires, after getting their consent.
Plan for statistical analysis:-
Data analysis is the systematic organization and synthesis research data and testing of research hypothesis using those data.
The data obtained was planned to be analyzed on the basis of the objectives of the study using descriptive and inferential statistics.
Organize data in master coding sheet
Demographic variables are to be analyzed in terms of frequencies and percentage.
Levels of depression are to be presented in the form of mean, mean percentage and standard deviation.
Chi-square test was used to do analysis the association between their selected demographic variables among depressed elderly peoples.
Sino Data Analysis
Methods Remarks
1. Descriptive Mean, standard deviation
percentage
Assess the level of elderly depressed people
2. Inferential statistics
Paired “t” test
Chi-square test
Comparison of pretest level of depression among elderly people
37
ETHICAL CLEARANCE:
38
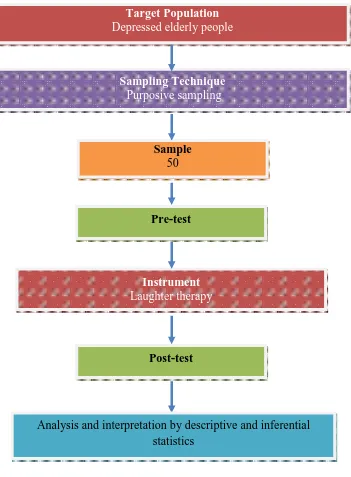
[image:38.595.134.485.172.649.2]SCHEMATIC REPRESENTATION OF STUDY DESIGN
Fig.2: Schematic representation of study design Target Population
Depressed elderly people
Sampling Technique
Purposive sampling
Instrument
Laughter therapy
Sample
50
Pre-test
Post-test
39
CHAPTER - IV
DATA ANALYSIS AND INTERPRETATION
“Get the habit of analysis – analysis will in time enable synthesis to
become your habit of mind”
- Frank zloyd Wright quotey
Analysis is the process of categorizing, manipulating and summarizing the data to obtain answers to research question. The intelligible and interpretable from which the relations of research problem can be studied and tested. - Polit, (2004)
Statistical analysis:-
This chapter deals with systematic presentation of the analyzed data followed by its interpretation with the collected information was organized, tabulated analyzed and interpreted by using descriptive and inferential statistics. The findings were organized and presented in two parts with tables and figures. The details of each are presented below to co-relate with objectives.
Objectives of the study:-
1. To assess the level of depression among elderly people
2. To evaluate the effectiveness of laughter therapy on depression among people 3. To find out the association between pre-test level of depression among elderly
people with their selected demographic variables.
Organization of findings:-
The data analyzed were presented under the following headings. 1. Description of sample characteristics.
2. Assess the pretest and post-test level of depression among elderly People. 3. Evaluate the effectiveness of laughter therapy in reduction of
40
Table No. 1: DISTRIBUTION OF DEMOGRAPHIC VARIABLES
Demographic variables Categories Frequency Percentage
Age group 60 to 70 27 54
70 to 80 10 20
80 and above 13 26
Sex Male 22 44
Female 28 56
Marital status Married 37 74
Unmarried 13 26
Educational status Educated 14 28
Uneducated 36 72
Health status Healthy 10 20
unhealthy 40 80
No. of children One 22 44
Two 10 22
Three and above 2 4
Nil 16 32
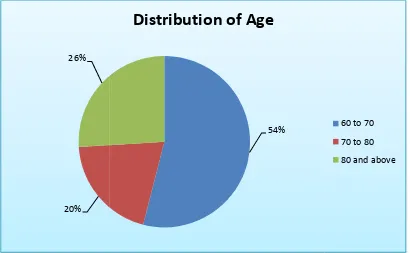
Fig 3: Simple pie diagram showing distribution of elderly people according to
Percentage wise distribution of elderly people according to their age group shows the highest of 54% of elde
26% of elderly people were in were in the age group of 8
20% 26%
41
diagram showing distribution of elderly people according to
their age
Percentage wise distribution of elderly people according to their age group shows the highest of 54% of elderly people were in the age group of 60 to 70 years, 26% of elderly people were in the age group of 70 to 80 years and 20% elderly people were in the age group of 80 and above.
54%
Distribution of Age
diagram showing distribution of elderly people according to
Percentage wise distribution of elderly people according to their age group rly people were in the age group of 60 to 70 years, 20% elderly people
60 to 70
70 to 80
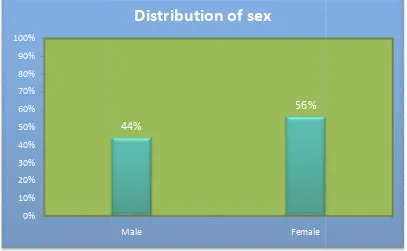
Fig: 4: simple bar diagram showing distribution of elderly people according
Percentage wise distribution of elderly people according to their that highest 56% were females
0% 10% 20% 30% 40% 50% 60% 70% 80% 90% 100%
42
Fig: 4: simple bar diagram showing distribution of elderly people according
their sex.
Percentage wise distribution of elderly people according to their females and 34% were males.
44%
56%
Male Female
Distribution of sex
Fig: 4: simple bar diagram showing distribution of elderly people according to
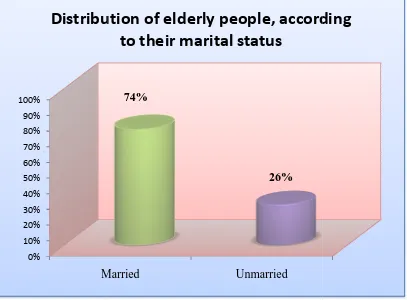
Fig: 5: cylindrical diagram showing percentage wise distribution of elderly
people, according their marital
Percentage wise distribution of elderly people according to their marital status shows that 74% of elderly people were married and
0% 10% 20% 30% 40% 50% 60% 70% 80% 90% 100%
Married
Distribution of elderly people, according
43
Fig: 5: cylindrical diagram showing percentage wise distribution of elderly
people, according their marital status.
wise distribution of elderly people according to their marital status of elderly people were married and 26% were unmarried.
Married Unmarried
74%
26%
Distribution of elderly people, according
to their marital status
Fig: 5: cylindrical diagram showing percentage wise distribution of elderly
wise distribution of elderly people according to their marital status 26% were unmarried.
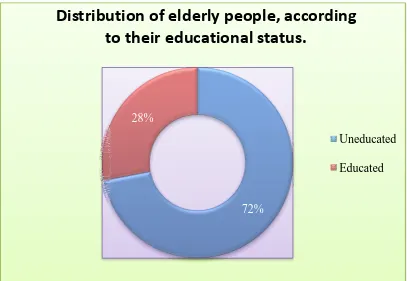
Fig: 6: Doughnut diagram showing distribution of percentage wise distribution
of elderly people according to their educational status
Percentage wise distribution of elderly people according to their educational status shows that 72% o
were educated.
Distribution of elderly people, according
to their educational status.
44
diagram showing distribution of percentage wise distribution
elderly people according to their educational status
Percentage wise distribution of elderly people according to their educational status shows that 72% of elderly people were uneducated and 28% of
72% 28%
Distribution of elderly people, according
to their educational status.
diagram showing distribution of percentage wise distribution
elderly people according to their educational status
Percentage wise distribution of elderly people according to their educational 28% of elderly people
Distribution of elderly people, according
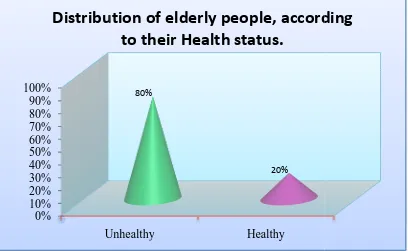
Fig: 7: Conical diagram showing distribution of elderly people according to their
Percentage wise distribution of elderly people according to their health status shows that highest 80% of elderly pe
were healthy. 0% 10% 20% 30% 40% 50% 60% 70% 80% 90% 100%
Unhealthy
Distribution of elderly people, according
45
diagram showing distribution of elderly people according to their
health status
Percentage wise distribution of elderly people according to their health status shows that highest 80% of elderly people were unhealthy and 20% elderly people
Unhealthy Healthy
80%
20%
Distribution of elderly people, according
to their Health status.
diagram showing distribution of elderly people according to their
Percentage wise distribution of elderly people according to their health status 20% elderly people
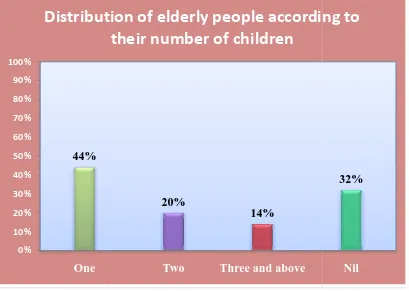
Fig: 8: Simple
according to their number of children.
Percentage wise d
children shows that highest 44% of them have one
children, 4% of them have three children and 32% of them have no children.
44% 0% 10% 20% 30% 40% 50% 60% 70% 80% 90% 100% One
Distribution of elderly people according to
46
Simple bar diagram showing distribution of elderly people
according to their number of children.
Percentage wise distribution of elderly people according to their number of children shows that highest 44% of them have one child, 26% of
children, 4% of them have three children and 32% of them have no children.
20%
14%
Two Three and above
Distribution of elderly people according to
their number of children
bar diagram showing distribution of elderly people
istribution of elderly people according to their number of , 26% of them have two children, 4% of them have three children and 32% of them have no children.
32%
47
Table: 2 Mean score between pre-test and post test on depression among the
elderly people
No. Of questions
Min- max score
Pretest Post test
Mean
score %
Mean
score %
Overall
mean score 30 0-30 21.78 73.33% 15.82 53.33%
[image:47.595.108.510.407.535.2]Table 2 shows the pre test and post test depression score among elderly people in old age home there is a significant reduction of depression score after laughter therapy.
Table: 3 Level of depression
Level of depression Pre-test Post test
No depression 0 (0.0%) 6(12%)
Mild depression 16 (32%) 33 (66%)
Moderate and severe depression 34 (68%) 11 (22%)
Table 3 shows the pre test and post test level of depression for elderly people.
Score:
0 – 9 – No depression 10 -19 – Mild depressions
Above figure shows post-test. 0% 10% 20% 30% 40% 50% 60% 70% 80% 90% 100% No Depression 0% 12% 48
Fig. 9: Level of Depression
shows the level of depression of elderly people in pre
No Depression Mild
Depression Moderate and Severe depression 32% 68% 12% 66% 22%
Level of Depression
the level of depression of elderly people in pre-test and
Pre-test
Table: 4: Comparison
Mean
Level of depression 21.78
Table 4 comparison of pre is a significant difference between pre
[image:49.595.140.479.328.398.2]depression. It was analyzed using student paired “t” test
Table: 5:
Depression
Table 5 shows the effectiveness of laughter therapy when considering depression score the level of depression is decreased to 20% after giving laughter therapy. 0.00% 10.00% 20.00% 30.00% 40.00% 50.00% 60.00% 70.00% 80.00% 90.00% 100.00% 49
Comparison of pre-test and post test depression score
Pre-test Post test
Mean SD Mean SD
21.78 4.5 15.82 5.05
comparison of pre-test and post test depression score. It shows, there significant difference between pre-test and post test score of elderly people on
. It was analyzed using student paired “t” test.
Table: 5: Effectiveness of laughter therapy
Pre test Post test % of gain
73.33 53.33 20.000
[image:49.595.102.514.530.746.2]shows the effectiveness of laughter therapy when considering score the level of depression is decreased to 20% after giving laughter
Fig.10: Level of Depression
73.33%
53.33%
Pre-test Post-test
Level of Depression
test and post test depression score
Paired ‘t’ –test
T = 19.34 P < 0.05 Significant.
test and post test depression score. It shows, there test and post test score of elderly people on
% of gain
20.000
shows the effectiveness of laughter therapy when considering score the level of depression is decreased to 20% after giving laughter
53.33%
50
Table No: 6: Distribution of demographic variables
Demographic variables
Level of depression
Chi square test values No Depression Mild Depression Moderate and Severe depression
F % F % F %
Age group 60-70 years 0 0 3 9 24 48
χ2 = 13.67 P < 0.05 Significant
70-80 years 0 0 5 10 5 10 80 and
above 0 0 8 16 5 10
Sex
Male 0 0 5 10 17 34 χ
2 =
1.48 P > 0.05
Not Significant
Female 0 0 11 22 17 34
Marital status
Married 0 0 9 18 28 56 χ2 = 3.71 P > 0.05
Not Significant
Unmarried 0 0 7 14 6 12
Educational status
Educated
0 0 6 12 8 16 χ
2 =
0.94 P > 0.05
Not Significant Uneducated 0 0 10 20 26 52
Health status
Healthy
0 0 3 6 7 14 χ
2 =
0 P > 0.05
Not Significant Unhealthy 0 0 13 26 27 54
Number of children
One 0 0 7 14 15 30
χ2 = 0.44 P > 0.05
Not Significant
Two 0 0 4 8 6 12
Three and
above 0 0 0 0 2 4
Nil 0 0 5 10 11 22
Fig: 10: Multiple Cylindrical
Above figure shows
depression and demographic variables (age) at P< 0.05 level.
0% 10% 20% 30% 40% 50% 60% 70% 80% 90% 100% 60-70 years 0% 6% 48% 51
Multiple Cylindrical diagram showing association between level of
depression and age
Above figure shows that, there is a significant association between the level of depression and demographic variables (age) at P< 0.05 level.
70-80 years 80 and above
0% 0%
10%
16% 48%
10% 10%
diagram showing association between level of
, there is a significant association between the level of
No Depression
Mild Depression
52
CHAPTER – V
DISCUSSION
This chapter deals with the discussion of the study with appropriate literature review, statistical analysis and findings of the study based on objectives of the study. The aim of the study to evaluate the effectiveness of laughter therapy on depression among elderly people in selected old age home, Erode district.
STATEMENT OF THE PROBLEM:-
“A STUDY TO EVALUATE THE EFFECTIVENESS OF LAUGHTER THERAPY ON DEPRESSION AMONG ELDERLY PEOPLE IN SELECTED OLD AGE HOME, ERODE DISTRICT.”
HYPOTHESIS:-
H1 : There is a significant difference between the pre-test and post-test level of depression among elderly people.
H2 : There will be a significant association between level of depression among elderly people and selected demographic variables.
• The first objective of the study to assess the level of depression among
elderly people
The pretest mean depression score was 21.78 (73.33%). The pretest depression score was no depression was 0%, mild depression was 32% moderate and severe depression was 68%, after the intervention, post test depression level was reduced.
53
moderate and severe depression score is (22%).After the intervention, post test level was reduced.
• The second objective was to evaluate the effectiveness of laughter
therapy:-
The mean depression score between pre-test was 21.78 and post test was15.82, standard deviation of pre test was 4.5 and post test was 5.05, and mean difference was 20.00, t = 19.34, p < 0.05. It’s showed that there was a significant difference between pre-test and post test mean score; hence laughter therapy reduces level of depression among the elderly people.
• The third objectives was to find out the association between pre-test level
of depression among elderly people with their selected demographic
variables
54
CHAPTER – VI
SUMMARY, CONCLUSION, AND REOMMENDATIONS
INTRODUCTION
The primary goal of the study is to evaluate the depression level of elderly people, in selected old age home. Researcher educated to the elderly people about the laughter therapy, then the depression level was assessed among the elderly people and it was associated with demographic variables.
Objectives:-
1. To assess the level of depression among elderly people
2. To evaluate the effectiveness of laughter therapy on depression among elderly people
3. To findout the association between pre-test level of depression among elderly people with their selected demographic variables
Review of literature:-
The conceptual frame work was adapted for this study. It is based on Roy’s adaptation model. In this study, review of literature is divided into following headings
1. Literature related to elderly depressed people 2. Literature related to laughter therapy
3. Literature related to laughter therapy and depression.
Methodology:-
55
The instrument was organized into two sections
Section I
Demographic variables of elderly people
Section – II
Questionnaire regarding level of depression among the elderly people.
The data collection was done and analyzed, interpreted on the basis of the objective of the study. The collected data was summarized and tabulated by utilizing descriptive statistics (percentage, mean, standard deviation) and inferential statistics (paired “t” test) and chi-square test
The study findings whereas follows:-
The maximum numbers of elderly people 54% were in the age group of 60 to 70 years
Among the proportion of 50 elderly people, 56% was females. Among the proportion of 50 elderly peoples, 74% was married. Among the proportion of 50 elderly people, 72% were uneducated.
The major findings of the study showed that the pretest mean score was 21.78 (73.33%) and post test mean score was 15.82 (53.33%).
The result of this study showed that the pre test level of depression score. No depression was 0%, mild depression was 32% and moderate and severe depression was 68%. Whereas, it was reduced in the post test was No depression 12%, mild depression was 66%, and moderate and severe depression was 22%.
56
The computed “t” value was 19.34 which are higher than the calculated value at 0.05 level of significance; hence there is significant relationship between depression and laughter therapy, H1 was accepted.
There is no significant association between level of depression and demographic variables such as sex, marital status, education status, health status and number of children of elderly people at P>0.005
There is a significant association between the level of depression and demographic variables (age) at p<0.05 level
Conclusion:-
The laughter therapy was effective in reducing depression among elderly people the study revealed that the level of depression score was high in pretest. After laughter therapy the post test score was reduced.
Nursing implications:-
The present study was conducted to findout the level of depression among the elderly people; following implications are discussed under the following headings.
Nursing practice:-
Depression is the most common mental health condition in elderly people. It can have a detrimental effect on quality of life and reduce patient’s ability to manage their health. Nurses caring for older people are in an ideal position to identify depression.
Individuals are normally assessed for depression through one to one interview and by taking a history.
57
Nursing administration:-
The nurse have multiple roles that reflect the diverse nature of nursing different functions that contribute to the optimum health and overall well being of older people including psychosocial and emotional support, assisting with easing transition, preceding further deterioration and disability and enhancing quality of life. The nurse teacher self-care activities for e.g. self – medication health promotion, continence promotion and health screening. Nursing homes or skilled nursing facilities are medical facilities dedicated to caring for elderly people. Though a focus on rehabilitation that maximizes the older peoples potential for independence, including assessment skills and undertaking essential care elements.
Nursing education:-
It’s also found that especially on mental health nurse social support is lower; the degree of socio support seems to be important. Social support could be improved, for example, by relating social network and social resources by providing course on team building.
Laughter therapy may give a better perspective on the emotional impact of dealing with many problems.
Nursing research:-
58
Recommendations:-
Based on the findings of the study following recommendation are stated. Similar study can be conducted in large sample to generalize the findings A similar study can be undertaken with a control group design
A similar study can be conducted in the different level of age groups.
Suggestions:-
1. Periodic assessment of the level of depression among the elderly people 2. Counseling program can be conducted in the old age home
59
BIBLIOGRAPHY
1. Park.K (2012) “TEXT BOOK OF PREVENTIVE AND SOCIAL
MEDICINE”, 17th edition, Mr. Brijmohan, publisher page No: 483.
2. Polit and back (2011) “NURSING RESEARCH” 9th edition, Lippincott Williams and Wilkins publication page No: 72-82.
3. Gelkopf, M (2010) “THE USE OF LAUGHTER IN SERIOUS MENTAL
ILLNESS”. A review, evidence based complementary and alternative
medicine, page No: 4-5.
4. Barua, A (2011), PREVALENCE OF DEPRESSIVE DISORDERS IN
THE ELDERLY, ANNUALS OF SAUDI MEDICINE, Page No: 620-624.
5. Jones, B (2010), control studies for the benefits of yoga on depression, yoga for depression, page No: 5-7.
6. Lund, D. & UTZ, R. (2008) “LAUGHTER AND HAPPINESS IN THE
DAILY LIVES OF BEREAVED SPOUSES, ONEGA (West port), page
No: 87-105.
7. Sundar Rao P.ss (2007) “INTRODUCTION TO BLOSTATISTICS AND
RESEARCH METHODS”, fourth edition practice hall of India pvt ltd. New
Delhi page No: 239-242.
8. Mc Evoy, D. (2007) ELDERLY DEPRESSION IN SENIORS, disability community information and educational videos on disabilities, Retrieved February 13.
60
10.Crookes and Davies (2006) “RESEARCH IN TO PRATICIE”, 2nd edition Bailliare findall publishers, Philadelphia. Page No: 199-209
11.K.P.Neeraja, “ESSNTIALS OF MENTAL HEALTH AND PSYCHIATRIC NURSING”, 1st edition, jaypee publishers pvt.ltd.
12.Shah, G. (2005), “TOWARDS ENRICHING YEAR”, a programme for the elderly by family welfare agency, ageing and the aged. Page No: 12-16.
13.Denise pf (2004) “NURSING RESEARCH PRINCIPLES AND
METHODS” seventh edition, Lippincott William and Wilkins publications
page No: 31-38.
14.Shives Louis rebrca (2000), BASIC CONCEPTS OF MENTAL HEALTH
NURSING”, Mosby publications, page no:300-328
15.Beck and Kahn (2002) “RESEARCH IN EDUCATION”, 7th edition Asoka K.Gosh, mentice – Hall of India. New Delhi, page No: 273-365.
16.Montorio, I.C Izal M (2001). THE GERIATRIC DEPRESSION SCALE; A review of its development, international psycho geriatrics, page No: 103-112. 17.Daryab Singh (2001) “PRINCIPLES OF STATISTICS”, 1st edition, Atlantic
publishers, page No: 79-177.
18.Gupta S.P (2000) “STATISTICAL METHODS” first edition, sultan chand publications, New Delhi page No: 21-27.
19.Mahajan B.K. (1999), “METHODS IN BIOSTATISTICS”, 6th edition, New Delhi, page No: 69-78.
61
JOURNAL REFERENCE:-
Lakshmidevi, S. & Roopa, K. (2011). THE ROLE OF HUMOUR AND
LAUGHTER IN IMPROVING THE QUALITY OF LIFE OLD AGE
PEOPLE, help age India – research and development journal, 17 (2), 25-28.
Hirsch, R. & Junglas, K. (2010). LAUGHTER THERAPY IN THE
DEPRESSED ELDERLY; Results of an empirical study, journal of gerontol
geriatric, 43(1), 42-52.
Grover, S. (2010). AN OVERVIEW OF INDIAN RESEARCH IN
DEPRESSION, Indian journal of psychiatry, 52 (7), 178-181.
Shahidi, M. & Mojtaned, A. (2010). LAUGHTER YOGA VERSUS
GROUP EXERCISE PROGRAM IN ELDERLY DEPRESSED
WOMEN: A randomized trial, international journal of geriatric psychiatry, 3
(6), 322-327.
Narayan, S. (2010). LAUGHTER YOGA INTERNATIONAL, LAUGHTER YOGA RESEARCH IN UKZN UNIVERSITY, South Africa
retrieved April 14, 2011, from Nagarajan, R. (2008). Seniors world chronicle: INDIA: Tamil Nadu has the highest number of elderly, seniors world chronicle, retrieved November 8, 2011
Gupta, R. & Biswas, S. (2009) DEPRESSION IN THE ELDERLY IN
VELLORE: the use of a two question screen, international psycho geriatrics,
21 (2), 369-371.
Kamble, S. & Dhumaele, G. (2009). DEPRESSION AMONG ELDERLY
PERSONS IN A PRIMARY HEALTH CENTRE, Maharashtra, Indian
62
MCDougall, (2007). PREVALENCE AND SYMPTOMATOLOGY OF
DEPRESSION IN OLDER PEOPLE LIVING IN INSTITUTIONS IN
ENGLAND AND WALES, oxford journals / age and ageing, retrieved
October 17, 2011.
Beckman, H. & Regier, N. (2007). EFFECT OF WORK PLACE
LAUGHTER GROUPS ON PERSONAL EFFICACY BELIEFS, the
journal of primary prevention, 28(2), 167-183.
Walter, M. & Hami, B. (2007). LAUGHTER THERAPY IN PATIENTS
WITH LATE – LIFE DEPRESSION, international of aging in India,
population ageing and the health in India, 31, 3-4.
Devi, E. (2007). ELDERLY AND DEPRESSION, nursing journal India, 21, 221-223.
Gelkopf, M. & Gonen, B. (2006). THE EFFECT OF HUMOR MOVIES
ON PATIENTS WITH CHRONIC SCHIZOPHRENIA, journal of nervous
mental disorders, 5(1), 880-883.
Sherina, M. & Rampal, S. (2005). THE PREVALENCE OF DEPRESSION
AMONG ELDERLY IN AN URBAN AREA OF SELANGOR,
international medical journal, 4 (2), 1-4.
Vishal, J., & Banssal, R. (2005). DEPRESSION AMONG AGED IN
SURAT CITY, national journal of community medicine, 1 (1), 47-49.
Gelkopf, M. & Kreitler, S. (2004). LAUGHTER IN A PSYCHIATRIC
WARD. Somatic, emotional, social and clinical influences on schizophrenic
63
Prakash, R. (2004). A study of morbidity pattern among geriatric population in an urban area of jaipur, Rajasthan. Indian journal of community medicine, 29 (1), 35-36.
Peazak, K. (2004). LAUGHTER AND OLDER ADULTS: what makes laugh, journal of holistic nurse, 24(3), 188-193.
Simon, J. (2000). LAUGHTER AND THE OLDER ADULT: Implications for nursing, journal of advanced nursing, 13 (4), 441-446.
NET REFERENCE:-
1. www.seniousworldchronicle.com 2. www.pubmed.com
3. www.disabled-world.com 4. www.laughter yoga.org 5. www.livestrong.com 6. www.seniorindian.com 7. www.nami.org
64
66
68