Rochester Institute of Technology
RIT Scholar Works
Theses Thesis/Dissertation Collections
3-2017
Understanding Traffic Characteristics in a Server to
Server Data Center Network
Siva Shankar Chandrasekaran
Follow this and additional works at:http://scholarworks.rit.edu/theses
This Thesis is brought to you for free and open access by the Thesis/Dissertation Collections at RIT Scholar Works. It has been accepted for inclusion in Theses by an authorized administrator of RIT Scholar Works. For more information, please [email protected].
Recommended Citation
i
Understanding Traffic Characteristics in a Server to Server Data
Center Network
by
Siva Shankar Chandrasekaran
A Thesis Submitted in Partial Fulfillment of the Requirements for the Degree of Master of Science in Computer Engineering
Supervised by
Dr. Amlan Ganguly
Department of Computer Engineering Kate Gleason College of Engineering
Rochester Institute of Technology Rochester, NY
March 2017
Approved By:
_____________________________________________________________________________
Dr. Amlan Ganguly
Primary Advisor – R.I.T. Dept. of Computer Engineering
_____________________________________________________________________________
Dr. Minseok Kwon
Secondary Advisor – R.I.T. Dept. of Computer Science
_____________________________________________________________________________
Dr. Andres Kwasinski
ii
Dedication
I would like to dedicate this thesis to my parents Mr. Chandrasekaran and Mrs. Gayathri who have
supported me from the beginning of my lifetime and my mentor and friends who have supported
iii
Acknowledgements
I take this opportunity to express my profound gratitude and deep regards to my primary advisor
Dr. Amlan Ganguly for his exemplary guidance, monitoring and constant encouragement
throughout this thesis. Dr. Ganguly dedicated his valuable time to review my work constantly and
provide valuable suggestions which helped in overcoming many obstacles and keeping the work
on the right track. I would also like to express my deepest gratitude to Dr. Minseok Kwon and Dr.
Andres Kwasinski for sharing their thoughts and suggesting valuable ideas which have had
significant impact on this thesis. I am grateful for their valuable time and cooperation during the
course of this work. I also take this opportunity to thank my research group members for all the
iv
Abstract
The number of Data Centers and the servers present in them has been on the rise over the
last decade with the advent of cloud computing, social networking, Big data analytics etc. This has
eventually led to the increase in the power consumption of the Data Center due to the power hungry
interconnection fabric which consists of switches and routers. The scalability of the data center
has also become a problem due to the interconnect cabling complexity which is also responsible
for the increase in the energy used for cooling the data center as these bundles of wires reduce the
air flow in the data center. The maintenance costs of the data center is high due to this reason. This
brings the challenge of reducing the power consumption as well as improving the scalability of the
data center.
There is a lot of cost involved in the establishment of a network in a data center and this
network is one of the main source of power consumption. Therefore, there is a need to accurately
characterize the data center network before its construction which requires the simulation of the
data center models. For the simulation of data center models, we require the traffic which is
identical to that of an actual data center so that the results will be similar to a real time data center.
Traditional data center networks have a wired communication fabric, which is not scalable
and contributes largely to the power consumption. This has led to the investigation of other
methods. There have been transceivers designed that can support the unlicensed 60 GHz spectrum,
supporting high bandwidth similar to the wired network present in traditional data centers. These
wireless links have spatial reusability and the data centers can make use of this communication
medium to meet the high bandwidth demands and also reduce the use of cable thereby bringing
v
This thesis studies the previous traffic models used in the simulation of a data center
network. Traffic collected from ten different data centers is then characterized and modelled based
on various probability distributions. The implementation of the model tries to generate traffic
similar to that of an actual data center. The Data Center Network is then simulated using the traffic
generated and the performance of the wired data center is quantified in terms of metrics like
vi
Table of Contents
Dedication ... ii
Acknowledgements ... iii
Abstract ... iv
Table of Contents ... vi
List of Figures ... viii
List of Tables ... ix
Glossary ... x
Chapter 1 Introduction ... 1
1.1. Motivation ... 2
1.2. Thesis Contributions ... 3
1.3. Thesis Layout ... 4
Chapter 2 Background and Related Work ... 5
Chapter 3 Characteristics, Modelling and Implementation of Data Center Traffic 7 3.1. Characteristics of Data Center Traffic ... 8
3.1.1. Overview of Data Centers used for characterization and collection of traffic ... 9
3.2 Modelling and Implementation of Data Center Traffic ... 13
3.2.1. Modelling of the Flow Arrival Rate... 13
3.2.2. Modelling of Topology, Source and Destination Nodes ... 14
3.3.3. Modelling of the Protocol for communication... 15
3.3.4. Modelling of the Flow Duration ... 16
vii
Chapter 4 Results and Analysis ... 21
4.1. Flow Arrival Rate ... 21
4.2. Source and Destination Node generation ... 23
4.3. Flow Duration, Transmission Rate and Flow Size ... 24
4.3.1. Flow Duration ... 25
4.3.2. Transmission Rate ... 26
4.3.3. Flow Size ... 28
Chapter 5 Conclusions ... 30
5.1. Concluding Remarks ... 31
5.2. Future Work ... 31
viii
List of Figures
Figure 1: Traffic Pattern over a period of five days ... 20
Figure 2: Traditional 3-Tier Data Center... 21
Figure 3: Flow Chart of the Implementation of Traffic Generation... 29
Figure 4: Example Graph of Number of events vs Time following Poisson.……… 31
Figure 5: Graph of Homogenous Poisson Process for Arrival rate……… 32
Figure 6: Split of the Intra rack and Inter rack flows………. 33
Figure 7: Pareto Distribution of the Flow Duration……… 34
Figure 8: PDF of the Generated Transmission Rate………..……… 36
Figure 9: Histogram of Transmission Rate …………..……… 36
Figure 10: The plot of Flow Duration vs CDF for Generated Traffic …………...…… 38
Figure 11: The plot of Log (Flow Size) vs CDF for Generated Traffic……….…..…… 38
ix
List of Tables
Table 1: Summary of Data Centers Studied ... 18
x
Glossary
DCN Data Center Network
ToR Top of Rack
LoS Line of Sight
1
Chapter 1 Introduction
Data Centers have become the backbone of the present digital world as they provide the
computing capabilities and the storage required for the billions of devices that are
connected to the internet. The raise in the number of data centers and the servers present in
them have contributed to the increase in the power consumption of the data centers. A
census by the Natural Resources Defense Council (NRDC) claimed that the energy
consumed by data centers were 91 billion kWh in 2013 and this is expected to reach 140
billion kWh by 2020 [1]. The increase in the number of servers in the data centers has
emphasized the importance of the interconnect architecture in terms of Power
consumption, latency and throughput. Traditionally, the data center networks (DCN) have
a tree based interconnect topology, utilizing copper and optical cable as the wired links
between the three levels of hierarchy namely core, aggregation and access in the tree
topology. A major disadvantage of such a topology is that the scalability of such an
interconnect topology is difficult and a result it cannot handle when the Data center
network is oversubscribed [2].
This wired interconnect fabric in the data center network, involves power hungry
switches/routers and large bundles of the wired cables which obstructs the flow of chilled
air which is blown into the data center for cooling. As the data center scales in size, the
number of power hungry switches/routers increase and the amount of cabling also
increases, causing maintenance challenges and increase in the power consumption of the
data center network [3].
The recent advancements in transceivers that utilize the unlicensed 60GHz wireless band
2
[4]. Recent advancements have shown that transceivers that operate in the 60GHz band,
consume low power in the range of mill watt [5][6]. Such Transceivers can communicate
over distances of about 10m and can establish multiple channels in the gigabit range for
communication [7]. The Spatial reusability of these 60 GHz channels gives room for
multiple concurrent links with the same datacenter. The low power consumption of the
transceivers combined with the spatial reusability of the 60 GHz channels makes this
technology an ideal use in low power wireless DCN.
1.1.
Motivation
Data Center Networks have been a heavily researched area both in the industry and the
academia due to the increase in the number of data centers and also the over reliance on
them for various computational and storage tasks on a daily basis. With the advent of cloud
computing, social networking etc. the number of data centers have increased tremendously.
The number of power hungry switches have increased causing increase in power
consumption. The scalability of data center networks becomes difficult with the ever
increasing resources in the Data Center. The ever growing Power consumption along with
the scalability issues needs to be addressed as they pose a significant challenge.
Various topologies have been proposed over the years to improve the efficiency of the data
center networks in terms of Power consumption, scalability, latency, throughput etc. Since
the construction of data center networks incurs significant costs, it is wiser to simulate a
data center environment to analyze if the data center network is able to provide the
3
In order to simulate the data center environment data center traffic which is similar to a
real world data center is required. Data center traffic information is typically proprietary
and difficult to get. Most of the data centers are completely enabled, but if we can
accurately model the data center network, this can be avoided and helps in reducing power
consumption. These data center network challenges provide the motivation for this work
and serve as the reason for characterizing and modelling data center network traffic.
1.2.
Thesis Contributions
This works seeks to characterize and model the data center traffic and also implement a
data center traffic generation mechanism for various configurations using MATLAB and
the mathematically modelled traffic parameters. The scalability of Data Center Networks
poses significant challenges as the number of power hungry switches in the interconnect
fabric increases, thereby increasing the power consumption. Different topologies have been
proposed over the years to address the issue of scalability and reduction in power
consumption. However, all topologies cannot be constructed as it involves lot of costs and
hence simulation of the data center network to evaluate the parameters is the way. In order
to get accurate simulation results, real world data center traffic is required for the
simulation. The characterization and mathematical modelling of the various parameters
involved in data center traffic are explained in depth in the third chapter.
This proposed work attempts to characterize and model data center traffic based on the
traffic available from ten different data centers. The traffic generation is implemented and
the characteristics of the generated traffic is then plotted and compared with the
4
simulate the data center environment and the various parameters like energy, latency and
throughput are compared. A primary objective of this proposed work is to implement the
data center traffic generation for various configurations and utilize the generated traffic to
simulate the data center network.
1.3.
Thesis Layout
This Chapter on Introduction speaks about the basic problems in a Data Center Network.
The increasing power consumption and the non-scalability of the data center networks are
the two major problems in the present day scenario. Chapter 2 gives a summary of the
background and related work. This section explains the various topologies which were
proposed to improve the scalability and decrease the Power consumption in the data center
networks. It also explains about the wireless 60GHz channel and its advantages and how it
can be used in a data center environment. Chapter 3 explains the characteristics of the data
center traffic and how can these be mathematically modelled in accordance with their
characteristics. The implementation details along with the generated traffic and their
reflection of the characteristics of data center traffic discussed in chapter 3, is shown in
Chapter 4 which is the Results and Analysis Section. Chapter 5 will finish with concluding
remarks, highlighting the main problems addressed and also include a brief outline of
5
Chapter 2 Background and Related Work
There are different approaches that have been proposed to address the data center design
issues such as energy consumption, cabling complexity, scalability, and over-subscription.
The most common topology used today in datacenter networks is a fat-tree topology. In
this topology, servers are connected through a hierarchy of access, aggregate and core layer
switches. The core switches also serve as gateways to the external Internet. The data centers
utilizing this topology result in a problem of congestion of oversubscription at the upper
levels of the hierarchy while the wired links cause maintenance challenges and obstructs
the path of chilled air for cooling [2] [9]. Several alternative DCN architectures such as
BCube [10], DCell [11], DOS [12], VL2 [13], Helios [14] has been proposed previously.
BCube is a recursive topology specially designed for shipping container based modular
data centers. DCell is also a recursively defined structure. DOS exploits wavelength routing
characteristics of a switching fabric based on an Arrayed Waveguide Grating Router that
allows contention resolution in the wavelength domain. VL2 uses Valiant Load Balancing
to spread traffic uniformly across network paths. Helios is a hybrid electrical and optical
switch architecture that can deliver significant reductions in the number of switching
elements. However, these innovations still rely on copper or optical cables and do not
eliminate the challenges due to a wired DCN with physical links. Wireless datacenters with
mm-wave inter-rack links are envisioned in to alleviate the issues of conventional DCNs
with bundles of cables [4] [15] [16] [17]. Most of the recent works on wireless datacenters
propose interconnecting entire racks of servers as units with 60GHz wireless links
primarily in order to utilize the commodity Ethernet switching between servers inside
6
establish wireless links between Top-of-Racks (ToRs) in the entire datacenter [17] [18].
Line-of-Sight (LoS) communication paths are necessary between the antennas for reliable
communication in a wireless datacenter [17]. Paths through metal frames and racks will
have increased losses due to obstructions. Hence, reflectors on ceilings and walls in the
form of metallic mirrors or signal relays can be mounted to form paths where direct LoS
does not exist [19]. In [20] a cylindrical arrangement of servers is proposed to create LoS
wireless links between servers. This however, requires non-traditional cylindrical
arrangement of servers having implications on cooling, server density and scalability of the
DCN which are not well known at this point.
Owing to its capability to deliver very high communication rates, the unlicensed 60GHz
wireless band has been the subject of attention for a number of years [21][22][23][24].
These efforts have led to the development and approval of the IEEE 802.11ad wireless
local area network (WLAN) standard in December of 2012 [25] [26]. This standard extends
the IEEE 802.11 family of WLAN standards to enable networking in the 60GHz unlicensed
spectrum band within the V-Band frequencies in the US and achieving data rates of up to
almost 7Gbps over distances of up to 10m [27]. A number of works have followed the
approval of the standard with the design of the corresponding transceivers [8][28] [29].
This thesis analyses the existing traffic models and does a comprehensive study on these
traffic models. A new traffic model is proposed and implemented which is similar to an
actual data center. This traffic model is then used to simulate a wireless Top of Rack data
center network and its power consumption, latency and throughput are analyzed and a
7
Chapter 3 Characteristics, Modelling and
Implementation of Data Center Traffic
The number of data centers have been on the raise with the advent of cloud computing,
social media and big data analytics. This has created public interest in data center networks
as the power consumption and the scalability of the data center networks becomes of
paramount importance. There have been many novel technologies proposed for data center
networks in order that their operations take place in an effective and efficient manner. It is
necessary to verify the characteristics such as power consumption, throughput, latency etc.
of the data center, before its actual construction as the construction of such data center
network incurs significant costs and it is practically difficult to conduct experiments with
so many routes and switches. The way to verify the characteristics and confirm proper
operations of the data center is through simulations and it must be ensured that these
simulations are very close to the real world data center. One important aspect of such
simulations is the traffic that will be used for simulating the data centers. It must be made
sure that the traffic used in simulations of the data center networks is close to an actual data
center. In many simulations Internet traffic has been used and over the years it has been
confirmed that the data center network traffic is not similar to an Internet Traffic.
Therefore, there is a need to analyze actual data center traffic and recognize the patterns
and try to characterize the various parameters involved in the data center traffic. The next
step would be to mathematically model these parameters and then finally implement them
8
3.1. Characteristics of Data Center Traffic
The main challenge is characterizing the parameters similar to that of an actual data center
traffic. In order to obtain accurate simulation results, the simulation environment must be
similar to that of the data center that is going to be built in terms of topology, interconnect
architecture, routers and switches etc. Previously, the traffic that was used for the purpose
of data center simulation was generated artificially based on mathematical models. These
mathematical models were built based on the characterization of Internet Traffic. However,
the actual data center characteristics are different from that of Internet Traffic.
There are different kinds of data centers which have different type of traffic. University
data center, private enterprise data center like google, Facebook etc. and cloud data centers
which are used for cloud computing are the different types of data center. These data
centers have been analyzed to see the type of applications in the different data centers,
average size of the flows and the time duration of these communications, the amount of
inter and intra rack communication etc.
There have been several improved network architectures proposed previously, but most of
them were not simulated with traffic similar to that of an actual data center. The
characteristics were not measured from any of the real world data center. In this thesis the
characterization has been done based on the measurement from ten different data centers.
The section below explains the various characteristics of the parameters involved in the
9
3.1.1. Overview of Data Centers used for characterization and
collection of traffic
The data sets from ten different data centers (3 university, 2 private enterprise and 5
commercial data centers) were collected and analyzed. Table 1 shows the summary of the
different data centers from which the traffic was analyzed.
Data Center Role Data Center Name Age (Years) Number of Devices Number of Servers Over Subscription
University EDU1 10 22 500 2:1
University EDU2 7 36 1093 47:1
University EDU3 1 1 147 147:1
Private PRV1 5 96 1088 8:3
Private PRV2 5 100 2000 48:10
Commercial CLD1 5 562 10K 20:1
Commercial CLD2 5 763 15K 20:1
Commercial CLD3 5 612 12K 20:1
Commercial CLD4 3 427 10K 20:1
Commercial CLD5 3 427 10K 20:1
Table 1: Summary of Data Centers Studied
It can be clearly seen that the number of severs in a commercial data center is more than a
private data center which in turn is more than a University data center. University and
private data centers are hosted nearby, whereas a commercial data center is distributed
throughout the world and hence the latency and other performance metrics become an
important factor. The traffic patterns was collected on 10 days by polling the switches and
nodes in the topology. The volume of traffic was observed in these data centers and the
sub-chapter below explains the same.
In this thesis, the traffic from several small size data centers running a typical
query-response type of applications like map-reduce and index lookup is used for the analysis
10
transmitted in a small size data center is typically small compared to the data centers
handling video applications.
3.1.1.1. Traffic Volume Characteristics of a Data Center
The data center networks are always enabled for a high workload but they usually work
well below their maximum possible workload. The traces collected from the data center
shows that the volume of traffic varies daily (checking email), weekly (uploading
documents), monthly (pay bills) and yearly (update address and other information). The
traffic traces show that the volume of traffic in the data center networks is at its peak during
[image:21.612.109.544.385.692.2]daytime and its least during night.
11
It can be seen from Figure 1 that the peak traffic is during the day and the traffic takes a
dip during the night and the levels of traffic is also different on different days. The
movement of this traffic in a data center is analyzed and characterized below.
3.1.1.2. Movement Characteristics of Data Center Traffic
Figure 2 shows us the topology of a generic data center. Traditionally, data centers had a
3-tier topology or 3 levels of hierarchy namely Core, Aggregation and Edge. The Edge
layer consists of Top-of-Rack switches which connects the cluster of servers to the Data
Center Network. The aggregation layer consists of devices which connects the switches in
[image:22.612.185.459.386.581.2]the edge layer together. Finally, the Core Layer connects the entire DCN to the WAN.
Figure 2: Traditional 3-Tier Data Center [31]
There will be the need for one server to communicate with another in various applications
and naturally there will be a source and a destination server for this communication.
12
the same rack, meaning that only the switches in the edge will be used for this type of
communication. This percentage could change depending on the type of data center under
consideration but will hold good for most cases. Applications of the same kind are arranged
close to each other so that they can communicate with the host easily thereby reducing the
cost of communication. This is the reason for the high percentage of intra rack traffic. The
remaining 20% of traffic takes place between servers located in different racks. The size
and Duration of these intra and inter rack traffic is an important parameter and these are
analyzed and characterized in the below section.
3.1.1.3. Size and Duration Characteristic of Data Center Traffic
The terminology “flow” refers to the sequence of data arriving at a particular instance of
time, transmitted from a source to a destination, of a certain size at a particular transmission
rate. The flow contains the details about the arrival time, source node, destination node,
size of that particular communication, transmission rate for that particular commination.
The analysis of the traffic from the ten data centers show that 80% of the traffic are less
than 11seconds in duration and less then 10Kb in size. It was seen that only 0.1% of the
flows lasted more than 200 seconds. The major volume of traffic is contributed by 10% of
the flows.
On plotting graphs for flow duration vs the CDF and flow size vs flow duration it was
found that there is no direct relationship between the flow duration and the flow size and
hence it is difficult to model them. However, the CDF of flow size over the duration shows
13
A correlating factor is required in order to model the relationship between the Flow
duration and the flow size. The transmission rate can be considered as the correlating factor
in this case.
Now that the parameters have been characterized, it is important to model them
mathematically and implement the same for the generation of the data center traffic.
3.2 Modelling and Implementation of Data Center Traffic
It has been well documented that the simulation of the data center network will require
traffic which is similar to real world data center. This is a necessity to get accurate results
and evaluate the performance of the data center network. In the previous section we have
seen how the various parameters have been characterized based on the data available from
the ten data centers. It is now important to accurately model these characteristics using
various mathematical tools for implementation and get the necessary traffic for
simulations. The primary traffic parameter is the arrival rate of the flows/traffic, which is
modelled in the below section.
3.2.1. Modelling of the Flow Arrival Rate
The Poisson Shot-Noise Process is used for modelling the data flow arrival in a data center
network. The flows are independent from each other [32]. Poisson distribution is an ideal
model only if the rate at which the event (flow arrival) occurs is a constant. However, the
flow arrival rates change and are different at different points in time. There are more
traffic/flows during the day and less during the night. Therefore, we need to model the
14
change in the arrival rate is slow compared to the flow generation interval (usually 1
second). Due to this reason we can model the arrival as a homogenous Poisson distribution
with a fixed arrival rate and the Poisson distribution is a good choice to represent the flow
arrival rate.
Mathematically, the number of flow arrivals can be represented as (1), where ‘N’ is the
total number of flows, Tstart is the flow start time and Tend is the end time of the flow
generation and λ(t) is the average flow arrival in a given time interval ‘t’.
𝑁 = ∫TstartTend λ(t)𝑑𝑥 (1)
The value for λ(t) for the implementation was 192, meaning an average of 192 flows arrived
every second. Depending on the number of flows required and simulation time this number
can be changed accordingly. The transmission of these flows from a source to a destination
is modelled in the following sections.
3.2.2. Modelling of Topology, Source and Destination Nodes
In a data center servers are piled up in the form of racks and servers handling similar
applications are kept in the same rack in order to reduce the communication cost. Hence
there are several racks of servers, which are connected to each other through a switch in a
traditional 3-tier data center as seen before. In the implementation, the total number of
racks has been set to 160 with each rack having 10 servers, thereby having a total of 1600
servers. These parameters can be played around depending on the required configuration
15
It is know from the previous analysis of the traffic data that 80% of the traffic stays within
the rack and only 20% is rack to rack communication. Therefore, selection of the source
and the destination nodes must be in such a way that 80% of the times, the source and
destination nodes are from the rack and 20% of the times they are from different racks.
This can modeled as a Bernoulli distribution with the probability of source and destination
being picked within the same rack is 0.8 and servers being picked from different racks in
0.2.
(2)
The Bernoulli distribution is given by (2), where ‘p’ represents the probability of servers
being picked are from the same rack and ‘q’ represents the probability of servers being
picked are from different racks. ‘p’ is equal to 0.8 as that is the probability of success that
servers being picked are from the same rack and ‘q’ is equal to 0.2 as that is the probability
of success that servers being picked are from different racks. The modelling of the protocol
for the different flows in followed up in the next section.
3.3.3. Modelling of the Protocol for Communication
There are two major protocols used in data center networks for communication between
servers namely TCP and UDP. It has been seen from the studies of the data center traffic
that 85% of the communications happens through the ‘TCP’ and 15% of the
communications take place through the ‘UDP’ [32]. Therefore, this can be modelled as a
16
(with a value equal to 0.85) and ‘q=1-p’ is the probability of ‘UDP’ protocol. The duration
for which each of these flows exists is modelled in the below mentioned section.
3.3.4. Modelling of the Flow Duration
From the analysis of the traffic data from the ten different data centers, it was seen that
80% of the flows last less than 11 seconds. On the other hand 0.1% of the flows last longer
than 200 seconds. This type of characteristic is similar to a Pareto distribution which was
originally used to describe of wealth among individuals. Larger portion of the wealth is
owned by a smaller percentage of people and vice versa. Therefore, the flow duration can
be modelled using a Pareto Distribution by adjusting the shape parameter ap and the scale
parameter Mp in the Pareto Distribution. When the values for ap and Mp were 1.504 and
1.0001, it represented the duration obtained from the traffic obtained from the ten data
centers, the best. The duration can be represented by the Pareto Distribution as shown in
(3).
(3)
The inter arrival time, which the time difference between two consecutive flow arrivals can
be represented by an exponential distribution. The modelling of the transmission rate and
the size of the flows is discussed in the below mentioned section.
3.3.5. Modelling of the Flow Transmission Rate and Size
It has been seen from the characteristics of the size and duration of the traffic that they are
17
from the characteristics discussed in previous chapter it can be concluded that they are in
a proportional relationship. Accurately modelling a Joint distribution for the size and the
duration is very difficult. To simplify the modelling, two distributions for the size and the
duration is used. The transmission rate is used to correlate the relationship between the size
and the duration. If, Sn is the size of the nth flow and Dn is the duration of the nth flow then
the mean transmission rate Yn correlates the size and the duration as in (4).
Sn = Yn . Dn (4)
In order to find Sn, we will need to find the distribution of Yn, for which we need to analyze
the transmission rate pattern from the traffic obtained from the ten different data centers.
Since the transmission rates are studied from the several traffic flows from the ten different
data centers, from the empirical observation, it can be concluded that the transmission rate
follows a Gaussian distribution. In general, any data that is studied over long periods of
time follows a Gaussian distribution. Yn,is modelled as a Gaussian distribution as shown
in (7) and Yn and Dn are independent random variables. In order to mathematically model
and implement the transmission rate we will need to find the mean and the variance of the
transmission rate as shown in (5) and (6).
(5)
18
From the above mentioned calculations, it was found that the mean of the transmission rate
of the traffic obtained from the ten data centers was 4.303 KBps and the standard deviation
was 264.45 Bps. Similarly, the mean of the size of the flows were found to be 8517.91
Bytes.
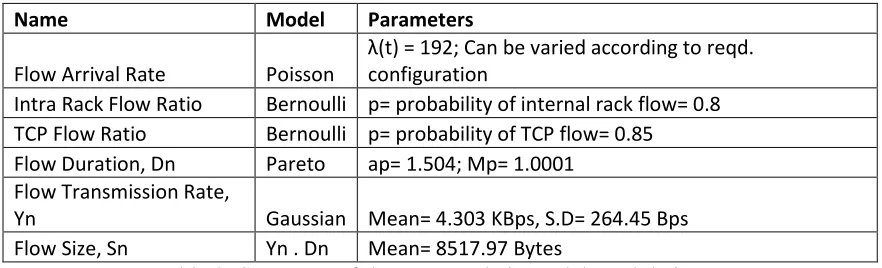
Name Model Parameters
Flow Arrival Rate Poisson
λ(t) = 192; Can be varied according to reqd. configuration
Intra Rack Flow Ratio Bernoulli p= probability of internal rack flow= 0.8 TCP Flow Ratio Bernoulli p= probability of TCP flow= 0.85
Flow Duration, Dn Pareto ap= 1.504; Mp= 1.0001 Flow Transmission Rate,
[image:29.612.86.527.346.480.2]Yn Gaussian Mean= 4.303 KBps, S.D= 264.45 Bps Flow Size, Sn Yn . Dn Mean= 8517.97 Bytes
Table 2: Summary of the Names, their models and their parameters
Table (2) summarizes how the various parts of the flows are mathematically modelled
along with their respective parameters.
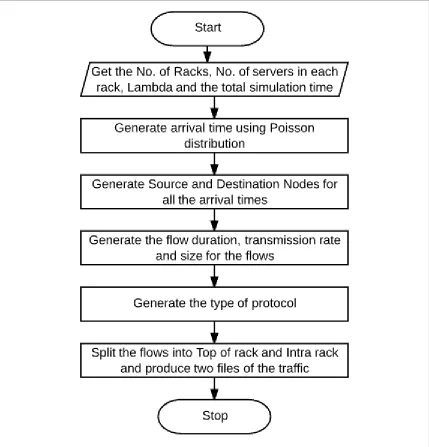
Figure 3 is the flowchart of the implementation of the Traffic Generation. The
configuration of the Data center network is obtained as the first step. This includes
information such as the number of racks of servers present in the data center, the number
19
and the value of arrival, in case it needs to be manually changed. The default value for
lambda is 192. The total simulation time and the value of lambda is passed as arguments
to the function implementing the arrivals rates based on a Poisson distribution, and also
returns the total number of flow arrivals for the entire simulation duration. The total number
of flows along with the number of racks and the number of servers is then passed on to the
function implementing the start and end node generation, which then produces pairs of
source and destination nodes, in the same rack based on Bernoulli distribution with a
probability of success of 0.8 and in different racks with a probability of 0.2. The number
of flows is then passed to the function which generates the rate, duration and the size for
the flows based on the distributions and parameters mentioned in Table 2. The protocol for
all the flows is then generated based on a Bernoulli distribution with ‘TCP’ having a
success rate of 0.85 and ‘UDP’ having a success rate of 0.15. The traffic is then split into
20
21
Chapter 4 Results and Analysis
The characteristics and the modelling of the data center traffic was done in the previous
chapter. The characteristics that have been mathematically modelled was then implemented
using MATLAB and its inbuilt functions. Individual functions were written to generate the
flow arrival rate (based on Poisson distribution), Start and End node generation (80% Intra
Rack and 20% Inter rack), Flow Duration, Transmission Rate and Flow Size (Pareto,
Gaussian and Product of the two distributions). A main script was written which takes the
Number of racks of servers present in the data center, the number of servers present in each
rack, the total time duration of the simulation and the value of lambda as the inputs and
will pass on these parameters to the various functions to generate the required data center
traffic. The evaluation of the implementation of the traffic generation was done by plotting
the graphs for the various traffic characteristics described in the previous section and
comparing them with the graphs of the distribution of those probability distributions as
well as comparing the graphs plotted in the previous papers for the various traffic
characteristics and comparing those with the same graphs produced by the generated
traffic. In the implementation, the Number of racks of servers present in the data center
was 160, the number of servers present in each rack was 10, the total time duration of the
simulation was 100 seconds and the value of lambda was 50.
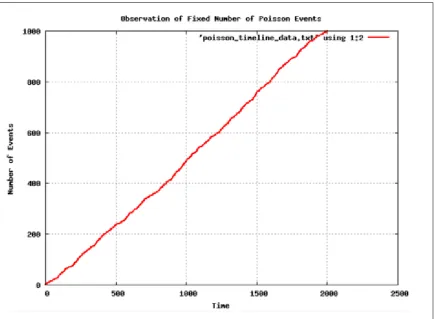
4.1. Flow Arrival Rate
From the characteristics it was mathematically modelled that the flow arrival rate follows
22
the value of lambda was fixed to 50 to limit the total number of flows for the total
simulation time.
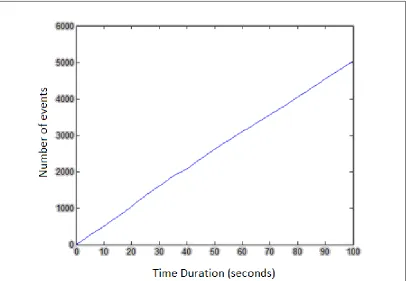
It can be seen from figure 4 how the number of events over time keeps increasing gradually
for a homogenous Poisson process. Similarly from the implementation of the arrival rate
for the traffic generation figure 5 was plotted for the number of events vs the entire
[image:33.612.110.545.157.476.2]simulation period of 100s and the above graph was obtained.
Figure 4: Example Graph of Number of events vs Time following Poisson
23
4.2. Source and Destination Node generation
It was seen from the characteristics of the data center traffic that 80% of the traffic stayed
within the rack (intra rack) and only 20% of the traffic left the rack (inter rack). This was
modelled as a Bernoulli distribution with the probability of the source and destination
nodes from the same rack being 0.8 and the probability of the source and destination being
from different racks being 0.2.
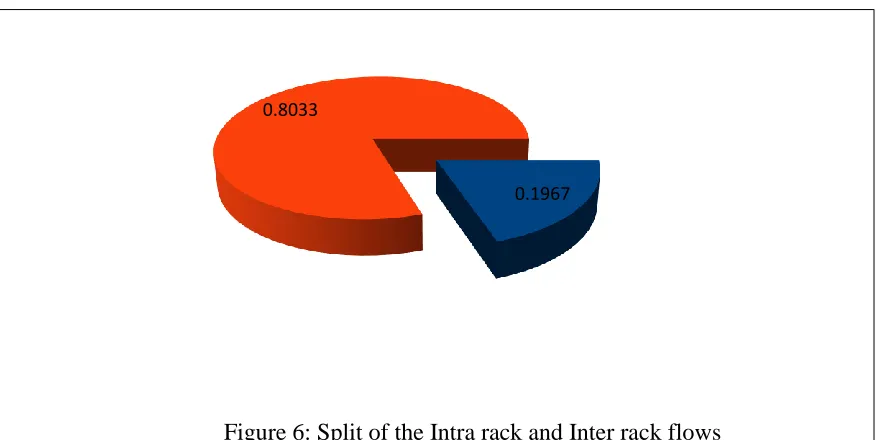
In the implementation, from a total 4926 flows that were generated 3957 flows were intra
rack contributing to 80.33% of the total number of flows and 969 flows were inter rack
contributing to 19.67% of the total number of flows. Figure 6 shows a pictorial
[image:34.612.119.525.69.350.2]24
Pie Chart as shown below, 80.33% (marked in red) of the flows are intra rack flows,
meaning the communication stays within the rack and only 19.67% (marked in blue) of the
flows move from one rack to another. This is in conformance to the characteristics observed
in the Data Center traffic and helps in evaluating the generated traffic.
4.3. Flow Duration, Transmission Rate and Flow Size
As documented in the previous chapter the relationship between the Flow duration and the
Flow size is not linear but a proportional relationship. Instead of having a joint distribution
of the flow duration and the size, we have two distributions for the duration and size and
correlate them using the transmission rate. The duration was modeled as a Pareto
distribution and the Transmission rate was modelled as Gaussian distribution. The Flow
[image:35.612.109.550.180.400.2]size was modeled as a product of the transmission rate and the flow duration. Figure 6: Split of the Intra rack and Inter rack flows
25
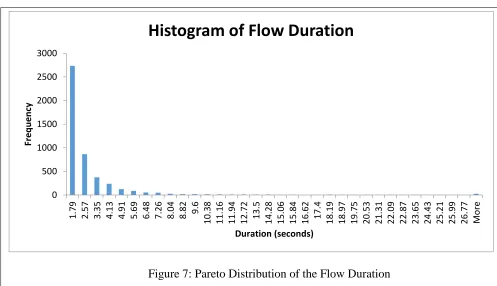
4.3.1. Flow Duration
According to the characteristics mentioned, 80% of the flows last less than 11 seconds and
only 0.1% of the flows last longer than 200 seconds. This was modeled as a Pareto
Distribution, which was used to describe the wealth owned by people. In a Harvard
Business Review which classified the wealth among people of America, it used a Pareto
Distribution.
The Pareto distribution was used as a part of the Harvard Business Review on wealth
distribution in the United States of America was used to show that the larger portion of the
wealth was owned by a smaller population and the smaller portion of the wealth was owned
by a larger population. This is similar to the traits of the Flow duration. Large number of
flows have a small duration and a small number of flows have a large duration. The value
[image:36.612.85.582.244.530.2]of the shape parameter was taken as 1.504 and that of the scale parameter was taken as Figure 7: Pareto Distribution of the Flow Duration
0 500 1000 1500 2000 2500 3000 1.7 9 2.5 7 3.3 5 4.1 3 4.9 1 5.6 9 6.4 8 7.2 6 8.0 4 8.8 2 9.6 10 .38 11 .16 11 .94 12
.72 13.5
14 .28 15 .06 15 .84 16
.62 17.4
18 .19 18 .97 19 .75 20 .53 21 .31 22 .09 22 .87 23 .65 24 .43 25 .21 25 .99 26 .77 Mo re Fr e q u e n cy Duration (seconds)
26
1.0001 for the implementation of the duration as a Pareto distribution. Upon
implementation of the flow duration as a part of the traffic flow generation the histogram
of flow duration was plotted. Figure 7 represents the histogram of the flow duration which
is similar to a Pareto distribution. It was also verified that 80% of the flows lasted less than
11 seconds.
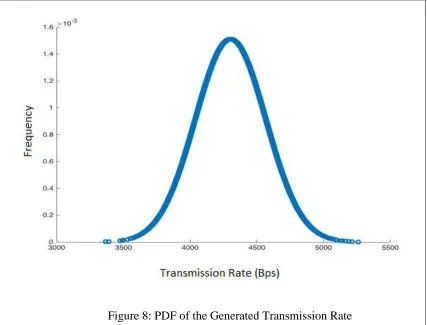
4.3.2. Transmission Rate
The transmission rate which is used to correlate the Flow duration and the Flow size is
modelled as a Gaussian distribution. The mean for the Gaussian distribution was 4.303
KBps and its standard deviation was 264.45 Bps. The same was implemented in MATLAB
and the transmission rates for the flows were obtained as a part of the traffic generation.
Upon implementation of the traffic generation, the Probability Distribution Function of the
transmission rate was plotted and Figure 8 was obtained as its result. It can be seen that the
mean is the point in x-axis for which the graph has the maximum value of y and this case
the mean between 4000 and 4500, approximately close to 4300 which is the requirement
for the transmission rate in the traffic generation.
Figure 9 shows the histogram of the transmission rate plotted from the transmission rates
27
[image:38.612.108.537.434.698.2]Figure 8: PDF of the Generated Transmission Rate
28
4.3.3. Flow Size
The flow duration and the flow size are not in a linear but a proportional relationship.
Instead of having a joint distribution of the flow duration and the size, we have two
distributions for the duration and size and correlate them using the transmission rate. The
flow size is given as the product between the Duration and the Transmission rate which
correlates them. Once the Flow Duration and Transmission rates have been individually
modelled and generated, they are multiplied in order to get the Flow size. Since the
Duration and the Transmission are not a joint distribution, the distribution is the size cannot
be accurately modelled as a distribution. Hence, once the Flow size is generated, the
various plots are generated and these are compared with similar plots generated by the
original data center traffic to verify is correctness. Some of the plot that are generated upon
implementation of the traffic generation are the Flow Duration vs CDF, the Log (Flow
Size) vs CDF, the size vs the duration. These plots are then compared with the similar plots
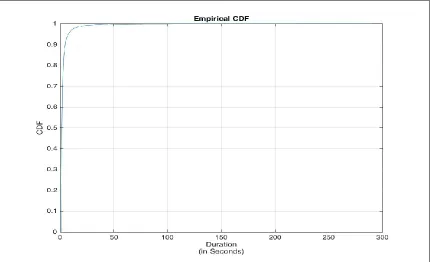
generated from the original data center traffic. Figure 10 depicts the plot of Flow Duration
vs CDF for the generated traffic, which is how the graph is expected to be from the
characteristics of the data center traffic. Figure 11 depicts the plot of Log (Flow Size) vs
CDF for the Generated Traffic, which is how the graph is expected to be from the
characteristics of the data center traffic. . Figure 12 shows the plot of the cumulative
distribution of the flow size over flow duration and it can be clearly seen that their
29
[image:40.612.111.539.404.674.2]Figure 10: The plot of Flow Duration vs CDF for Generated Traffic
30
The graph above reiterates the fact that there is no accurate mathematical model to
represent the relationship between the flow size and the flow duration. From the above
graph it can be seen that the flow size and the duration are in a proportional relationship,
but not in a linear relationship. The flow size keeps increasing initially, after which it seems
to become a constant. Additionally, as the flow duration increases the transmission rate
[image:41.612.110.539.73.411.2]decreases.
31
Chapter 5 Conclusions
5.1. Concluding Remarks
In this work data center Traffic was characterized, modelled and implemented and the plots
of the implemented Traffic was compared with the way it was modelled for verification.
The Arrival rate was modelled as a Homogenous Poisson Distribution with a Lambda value
of 50, simulation time as 100 seconds, the number of racks of servers in data center as 160
and the number of servers in each rack as 10. The Source and destination node was
modelled as a Bernoulli distribution with 80% of data staying within the rack and 20%
moving from one rack to another. The Flow Duration was modelled as a Poisson
distribution with appropriate shape and scale parameters. The Transmission rate was
modelled as a Gaussian distribution with appropriate mean and variance. The flow size was
computed as a product of the transmission rate and duration.
The Traffic was generated for the simulation of the data center network. The plots of the
various parameters of the traffic was generated for verification. The configuration of the
data center network can be changed and different traffic can be generated as per our
requirement.
5.2. Future Work
This work provides an in depth analysis of the data center traffic. The characterization,
modelling of the traffic was explained and the same was implemented and verified at the
flow level. The method generates data center network traffic at the flow level. However,
32
arrival rate, ratio of traffic in same rack, flow duration and size and the transmission rates
are appropriately characterized. One of the main future tasks would be to develop the traffic
at the network packet level. The characteristics of the packets in the data center network
needs to be studied in depth. These characteristics need to be mathematically modelled
using appropriate distributions followed by the implementation of the Data Center Traffic
33
Bibliography
[1]National Resources Defense Council, “Data Center Efficiency Assessment,” NRDC, Issue
Paper IP-14-08-A, Aug. 2014.
[2]M. Chen, H. Jin, Y. Wen, and V. C. M. Leung, “Enabling technologies for future data
center networking: a primer,” IEEE Network, vol. 27, no. 4, pp. 8–15, 2013.
[3]M. Pedram, “Energy-Efficient Datacenters”, IEEE Transactions on Computer Aided
Design of Integrated Circuits and Systems, Vol. 31, No. 10, October, 2012.
[4]E. Baccour, S. Foufou, R. Hamila and M. Hamdi, "A survey of wireless data center
networks," Information Sciences and Systems (CISS), 2015 49th Annual Conference on,
Baltimore, MD, 2015, pp. 1-6.
[5]Tomkins, A.; Aroca, R.A.; Yamamoto, T.; Nicolson, S.T.; Doi, Y.; Voinigescu, S.P., "A
Zero-IF 60 GHz 65 nm CMOS Transceiver With Direct BPSK Modulation Demonstrating up to 6 Gb/s Data Rates Over a 2 m Wireless Link," Solid-State Circuits, IEEE Journal of , vol.44, no.8, pp.2085,2099, Aug. 2009
[6]Marcu, C.; Chowdhury, D.; Thakkar, C.; Ling-Kai Kong; Tabesh, M.; Jung-Dong Park;
Yanjie Wang; Afshar, B.; Gupta, A.; Arbabian, A.; Gambini, S.; Zamani, R.; Niknejad, A.M.; Alon, E., "A 90nm CMOS low-power 60GHz transceiver with integrated baseband circuitry," Solid-State Circuits Conference - Digest of Technical Papers, 2009. ISSCC 2009. IEEE International , vol., no., pp.314,315,315a, 8-12 Feb. 2009
[7]Floyd, B.; Reynolds, S.; Pfeiffer, U.; Beukema, T.; Grzyb, J.; Haymes, C., "A silicon
60GHz receiver and transmitter chipset for broadband communications," Solid-State Circuits Conference, 2006. ISSCC 2006. Digest of Technical Papers. IEEE International , vol., no., pp.649,658, 6-9 Feb. 2006
[8]Y. Cui, H. Wang, X. Cheng and B. Chen, "Wireless data center networking," in IEEE
Wireless Communications, vol. 18, no. 6, pp. 46-53, December 2011.
[9]D. Halperin, S. Kandula, J. Padhye, P. Bahl, and D. Wetherall, “Augmenting data center
networks with multi-gigabit wireless links,” ACM SIGCOMM Computer Communication
Review SIGCOMM Comput. Commun. Rev., vol. 41, no. 4, p. 38, 2011.
[10]J.-Y. Shin, E. G. Sirer, H. Weatherspoon, and D. Kirovski, “On the Feasibility of
Completely Wirelesss Datacenters,” IEEE/ACM Transactions on Networking IEEE/ACM
Trans. Networking, vol. 21, no. 5, pp. 1666–1679, 2013.
[11]K. Bilal, S. U. Khan, and A. Y. Zomaya, “Green Data Center Networks: Challenges and
Opportunities,” 2013 11th International Conference on Frontiers of Information
Technology, 2013.
[12]Ranachandran, K., et al. 60GHz data-center networking: wireless => worryless? NEC
Technical Report (2008).
[13]Reem Alshahrani and Hassan Peyravi. 2014. Modeling and simulation of data center
networks. In Proceedings of the 2nd ACM SIGSIM Conference on Principles of Advanced Discrete Simulation (SIGSIM PADS '14). ACM, New York, NY, USA, 75-82.
[14]K. Wu, J. Xiao, and L. M. Ni, “Rethinking the architecture design of data center
34
[15]X. Zhou, Z. Zhang, Y. Zhu, Y. Li, S. Kumar, A. Vahdat, B. Y. Zhao, and H. Zheng,
“Mirror on the ceiling,” ACM SIGCOMM Computer Communication Review SIGCOMM
Comput. Commun. Rev., vol. 42, no. 4, p. 443, 2012.
[16]L. Peng et al., “A Novel Approach to Optical Switching for Intra-Datacenter
Networking,” IEEE/OSA J. Lightwave Tech., vol. 30, no. 2, Jan. 2012, pp. 252–66.
[17]M. Z. Zaaimia, R. Touhami, V. A. Fono, L. Talbi and M. Nedil, “60GHz Wireless Data
Center Channel Measurements: Initial Results”, IEEE International Conference on Ultra-Wideband (ICUWB), 2014.
[18]Y. Zhao, H. Chen, J. Xu, H. Tan, and T. Chen, “Mirror Data to the Ceiling: A New
Completely Wireless Data Center,” Frontiers in Internet Technologies Communications in
Computer and Information Science, pp. 32–45, 2015.
[19]X. Zhou, Z. Zhang, Y. Zhu, Y. Li, S. Kumar, A. Vahdat, B. Y. Zhao, and H. Zheng,
“Mirror on the ceiling,” ACM SIGCOMM Computer Communication Review SIGCOMM
Comput. Commun. Rev., vol. 42, no. 4, p. 443, 2012.
[20]W. Zhang, X. Zhou, L. Yang, Z. Zhang, B. Y. Zhao, and H. Zheng, “3D beamforming for
wireless data centers,” Proceedings of the 10th ACM Workshop on Hot Topics in Networks
- HotNets '11, 2011.
[21]The ns-3 network simulator. [Online] Available: http://www.nsnam.org/
[22]Agilent Technologies. (2013 May). Wireless LAN at 60 GHz - IEEE 802.11ad Explained.
[On-line]. Available: http://cp.literature.agilent.com/litweb/pdf/59909697EN.pdf
[23]Amendment of Parts 2, 15 and 97 of the Commission's Rules to Permit Use of Radio
Frequencies Above 40 GHz for New Radio Applications, FCC 95-499, ET Docket No. 94- 124, RM-8308, Dec. 15, 1995.
[24]Data Center Size and Density, Springfield, Australia: AFCOM, Version 3.0, Oct. 2014.
[25]IEEE Approved Draft Standard for LAN - Specific Requirements - Part 11: Wireless LAN
Medium Access Control (MAC) and Physical Layer (PHY) Specifications - Amendment 3: Enhancements for Very High Throughput in the 60 GHz Band, IEEE P802.11ad/D9.0, July 2012 (Draft Amendment based on IEEE 802.11-2012), 2012.
[26]Y. Katayama, K. Takano, Y. Kohda, N. Ohba, and D. Nakano, “Wireless Data Center
Networking with Steered-Beam mmWave Links,” In WCNC, 2011.
[27]Revision of Part 15 of the Commission’s Rules Regarding Operation in the 57-64 GHz
Band, FCC 13-112, ET Docket No. 07-113, RM-11104, Aug. 9, 2013.
[28]T. Manabe, Y. Miura, and T. Ihara, “Effects of antenna directivity on indoor multipath
propagation characteristics at 60 GHz,” In PIMRC, 1995.
[29]WirelessHD Specification Overview, Aug. 2009, [Online] Available:
http://www.wirelesshd.org/
wpcontent/uploads/2009/12/WirelessHDSpecification-Overview-v1-0-4-Aug09.pdf.
[30]IEEE Standard for Information technology – Telecommunications and information
35
(PHY) Specifications for High Rate Wireless Personal Area Networks (WPANs) Amendment 2: Millimeter-wavebased Alternative Physical Layer Extension, IEEE Std 802.15.3c-2009 (Amendment to IEEE Std 802.15.32003), Oct. 2009.
[31]Benson, Theophilus, Aditya Akella, and David A. Maltz. "Network traffic characteristics
of data centers in the wild." Proceedings of the 10th ACM SIGCOMM conference on
Internet measurement. ACM, 2010.
[32]Han, Yoonseon, Jae-Hyoung Yoo, and James Won-Ki Hong. "Poisson shot-noise process
based flow-level traffic matrix generation for data center networks." Integrated Network
Management (IM), 2015 IFIP/IEEE International Symposium on. IEEE, 2015.
[33]Heller, Brandon, et al. "ElasticTree: Saving Energy in Data Center Networks." Nsdi. Vol.
10. 2010.
[34]Kandula, Srikanth, et al. "The nature of data center traffic: measurements &
analysis." Proceedings of the 9th ACM SIGCOMM conference on Internet measurement conference. ACM, 2009.
[35]Barakat, Chadi, et al. "A flow-based model for internet backbone traffic." Proceedings of
the 2nd ACM SIGCOMM Workshop on Internet measurement. ACM, 2002.
[36]Benson, Theophilus, et al. "Understanding data center traffic characteristics." ACM
![Figure 1: Traffic Pattern over a period of five days [33]](https://thumb-us.123doks.com/thumbv2/123dok_us/33662.2655/21.612.109.544.385.692/figure-traffic-pattern-period-days.webp)
![Figure 2: Traditional 3-Tier Data Center [31]](https://thumb-us.123doks.com/thumbv2/123dok_us/33662.2655/22.612.185.459.386.581/figure-traditional-tier-data-center.webp)