Inositol Biosynthetic Genes
Jason King1¤, Melanie Keim1, Regina Teo1, Karin E. Weening1, Mridu Kapur1, Karina McQuillan1, Jonathan Ryves1, Ben Rogers1, Emma Dalton1, Robin S. B. Williams2, Adrian J. Harwood1*
1School of Biosciences, Cardiff University, Cardiff, United Kingdom,2School of Biological Sciences, Royal Holloway, University of London, Egham, Surrey, United Kingdom
Abstract
Lithium (Li+) is a common treatment for bipolar mood disorder, a major psychiatric illness with a lifetime prevalence of more than 1%. Risk of bipolar disorder is heavily influenced by genetic predisposition, but is a complex genetic trait and, to date, genetic studies have provided little insight into its molecular origins. An alternative approach is to investigate the genetics of Li+sensitivity. Using the social amoebaDictyostelium, we previously identified prolyl oligopeptidase (PO) as a modulator of Li+ sensitivity. In a link to the clinic, PO enzyme activity is altered in bipolar disorder patients. Further studies demonstrated that PO is a negative regulator of inositol(1,4,5)trisphosphate (IP3) synthesis, a Li+sensitive intracellular signal.
However, it was unclear how PO could influence either Li+sensitivity or risk of bipolar disorder. Here we show that in both Dictyosteliumand cultured human cells PO acts via Multiple Inositol Polyphosphate Phosphatase (Mipp1) to control gene expression. This reveals a novel, gene regulatory network that modulates inositol metabolism and Li+sensitivity. Among its targets is the inositol monophosphatase gene IMPA2, which has also been associated with risk of bipolar disorder in some family studies, and our observations offer a cellular signalling pathway in which PO activity and IMPA2 gene expression converge.
Citation:King J, Keim M, Teo R, Weening KE, Kapur M, et al. (2010) Genetic Control of Lithium Sensitivity and Regulation of Inositol Biosynthetic Genes. PLoS ONE 5(6): e11151. doi:10.1371/journal.pone.0011151
Editor:Robert Alan Arkowitz, CNRS UMR6543, Universite´ de Nice, Sophia Antipolis, France
ReceivedJanuary 11, 2010;AcceptedMarch 30, 2010;PublishedJune 17, 2010
Copyright:ß2010 King et al. This is an open-access article distributed under the terms of the Creative Commons Attribution License, which permits unrestricted use, distribution, and reproduction in any medium, provided the original author and source are credited.
Funding:This work was supported by a Wellcome Trust Programme Grant to AJH (74540) and a BBSRC committee studentship to JSK. The funders had no role in study design, data collection and analysis, decision to publish, or preparation of the manuscript.
Competing Interests:The authors have declared that no competing interests exist.
* E-mail: harwoodaj@cf.ac.uk
¤ Current address: CR-UK Beatson Institute for Cancer Research, Glasgow, United Kingdom
Introduction
Bipolar mood disorder is a common psychiatric disorder, which is treated using mood stabilizer drugs, such as lithium (Li+). There is a strong genetic component to risk of developing bipolar disorder, however this is a complex genetic trait and no consensus candidate susceptibility genes have yet emerged from those identified in individual family studies [1]. Genetics is not the only factor affecting risk, and twin studies demonstrate the presence of environmental inputs [2,3]. Environmental risk factors include lifetime events and psychosocial stressors, physical illnesses and hormonal imbalances [4]. Onset of bipolar disorder is most frequent during late adolescence and early adulthood suggesting contributions from developmental and physiological mechanisms. As in the case of genetics, the biological mechanisms underlying environmental risk are also unclear.
An alternative approach is to investigate the therapeutic mechanisms of the mood stabilizer drugs used to treatment bipolar disorder. Li+is the most widely used mood stabilizer, taken by 50% of bipolar patients. It is an effective prophylactic agent and good anti-manic, but a weaker anti-depressant treatment [5]. Inositol monophosphatase (IMPase) and Inositol 1-polyphospha-tase (IPP) are direct biochemical targets of Li+ [6,7], and Li+ treatment leads to reduced inositol synthesis and suppression of inositol phosphate (IP) signalling. Consequently, it has been proposed that the neurological processes underlying bipolar mood
disorder are susceptible to aberrant IP signalling [8]. Consistent with this hypothesis, the structurally unrelated mood stabilizers valproic acid (VPA) and carbamazepine also deplete inositol [9,10], indicating a wider association between mood stabilizers and IP signalling.
To understand why Li+is an effective therapy, we undertook a genetic screen for Li+resistance in the social amoebaDictyostelium. This identified the serine protease prolyl oligopeptidase (PO) as a modulator of Li+ sensitivity [11]. Interestingly, reduced PO activity has been associated with bipolar disorder [12,13,14]. We found that ablation of the PO gene or inhibition of PO enzyme activity is accompanied by an increase in inositol(1,4,5)trispho-sphate (IP3) production. This inhibitory interaction is conserved in
mammalian cells as reduced PO activity increases IP3 in
astroglioma and COS-7 kidney cell lines [10,15]. These effects are manifest at the cellular level where PO inhibition both reverses the effects of Li+, VPA and carbamazepine on neuronal growth cone morphology and stimulates removal of protein aggregates via macro-autophagy [9,10,16,17].
The mechanism by which PO controls Li+sensitivity has not been established. InitialDictyosteliumstudies showed that PO null mutants had unaltered phospholipase C activity but increased activity of two inositol phosphate phosphatases. One phosphatase activity corresponds to multiple inositol polyphosphate phospha-tase (Mipp1), which dephosphorylates IP6to IP3. The other is an
I(1,4)P2[11]. Here, we report that Mipp1 is required to mediate
the effects of PO on Li+sensitivity. Furthermore, we show that these effects do not arise through direct elevation of IP3production
as previously assumed, but are due to changes in the expression of genes involved in inositol synthesis and metabolism, including inositol synthase (ino1), IMPase (impA1) and theDictyosteliumIP3
5-phosphatase (Dd5P3). Finally, we show that this PO mediated regulation of gene expression is conserved in human cells where among its targets is IMPA2, a gene associated with risk in some bipolar disorder patient family studies. Our observations suggest a signalling pathway that could connect altered PO mediated signalling to aberrant IMPA2 gene regulation.
Results
DictyosteliumPO, dpoA, reduces the effect of Li+on chemotaxis
StarvedDictyosteliumcells aggregate by cAMP-mediated chemo-taxis to form a multicellular mass of 100,000 cells, which develops further into a fruiting body of spore and stalk cells [18]. We found
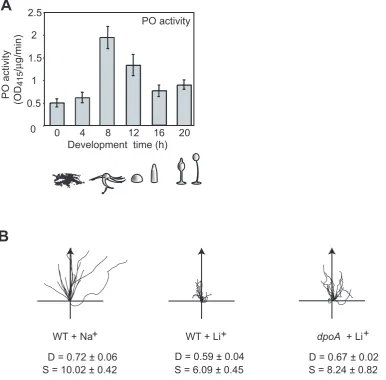
that PO activity is regulated throughoutDictyosteliumdevelopment, peaking during late aggregation and early multicellular stages (Figure 1A), indicative of a regulatory function.
Li+ treatment of wild type cells has a specific effect on chemotaxis, causing reduced cell speed and Directionality (a measure of the linearity of the cell path) [19]. We found that chemotaxis ofdpoAmutant cells was less sensitive to Li+, with cells exhibiting greater speed and Directionality in the presence of Li+ than wild type cells (Figure 1B; Table 1). We also noted thatdpoA mutant cells exhibited increased speed of movement in control conditions, treatment with NaCl, suggesting that DpoA suppresses this aspect of the chemotaxis response.
DictyosteliumPO acts via Multiple Inositol Polyphosphate Phosphatase (Mipp1)
Previous results indicated that loss of dpoA is associated with increased activity of multiple inositol polyphosphate phosphatase (MIPP), an enzyme that dephosphorylates IP6, IP5and certain IP4
species to form IP3 [11]. TheDictyostelium genome contains two
[image:2.612.61.448.293.673.2]homologues of the mammalian MIPP, however only one gene,
Figure 1. Loss ofdpoAreduces Li+sensitivity. A, PO activity peaks at 8 hours ofDictyosteliumdevelopment, and then declines to levels only slightly higher than in growing cells (0 hours of development). Error Bars: mean6standard error of 3 independent experiments. Peak activity corresponds to streaming and mound developmental stages.B, Cell tracks of wild type and mutant cells in 7 mM LiCl (or control of 7 mM NaCl) during chemotaxis along a 1 nM/mm cAMP gradient (direction of arrow). D = Directionality, S = cell speed (mm/min).dpoAnull mutants have a reduced Li+sensitivity, showing higher Directionality and speed than wild type in Li+.
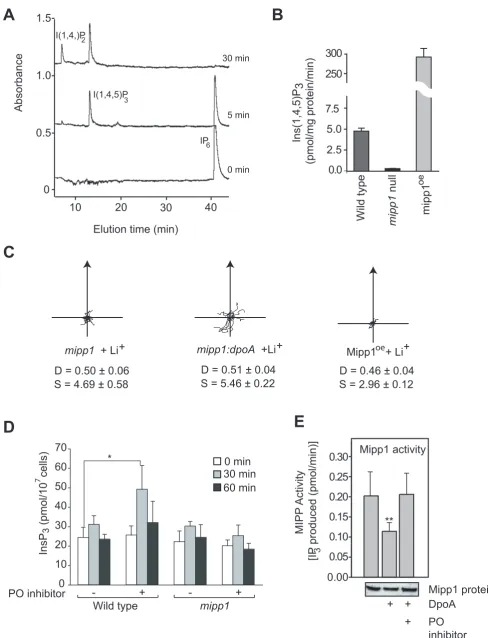
denoted mipp1, is expressed in growing cells and during development (data not shown). We generated null mutant cell strains, which lack themipp1gene, and strains that over-expressed Dictyostelium Mipp1. These latter strains were a useful source of Mipp1 enzyme, which was used to show that Mipp1 rapidly converts IP6to IP3(Figure 2A).mipp1null mutants completely lack
Mipp activity and Mipp1 over-expressors greatly enhanced activity (Figure 2B). However, total mass measurement of all inositol phosphates (IPs) showed that loss of mipp1 had no significant effect on the overall concentrations of IP4, IP5 and
IP6(data not shown) suggesting that Mipp1 regulates only a small
proportion of the cellular IPs. Such robustness in the cellular content of the higher order IPs has been observed previously and means that small changes of the IP species involved in signalling may be masked behind larger non-dynamic IP populations [20].
Chemotaxis of mipp1 null mutants was hypersensitive to Li+ (Figure 2C), the opposite phenotype ofdpoAmutant cells. Double dpoA:mipp1 null mutant cells possess a similar Li+hypersensitive phenotype tomipp1null cells (Figure 2C), indicating that Mipp1
activity is required for PO mediated signalling. Consistent with this we found that elevation of IP3 following PO inhibition was also
dependent on Mipp1. The IP3 concentration of wild type cells
doubled within 30 minutes of addition of the PO inhibitor Z-pro-L-prolinal (Figure 2D). This increase was transient and IP3
returned to basal levels after 60 minutes. PO inhibitors were unable to elevate IP3inmipp1null mutants (Figure 2D).
[image:3.612.60.561.78.402.2]To investigate the interaction between PO and Mipp1 at the biochemical level, we pre-incubated Mipp1 extracts with bacterially produced recombinant DpoA protein, and then monitored Mipp1 activity. Incubation with DpoA enzyme caused an approximate two-fold decrease in Mipp1 activity, an effect reversed by treatment with PO inhibitor (Figure 2E). However, there was no change in the abundance or size of the Mipp1 protein following PO treatment (Figure 2E), arguing against direct proteolysis. Mipp1 is extracted as a membranous particulate fraction and the most likely explanation is that PO acts on a yet unidentified, co-purified intermediate protein or peptide. These results however do indicate a close association between PO activity and Mipp1 regulation.
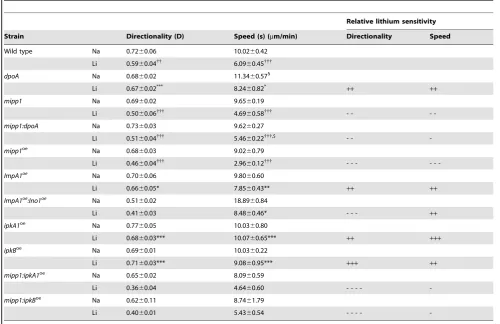
Table 1.Chemotactic analysis of lithium sensitivity.
Relative lithium sensitivity
Strain Directionality (D) Speed (s) (mm/min) Directionality Speed
Wild type Na 0.7260.06 10.0260.42
Li 0.5960.04{{
6.0960.45{{{
dpoA Na 0.6860.02 11.3460.571
Li 0.6760.02***
8.2460.82* ++ ++
mipp1 Na 0.6960.02 9.6560.19
Li 0.5060.06{{{
4.6960.58{{{
- -
-mipp1:dpoA Na 0.7360.03 9.6260.27
Li 0.5160.04{{{ 5.4660.22{{{,$ - -
-mipp1oe
Na 0.6860.03 9.0260.79
Li 0.4660.04{{{
2.9660.12{{{
- - -
-ImpA1oe Na 0.7060.06 9.8060.60
Li 0.6660.05* 7.8560.43** ++ ++
ImpA1oe :Ino1oe
Na 0.5160.02 18.8960.84
Li 0.4160.03 8.4860.46* - - - ++
ipkA1oe
Na 0.7760.05 10.0360.80
Li 0.6860.03*** 10.0760.65*** ++ +++
ipkBoe Na 0.6960.01 10.0360.22
Li 0.7160.03*** 9.0860.95*** +++ ++
mipp1:ipkA1oe
Na 0.6560.02 8.0960.59
Li 0.3660.04 4.6460.60 - - - -
-mipp1:ipkBoe
Na 0.6260.11 8.7461.79
Li 0.4060.01 5.4360.54 - - - -
-Cells were treated with 7mM LiCl or NaCl (control treatment) for one hour prior to analysis. Values shown are the mean6standard error of data from at least three independent experiments. Directionality is defined as the total distance moved divided by the net distance moved. Statistical analysis: two-tailed t-test.
{{{p,0.001,
{{p,0.02, compared to NaCl control treatment. ***p,0.005,
**p,0.05,
*p,0.1, compared to LiCl-treated wild-type cells.
1p,0.001, compared to NaCl treated wild type cells. $ p,0.05, compared to LiCl treateddpoAnull cells. Relative lithium sensitivity
Over-expression of Mipp1 causes Li+hypersensitivity A simple hypothesis is that decreased PO activity controls Li+ sensitivity through Mipp1 mediated changes in IP3 abundance,
but a number of observations show this is not the case. First, Mipp1 over-expression would be expected to increase the IP3
concentration and reduce Li+ sensitivity, however Mipp1 over-expressing cells are strongly Li+ hypersensitive (Figure 2C). Second, in the absence of PO inhibition, we found that neither loss nor over-expression of Mipp1 altered the cellular concentra-tion of IP3, despite both causing Li+ hypersensitivity (data not
shown). This lack of correlation argues against generation of IP3as
a direct mechanism for Li+resistance. The same lack of reciprocity also argues against a mechanism involving depletion of the Mipp1 substrate IP6 or its alternative substrate 2,3-bisphosphoglycerate
(2,3-BPG) [21]. I(1,3,4,5,6)P5 and I(1,4,5,6)P4/I(1,3,4,5)P4 are
intermediates in the dephosphorylation of IP6 to I(1,4,5)P3 by
Mipp1 and both have signalling properties within the cell. Mipp1 could therefore play a more complex role by regulating the abundance of these molecules through controlling the balance of their synthesis and degradation.
Over-expression of the IP3kinases IpkA1 and IpkB confers Li+resistance
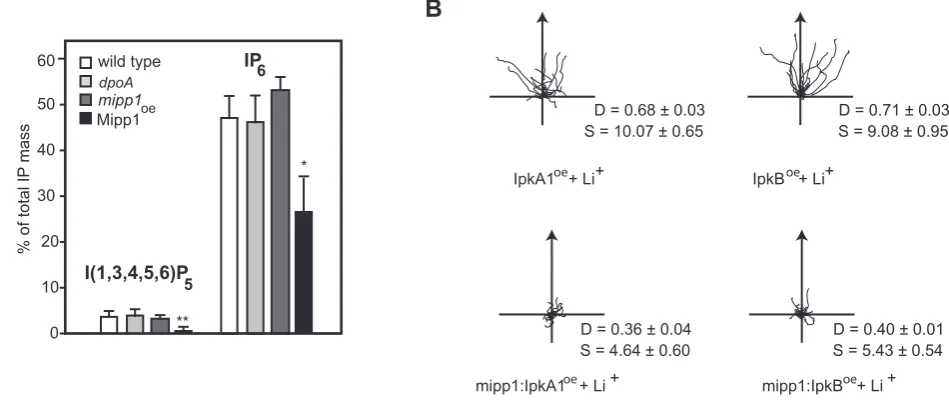
In all but one case, it was not possible to observe direct changes in the abundance of IPs in our mutants, however the exception was seen in Mipp1 over-expressing cells, which exhibited a large decrease in the cellular I(1,3,4,5,6)P5concentration, in addition to
decreased IP6 (Figure 3A). As this correlates with a strong Li+
hypersensitive phenotype, it suggested a positive role of I(1,3,4,5,6)P5 signalling in establishing Li+sensitivity. To pursue
this possibility, we over-expressed two structurally distinct IP3
[image:5.612.77.552.469.669.2]kinases (IpkA1 and IpkB) each capable of generating I(1,3,4,5,6)P5
[22,23,24]. In the reverse of that seen for Mipp1 over-expression, chemotaxis of cells over expressing either IpkA1 or IpkB was resistant to Li+(Figure 3B). Interestingly, we found that the Li+ resistant phenotype was lost when the IpkA1 or IpkB were over-expressed in amipp1null mutant background (Figure 3B), arguing that Mipp1 activity may be the key regulator of this signal pathway.
DpoA acts via Mipp1-mediated gene regulation
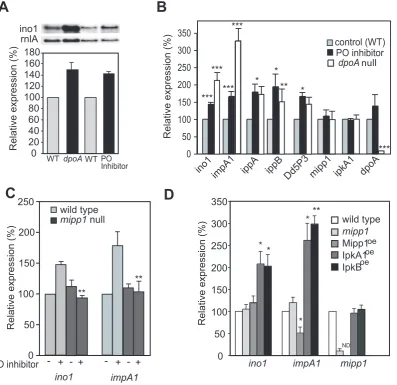
As the yeast homologue of ipkA1, Ipk2/Arg82, controls expression of the inositol synthase gene (ino1) [25], we investigated potential changes in gene expression mediated by PO and Mipp1. Expression of theDictyostelium ino1gene [9,26] was elevated both in dpoAnull cells and cells treated with PO inhibitor (Figure 4A,B). Furthermore both conditions gave a 60-100% increase in expression of the genes encoding IMPase (impA1), IPP (ippA and ippB) and Dd5P3, a phosphatase that converts I(1,4,5)P3to I(1,4)P2
(see Table S1). Dd5P3 is homologous to the synaptojanin-like IP3
5-phosphatase conserved from yeast to humans [27] and its elevated expression is consistent with the elevated IP3
5-phosphatase activity previously observed in dpoAnull cells [11]. No change was seen formipp1,dpoA oripkA1genes (Figure 4B). demonstrates that the product of Mipp1 is I(1,4,5)P3.B, Mipp1 activity measured as the rate of IP3formation in extracts from wild type,mipp1null mutant and Mipp1overexpressingcells.C, Cell tracks of wild type andmipp1mutant cells in 7 mM LiCl (or control of 7 mM NaCl) during chemotaxis.
mipp,mipp:dpoAand Mipp1 over-expressing mutants (Mipp1oe) are Li+hypersensitive compared to wild type. D = Directionality, S = cell speed (mm/ min).D, Vegetative wild type andmipp1null cells were treated with either 1.2 mM Z-pro-L-prolinal or an equal volume of DMSO carrier as a control. Samples were then removed at the times indicated and IP3concentration measured. Values plotted as mean6standard error of 4 independent experiments. * P,0.05, paired T-test.E, Mipp1 protein extracts were incubated with recombinant DpoA with or without the PO inhibitor Z-pro-L-prolinal. Mipp1 activity is measured by the production of IP3from IP6. Values plotted as mean6standard error of 3 independent experiments. ** P,0.01, paired T-test. Samples of Mipp1 protein are shown on Western (underneath).
doi:10.1371/journal.pone.0011151.g002
Figure 3. Elevated expression of Mipp1 and IP3kinases alter lithium sensitivity. A, Comparison of the I(1,3,4,5,6)P5and IP6concentration of wild type,dpoAnull;mipp1null and Mipp1 over-expressing cells. Values plotted (means6standard error of 3 independent experiments) as percentage of the total IP content relative to wild type (*P,0.05, ** P,0.01 T-test).B, Cell tracks of wild type andmipp1null mutant cells over-expressing IpkA1 and IpkB during chemotaxis in 7 mM LiCl. D = Directionality, S = cell speed (mm/min). Over-expression of IpkA1 and IpkB in wild type cells confers Li+resistance, whereas Li+hypersensitivity is maintained after over-expression in amipp1null mutant.
Changes in gene expression were dependent on Mipp1, asmipp1 null mutant cells treated with the PO inhibitor exhibited no change in the expression of ino1orimpA1(Figure 4C). Further-more, in the absence of PO inhibitor, Mipp1 over-expression caused a 50% decrease in expression ofimpA1, althoughino1was unaffected (Figure 4C). Finally, IpkA1 and IpkB over-expression elevated ino1and impA1 gene expression in the absence of PO inhibition (Figure 4D), again supporting a signalling role of the higher order IPs.
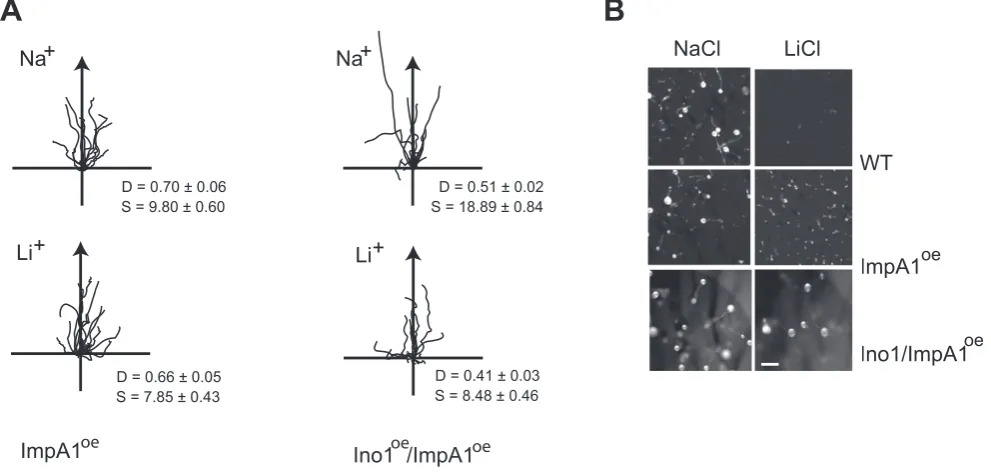
Previously, we demonstrated that elevated expression ofimpA1 inDictyosteliumcells reverses Li+inhibition of chemotaxis [19]. This is consistent with the uncompetitive inhibition mechanism of Li+
[image:6.612.69.467.62.447.2]on IMPase, which unlike other modes of inhibition is only reversed by increased enzyme concentration. This mechanism alone offers an explanation for how PO inhibition could confer Li+resistance, however our observations on gene expression suggest a more extensive effect of PO on expression of multiple inositol synthetic genes. This could combine to enhance Li+ resistance. We investigated cells with elevated expression of both impA1 and ino1 and found that they appeared to be Li+ resistant. Quantification showed that in terms of cell speed, impA1:ino1 over-expressing cells were Li+resistant in comparison to wild type cells. However, we also observed that these cells exhibited higher cell speed compared to wild type cells in the Na+control treatment Figure 4. PO regulates gene expression. A, Expression ofino1in wild type,dpoAnull cells and wild type cells following overnight treatment with 1.2 mM Z-pro-L-prolinal (PO inhibitor), measured by Northern analysis.rnlAexpression was used as a loading control. The graph shows the expression ofino1quantified on a phosphoimager (Biorad) and normalised tornlArelative to wild type or DMSO carrier treated controls (mean6standard error of 3 independent experiments).B, The expression of genes involved in inositol metabolism (Table S1). Gene expression in wild type cells following overnight treatment with Z-pro-L-prolinal or the equivalent amount of DMSO carrier, anddpoAnull mutant cells was measured by qRT-PCR, and normalised tornlAexpression levels. Values plotted are relative to the carrier control cells (mean6standard error of 3 independent experiments). * P,0.05, ** P,0.01, *** P,0.005, T-Test.C,mipp1is required for the regulation of gene expression by PO. Expression ofino1andimpA1in wild type andmipp1null cells following overnight treatment with Z-pro-L-prolinal or the equivalent amount of DMSO carrier, was measured by qRT-PCR, and normalised tornlAexpression levels. Values plotted are relative to the carrier control wild type cells (mean6standard error of at least 3 independent experiments). There is a significant difference in gene expression between wild type andmipp1null mutant following PO inhibition (** P,0.01, T-Test).D, Expression levels ofino1,impA1andmipp1in wild type,mipp1null mutant and cells over-expressing Mipp1, IpkA1 or IpkB. Expression was calculated relative to either wild type, or wild type cells transformed with the empty expression vector as appropriate. All samples were normalised to
rnlAas a loading control and the values plotted are the mean6standard error of 3 independent experiments (*P,0.05, ** P,0.01 T-test). ND = not determined.
(Figure 5 A,B). In contrast, Directionality was reduced in both Na+ control and Li+ treated cells, effectively making the cells more sensitive than wild type with regard to this parameter. These observations demonstrate that whilst mis-regulation of multiple genes may enhance overall Li+resistance, there is likely to be more complexity to the regulation, either involving more genes thanino1 andimpA1or perhaps a finer balance in levels of expression.
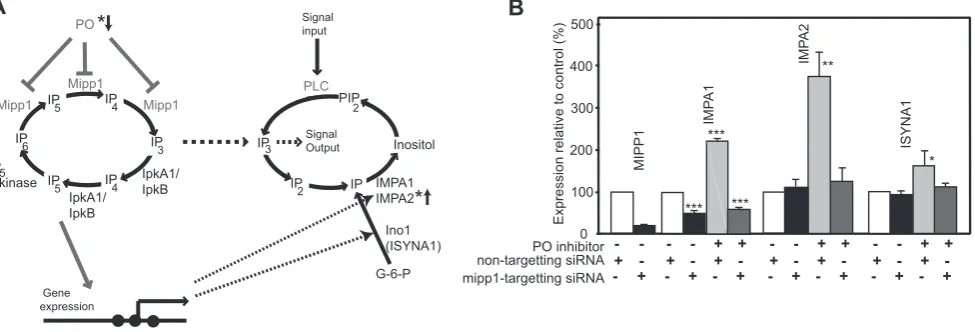
PO and Mipp1 modulate gene expression in HEK293 cells These results show that PO and Mipp1 control expression of the Dictyosteliuminositol synthetic genes (Figure 6A). A key question is whether a similar modulatory pathway exists in human cells. We therefore examined the effects of PO inhibition on HEK293 cells. PO inhibition caused a strong elevation of expression of the human IMPase genes, IMPA1 and IMPA2 (Figure 6B). siRNA to knockdown human Mipp1 expression again demonstrated that this increase was dependent on Mipp1. Interestingly, basal IMPA1 expression was reduced by mipp1siRNA (Figure 6B), suggesting that in these human cells, IMPA1 expression may be more dependent on Mipp1 function than other co-regulated genes. PO inhibitors also lead to a smaller Mipp1-dependent elevation in expression of the human inositol synthase gene ISYNA1.
Discussion
These results indicate that PO and Mipp1 are key components of a gene regulatory network that controls expression of the Dictyosteliuminositol synthetic genes (Figure 6A). We suggest that this may act in Dictyostelium during aggregation stage of development to modulate chemotaxis. It has previously been observed that Dictyostelium change their chemotactic response during aggregation in order to accommodate changes in cAMP signalling as cells approach multicellularity [28]. Little is known about the mechanisms that mediate these changes, however we observed elevated PO activity during these later stage of
aggregation, and note that DpoA appears to act as a suppressor of cell speed during chemotaxis, suggesting that the PO/Mipp1 signal pathway could be involved with these developmental changes.
The rapid elevation of IP3in response to PO inhibition, suggests
a series of direct interactions within this signalling pathway, and consistent with this we see no change inmipp1mRNA following PO inhibition. Furthermore, we show that incubation with recombinant PO decreases Mipp1 activity in cell extracts. This in vitro effect does not proceed via proteolysis of Mipp1, and therefore is likely to involve an unidentified intermediate peptide or protein.
In addition, we show that although I(1,4,5)P3 is the Mipp1
product, it is not the modulator of Li+sensitivity. Instead, we show that this occurs via altered expression of the genes that encode the myo-inositol synthetic and metabolic genes. This fits biochemical observations as Li+is an uncompetitive inhibitor of the IMPase and IPP [6,29] and hence targets the enzyme-substrate complex. Uncompetitive inhibitors can only be overcome by increasing the amount of enzyme, and we have previously shown that increased expression of ImpA1 reduces Li+ sensitivity of Dictyostelium cells undergoing chemotaxis [19]. We also previously found that in the absence of Li+, elevated ImpA1 enhances signalling via PIP3, an
important mediator of the chemotaxis in Dictyostelium and signalling in other cells. We now show that a combined increase in expression ofimpA1and ino1genes, as occurs in the dpoAnull mutant, enhances the degree of Li+resistance with regard to cell speed and also alters the chemotactic response in the absence of Li+. A combined up-regulation of gene expression would be expected to have significant effects on PIP3signalling.
The exact nature of the link between Mipp1 and gene expression requires further study, however genetic evidence implicates signalling via changes in the metabolism of the higher order inositol phosphates, I(1,3,4,5,6)P5 and I(1,4,5,6,)P4 [30].
[image:7.612.60.556.451.688.2]I(1,3,4,5,6)P5 is a good candidate for a signalling and has
previously been observed in the control of ino1 and pho gene expression in yeast [25]. In mammals, recent results indicate the I(1,3,4,5,6)P5 rapidly accumulates following Wnt3A stimulation
[31].
To investigate the effects of PO inhibition in animal cells, we examined PO inhibition and siRNA knock down of Mipp1in HEK293 cells. As found in Dictyostelium, expression of ino1 (ISYNA1), IMPA1 and the IMPase paralogue IMPA2 are increased in a Mipp1 dependent manner following treatment with PO inhibitors. Interestingly, basal IMPA1 expression was reduced by Mipp1 siRNA and no subsequent elevation of expression was seen with PO inhibition. This suggests that in human cells, expression of IMPA1 may have a greater requirement for Mipp1 activity than other genes. We note that although the same dependency is not seen inDictyostelium, we did observe a differential inhibitory effect onimpA1andino1following Mipp1 over-expression (Figure 4D). It is currently unclear how these differences in expression arise between genes, however we suggest that they reside in subtle differences in their promoter structure.
How might PO mediated signalling be relevant to bipolar mood disorder? First, altered PO activity has been observed in bipolar disorder patients. In manic phase patients prior to treatment, plasma PO activity is elevated, but then reduced to below that of control patients following mood stabilizer treatment [13]. In a follow up study, PO activity was shown to be below that of control groups in euthymic patients [14]. Both sets of measurements were made using plasma, however PO is a cytosolic enzyme and plasma levels of activity are 1,000-fold less than intracellular activity [14]. The relationship between intracellular activity and patients has not yet been explored.
The potential causes of altered PO activity are unknown, but as single nucleotide polymorphism (SNP) analysis has failed to find a genetically significant association of PO with risk of bipolar disorder [32], it may arise from environmental or physiological effects. High doses of the cytokine IFN-ain patients undergoing immunotherapy are reported to decrease serum PO activity and be associated with some symptoms of depression [33], and mood disorders in general have previously been associated with an
activation of the inflammatory response. A recent report found bipolar disorder patients have altered expression of a subset of genes that are associated with the pro-inflammatory response, including those involved in cytokine signalling and chemotaxis [34]. Furthermore twin studies showed that these changes arise through a common environmental factor, not a shared genetic component [34]. Altered PO activity may therefore reflect an environmental or physiological component for risk of bipolar disorder.
Second, genetic studies suggest that the presence of a specific set of SNPs within the IMPA2 gene promoter associates with elevated risk for bipolar disorder in some family studies [35,36,37]. Some of these SNPs have been shown to elevate promoter activity when coupled to marker genes and may also associate with elevated expression in post-mortem brain samples, although these studies may be confounded by differences in brain pH [37]. Global differences in brain IMPase activity have not been substantiated [38,39], although differences could be missed by sampling different populations, or if changes only occur in a small subset of cells or brain regions.
[image:8.612.66.554.64.230.2]Third, we have identified a novel signal pathway, where PO acts to suppress gene expression of the inositol synthetic and metabolic genes. It seems significant that PO suppresses IMPase gene expression, which is a Li+target. InDictyostelium, loss of PO leads to reduced Li+sensitivity. This would seem the opposite case to that seen in patients, where Li+treatment suppresses a clinical state. However, the difference may be that Li+treatment ofDictyostelium cells leads to a quantifiable difference in cell behaviour, whereas no behavioural difference has been observed in human non-patient controls. OurDictyosteliumexperiments can be viewed from an alternative perspective, where our mutant Dictyostelium cells possess aberrant signalling and in some cases exhibit altered chemotaxis behaviour. Li+ treatment suppresses this aberrant signalling behaviour so that it now falls into the behavioural parameters measured in wild type cells prior to Li+treatment. For example in the case of both thedpoAnull mutant andino1:impa1 over-expressors we observed differences in chemotactic behaviour that were reversed by Li+treatment. Similarly we have previously observed elevated PIP3signalling in wild type cells over-expressing
Figure 6. PO regulates expression of human IMPA1, IMPA2 and ISYNA1 genes. A, A diagram to illustrate the gene regulatory network through which PO activity regulates expression of the IMPA1, IMPA2 and ISYNA1 genes. The gene regulatory network is separate from ligand-stimulated regulation of IP3signalling via phospholipase C (PLC), but interacts via changes in gene expression or interchange of soluble IP3. * marks genes and enzyme activities associated with bipolar mood disorder.B, HEK293 cells were treated with either mipp1 specific or non-targetting siRNA for 24 hours with or without 130mM Z-pro-L-prolinal (PO inhibitor). Gene expression was quantified by qRT-PCR using expression of B2M as a reference. Expression of IMPA1, IMPA2 and ISYNA1 genes was quantified as percentage relative change compared to control (DMSO carrier treated, non-targeted siRNA samples). * p,0.05, ** p,0.02, *** p,0.001.
impa1in the absence of Li+, which is suppressed by Li+treatment [19].
We therefore envisage that treatment of patients may fit a general model, where elevated signalling activity is suppressed by mood stabilizer treatment. We propose that altered transcriptional control of inositol synthetic and metabolic genes, particularly IMPA2, could contribute to elevated risk of bipolar disorder. This risk could be heightened through changes in PO activity. In the simplest scenario, a genetic predisposition for elevated IMPA2 expression could be enhanced though an environmentally mediated decrease in PO activity leading to overactive cell signalling. Long-term Li+ treatment would in turn suppress elevated cell signalling to compensate for elevated gene expression. Although this will be difficult to directly demonstrate in patient studies, further genetic analysis and development of model systems will be useful to probe the clinical relevance of PO-mediated signalling.
Materials and Methods
Analysis of Cell movement
All Dictyostelium mutants and over-expressing strains were
generated in the AX2 parental background (Materials and Methods S1) and grown using standard methods [40]. Cells were shaken at 106cells/ml for 5 hours in KK2 with 6-minute pulses of 100 nM cAMP every 6 minutes. Lithium was added for the final hour of pulsing. Cells were placed in 1mM gradient of cAMP[41] and images collected every 10 seconds on a DIC inverted microscope. Data was analysed using DIAS 3.4.1 analytical software (Soll Technologies Inc; [42]). Data sets were analysed for statistical significance using a Mann-Whitney U-test, and based on 200–300 cells per experiment.
Biochemical analysis. PO activity was measured as
described by Williams et al (1999) [11]. For MIPP activity, cell extracts were prepared as described by Van Dijken et al (1995) [43] and incubated with an equal volume of TEE [20 mM triethanolamine pH 6.5, 5.9 mM EGTA, 0.5 mM EDTA] supplemented with 20 mM CaCl2, 50 mM LiCl and 200mM
IP6. Production of IP3was measured by an isotope dilution assay
(Perkin Elmer). For HPLC-MDD analysis, IP were prepared from 109cells and resuspended in 400ml 0.1 M NaCl, 15 mM NaF, 0.5 mM EDTA pH 6.0, and quantified by hplc analysis using Tricorn Mini Q 4.6/50 PE columns (GE healthcare) with solutions A: (21mM YCl3) and B (0.8 M HCl, 25mM YCl3(Merck).
Post-column detection used (2.13 M triethanolamine, 500mM 4-(29
-Pyridylazo)-Resorcinol (PAR) (Merck), pH 9.75) and absorbance [44] at 520 nm [45,46].
Analysis of gene expression
Northern blotting was done using standard techniques. For qRT-PCR analysis of Dictyostelium samples, total RNA was extracted from growing cells and used as template to generate cDNA using random primers (Roche 1st Strand synthesis kit). qRT-PCR was then performed using a SYBR green mastermix kit (Abgene), with 10 ng cDNA template and PCR primers described in Materials and Methods S1. All samples were run in triplicate, with at least three biological replicates. Expression differences were calculated using the 22DDcT method [47] normalised to rnlA in Dictyosteliumand B2M in HEK 293 cells.
Supporting Information
Materials and Methods S1 Construction of mutant strains and plasmids; qRT-PCR primers.
Found at: doi:10.1371/journal.pone.0011151.s001 (0.05 MB DOC)
Table S1 Summary of the genes identified and manipulated in this study. mRNA copy number was determined by quantitative RT-PCR, by using a calibration curve generated from plasmid clones of each gene, assuming that 1% of total RNA is mRNA. The activity of genes marked * is predicted by homology with characterised enzymes from other species. [Williams RS, Eames M, Ryves WJ, Viggars J, Harwood AJ (1999) EMBO J 18: 2734– 2745; Fischbach A, Adelt S, Muller A, Vogel G (2006) Biochem J. 397:509–518.; King JS, Teo R, Ryves J, Reddy JV, Peters O, Harwood, AJ. (2009) Dis Model Mech 2: 306–312.; Loovers HM, Veenstra K, Snippe H, Pesesse X, Erneux C, et al. (2003) J Biol Chem 278: 5652–5658].
Found at: doi:10.1371/journal.pone.0011151.s002 (0.08 MB DOC)
Acknowledgments
We thank Trevor Dale and Stephen Shears for their invaluable critique.
Author Contributions
Conceived and designed the experiments: JK MK AH. Performed the experiments: JK MK RT KW KM BR ED RW. Analyzed the data: JK MK RT KW KM JR BR ED. Contributed reagents/materials/analysis tools: MK JR. Wrote the paper: AH.
References
1. Craddock N, Sklar P (2009) Genetics of bipolar disorder: successful start to a long journey. Trends Genet 25: 99–105.
2. Taylor L, Faraone SV, Tsuang MT (2002) Family, twin, and adoption studies of bipolar disease. Curr Psychiatry Rep 4: 130–133.
3. Padmos RC, Van Baal GC, Vonk R, Wijkhuijs AJ, Kahn RS, et al. (2009) Genetic and environmental influences on pro-inflammatory monocytes in bipolar disorder: a twin study. Arch Gen Psychiatry 66: 957–965.
4. Alloy LB, Abramson LY, Urosevic S, Walshaw PD, Nusslock R, et al. (2005) The psychosocial context of bipolar disorder: environmental, cognitive, and developmental risk factors. Clin Psychol Rev 25: 1043–1075.
5. Burgess S, Geddes J, Hawton K, Townsend E, Jamison K, et al. (2001) Lithium for maintenance treatment of mood disorders. Cochrane Database Syst Rev CD003013.
6. Atack JR, Broughton HB, Pollack SJ (1995) Structure and mechanism of inositol monophosphatase. FEBS Lett 361: 1–7.
7. Inhorn RC, Majerus PW (1988) Properties of inositol polyphosphate 1-phosphatase. J Biol Chem 263: 14559–14565.
8. Berridge MJ, Downes CP, Hanley MR (1989) Neural and developmental actions of lithium: a unifying hypothesis. Cell 59: 411–419.
9. Williams RS, Cheng L, Mudge AW, Harwood AJ (2002) A common mechanism of action for three mood-stabilizing drugs. Nature 417: 292– 295.
10. Sarkar S, Floto RA, Berger Z, Imarisio S, Cordenier A, et al. (2005) Lithium induces autophagy by inhibiting inositol monophosphatase. J Cell Biol 170: 1101–1111.
11. Williams RS, Eames M, Ryves WJ, Viggars J, Harwood AJ (1999) Loss of a prolyl oligopeptidase confers resistance to lithium by elevation of inositol (1,4,5) trisphosphate. EMBO J 18: 2734–2745.
12. Maes M, De Meester I, Scharpe S, Desnyder R, Ranjan R, et al. (1996) Alterations in plasma dipeptidyl peptidase IV enzyme activity in depression and schizophrenia: effects of antidepressants and antipsychotic drugs. Acta Psychiatr Scand 93: 1–8.
13. Maes M, Goossens F, Scharpe S, Calabrese J, Desnyder R, et al. (1995) Alterations in plasma prolyl endopeptidase activity in depression, mania, and schizophrenia: effects of antidepressants, mood stabilizers, and antipsychotic drugs. Psychiatry Res 58: 217–225.
14. Breen G, Harwood AJ, Gregory K, Sinclair M, Collier D, et al. (2004) Two peptidase activities decrease in treated bipolar disorder not schizophrenic patients. Bipolar Disord 6: 156–161.
15. Schulz I, Gerhartz B, Neubauer A, Holloschi A, Heiser U, et al. (2002) Modulation of inositol 1,4,5-triphosphate concentration by prolyl endopeptidase inhibition. Eur J Biochem 269: 5813–5820.
glycogen synthase kinase-3beta inhibition, and viral replication: a screening approach for new bipolar disorder drugs derived from the valproic acid core structure. Mol Pharmacol 67: 1426–1433.
17. Fornai F, Longone P, Cafaro L, Kastsiuchenka O, Ferrucci M, et al. (2008) Lithium delays progression of amyotrophic lateral sclerosis. Proc Natl Acad Sci U S A 105: 2052–2057.
18. Kessin RH (2001)Dictyostelium- Evolution, cell biology, and the development of multicellularity. Cambridge, UK: Cambridge Univ. Press xiv+294. 19. King JS, Teo R, Ryves J, Reddy JV, Peters O, et al. (2009) The mood stabiliser
lithium suppresses PIP3 signalling inDictyosteliumand human cells. Dis Model Mech 2: 306–312.
20. Otto JC, Kelly P, Chiou ST, York JD (2007) Alterations in an inositol phosphate code through synergistic activation of a G protein and inositol phosphate kinases. Proc Natl Acad Sci U S A 104: 15653–15658.
21. Cho J, King JS, Qian X, Harwood AJ, Shears SB (2008) Dephosphorylation of 2,3-bisphosphoglycerate by MIPP expands the regulatory capacity of the Rapoport-Luebering glycolytic shunt. Proc Natl Acad Sci U S A 105: 5998–6003.
22. Nalaskowski MM, Deschermeier C, Fanick W, Mayr GW (2002) The human homologue of yeast ArgRIII protein is an inositol phosphate multikinase with predominantly nuclear localization. Biochem J 366: 549–556.
23. Wilson MP, Majerus PW (1996) Isolation of inositol 1,3,4-trisphosphate 5/6-kinase, cDNA cloning and expression of the recombinant enzyme. J Biol Chem 271: 11904–11910.
24. Yang X, Shears SB (2000) Multitasking in signal transduction by a promiscuous human Ins(3,4,5,6)P(4) 1-kinase/Ins(1,3,4)P(3) 5/6-kinase. Biochem J 351 Pt 3: 551–555.
25. Steger DJ, Haswell ES, Miller AL, Wente SR, O’Shea EK (2003) Regulation of chromatin remodeling by inositol polyphosphates. Science 299: 114–116. 26. Fischbach A, Adelt S, Muller A, Vogel G (2006) Disruption of inositol
biosynthesis through targeted mutagenesis inDictyostelium discoideum- generation and characterisation of inositol-auxotrophic mutants. Biochem J 397: 509–518. 27. Loovers HM, Veenstra K, Snippe H, Pesesse X, Erneux C, et al. (2003) A diverse family of inositol 5-phosphatases playing a role in growth and development inDictyostelium discoideum. J Biol Chem 278: 5652–5658. 28. Lax AJ (1979) The evolution of excitable behaviour inDictyostelium. J Cell Sci 36:
311–321.
29. Gee NS, Reid GG, Jackson RG, Barnaby RJ, Ragan CI (1988) Purification and properties of inositol-1,4-bisphosphatase from bovine brain. Biochem J 253: 777–782.
30. Shen X, Xiao H, Ranallo R, Wu WH, Wu C (2003) Modulation of ATP-dependent chromatin-remodeling complexes by inositol polyphosphates. Science 299: 112–114.
31. Gao Y, Wang HY (2007) Inositol pentakisphosphate mediates Wnt/beta-catenin signaling. J Biol Chem 282: 26490–26502.
32. Mamdani F, Sequeira A, Alda M, Grof P, Rouleau G, et al. (2007) No association between the PREP gene and lithium responsive bipolar disorder. BMC Psychiatry 7: 9.
33. Van Gool AR, Van Ojik HH, Kruit WH, Mulder PG, Fekkes D, et al. (2004) Serum activity of prolyl endopeptidase, but not of dipeptidyl peptidase IV, is
decreased by immunotherapy with IFN-alpha in high-risk melanoma patients. J Interferon Cytokine Res 24: 411–415.
34. Padmos RC, Hillegers MH, Knijff EM, Vonk R, Bouvy A, et al. (2008) A discriminating messenger RNA signature for bipolar disorder formed by an aberrant expression of inflammatory genes in monocytes. Arch Gen Psychiatry 65: 395–407.
35. Sjoholt G, Gulbrandsen AK, Lovlie R, Berle JO, Molven A, et al. (2000) A human myo-inositol monophosphatase gene (IMPA2) localized in a putative susceptibility region for bipolar disorder on chromosome 18p11.2: genomic structure and polymorphism screening in manic-depressive patients. Mol Psychiatry 5: 172–180.
36. Sjoholt G, Ebstein RP, Lie RT, Berle JO, Mallet J, et al. (2004) Examination of IMPA1 and IMPA2 genes in manic-depressive patients: association between IMPA2 promoter polymorphisms and bipolar disorder. Mol Psychiatry 9: 621–629.
37. Ohnishi T, Yamada K, Ohba H, Iwayama Y, Toyota T, et al. (2007) A promoter haplotype of the inositol monophosphatase 2 gene (IMPA2) at 18p11.2 confers a possible risk for bipolar disorder by enhancing transcription. Neuropsychopharmacology 32: 1727–1737.
38. Shaltiel G, Shamir A, Nemanov L, Yaroslavsky Y, Nemets B, et al. (2001) Inositol monophosphatase activity in brain and lymphocyte-derived cell lines of bipolar patients. World J Biol Psychiatry 2: 95–98.
39. Agam G, Shaltiel G, Kozlovsky N, Shimon H, Belmaker RH (2003) Lithium inhibitable enzymes in postmortem brain of bipolar patients. J Psychiatr Res 37: 433–442.
40. Watts DJ, Ashworth JM (1970) Growth of myxameobae of the cellular slime mouldDictyostelium discoideumin axenic culture. Biochem J 119: 171–174. 41. Zigmond SH (1988) Orientation chamber in chemotaxis. Methods Enzymol
162: 65–72.
42. Soll DR, Wessels D, Voss E, Johnson O (2001) Computer-assisted systems for the analysis of amoeboid cell motility. Methods Mol Biol 161: 45–58. 43. Van Dijken P, De Haas JR, Craxton A, Erneux C, Shears SB, et al. (1995) A
novel, phospholipase C-independent pathway of inositol 1, 4,5-trisphosphate formation inDictyosteliumand rat liver. J Biol Chem 270: 29724–29731. 44. Guse AH, Goldwich A, Weber K, Mayr GW (1995) Non-radioactive,
isomer-specific inositol phosphate mass determinations: high-performance liquid chromatography-micro-metal-dye detection strongly improves speed and sensitivity of analyses from cells and micro-enzyme assays. J Chromatogr B Biomed Appl 672: 189–198.
45. Casals I, Villar JL, Riera-Codina M (2002) A straightforward method for analysis of highly phosphorylated inositols in blood cells by high-performance liquid chromatography. Anal Biochem 300: 69–76.
46. Mayr GW (1988) A novel metal-dye detection system permits picomolar-range h.p.l.c. analysis of inositol polyphosphates from non-radioactively labelled cell or tissue specimens. Biochem J 254: 585–591.