promoting access to White Rose research papers
Universities of Leeds, Sheffield and York
http://eprints.whiterose.ac.uk/
This is an author produced version of a paper published in Measurement Science and Technology.
White Rose Research Online URL for this paper:
Published paper
Krstajic, N., Matcher, S.J., Childs, D., Steenbergen, W., Hogg, R., Smallwood, R. (2009) Evaluation of a cheap ultrasonic stage for light source coherence function measurement, optical coherence tomography and dynamic focusing,
Evaluation of a cheap ultrasonic stage for light source coherence function measurement, optical coherence tomography and dynamic focusing
Nikola Krstajić1
, Stephen J Matcher2, David Childs3, Wiendelt Steenbergen2,4, Richard Hogg3, Rod Smallwood1
1
Department of Computer Science, University of Sheffield, Regent Court, 211 Portobello, Sheffield, S1 4DP, UK
2
Department of Engineering Materials, University of Sheffield, Sir Robert Hadfield Building, Mappin Street, Sheffield, S1 3JD, UK
3
Department of Electronic Engineering, University of Sheffield, Mappin Street, Sheffield, S1 3JD, UK
4
Institute for Biomedical Technology, University of Twente, Enschede, The Netherlands
Email: [email protected]
ABSTRACT
We evaluate the performance of a cheap ultrasonic stage in setups related to
optical coherence tomography. The stage was used in several configurations: 1)
optical delay line in optical coherence tomography (OCT) setup; 2) as a delay line
measuring coherence function of a low coherence source (e.g. superluminescent
diode); 3) in a dynamic focusing arrangement. The results are as follows: the stage is
suitable for coherence function measurement (coherence length up to 70 μm) of the
light source and dynamic focusing. We found it unsuitable for OCT due to unstable
velocity profile. Despite this, the velocity profile has a repeatable shape (4% over
1000 A-scans) and slight modifications to the stage promise wider applications.
Keywords: optical coherence tomography, optical delay line, dynamic focusing,
1 INTRODUCTION
A stable and fast moving platform is essential in variety of fields in photonics.
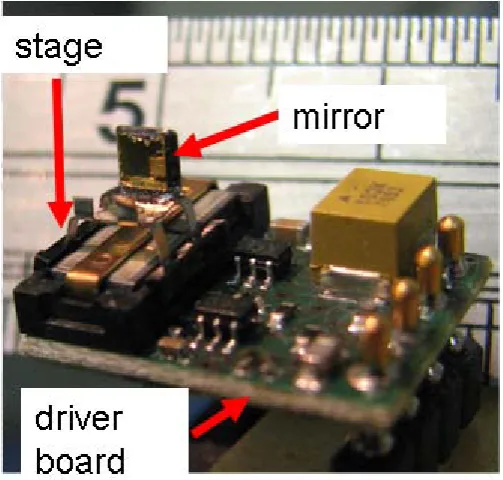
Here we evaluate a recently introduced ultrasonic (or piezo) stage PILine® P-653 from
Physik Instrumente, Karlsruhe, Germany (see figure 1). This stage is a linear motor
with travel range of 2 mm and velocity up to 200 mm/s [1]. The electronic driver is
integrated with the stage so only power and voltage waveforms need to be supplied.
The current cost for a single stage is 140$ which inspired us to evaluate its
performance in applications related to optical coherence tomography (OCT) [2].
Mounting a lightweight mirror onto the stage allowed us to evaluate the
performance of the stage as a delay line in a time-domain OCT (TD-OCT) system.
Stable velocity over 1mm or more is required for this. For stable velocity over smaller
movements of the mirror (~100 μm), a less ambitious goal may be to measure the
OCT point spread function (PSF) (or coherence function) [3] of the light source. This
is often needed in testing a variety of low coherence sources such as superluminescent
diodes (SLEDs). Mounting a small lens on the stage allows dynamic focusing
applications [4-7] and we show encouraging results in dynamic focusing applied to
OCT.
As mentioned beforehand, our aim is to explore low-cost solutions which have
potential to find their way into cheap products as well as provide a platform for
demonstration of low coherence systems in educational and research establishments.
Current solutions in TD-OCT are at least an order of magnitude more expensive. OCT
has a proven track record in image quality for a variety of applications, but its price
tag is still forbidding for many potential users [8].
2 MATERIALS AND METHODS
Details regarding OCT theory can be found in several review articles [9, 10] and
books [2, 11]. Below, we describe OCT and dynamic focusing setups as well details
regarding mirror and lens mounting on the ultrasonic stage.
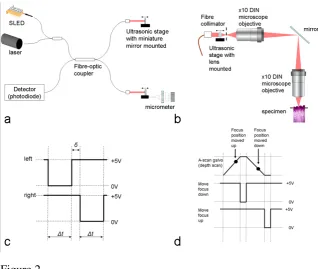
2.1 Setup for OCT and coherence function estimation and measurement
The OCT setup shown in figure 2(a) consists of two sources either SLED
(Superlum Diodes, Russia, part number SLD371) or laser diode (Edmund Optics,
Barrington, NJ, part number NT53-756). The laser diode illumination is used to verify
stage stability. As the coherence length of the laser is much more than 2mm covered
by the stage, the movement of an ideal stage would produce a fringe of the same
frequency. Any change in velocity will change the carrier frequency and this is easier
to observe with the laser. The velocity profile is calculated using the short-term
Fourier transform (STFT). Providing both paths of the interferometer have mirrors
and matching optical path lengths, the coherence function of the source is measured
by locating the fringes. Fringe width is calibrated using a micrometer actuator in the
sample arm (see figure 2(a)).
2.2 Dynamic focusing
Figure 2(b) shows a dynamic focusing arrangement whereby two microscope
objectives (x10 DIN) are used to image the moving focal plane onto the specimen.
The two objectives are needed to map the movement of the ultrasonic stage onto the
specimen with magnification 1:1. Axial magnification equals lateral magnification
squared, so if only one objective was to be used a movement of ~100mm would be
needed to translate the focal plane by 1mm. By using two objectives and ensuring that
their distance is about 320mm (twice the tube length of DIN objectives), 1mm move
of the ultrasonic stage maps to 1mm move of the focal plane inside the specimen.
Two specimens were used to verify this method. Firstly, 5 μm polystyrene
spheres (Sigma Aldrich, part number 79633) were mixed with water at mass fraction
of ~ 0.1%. The second specimen was onion skin. Note that the delay line in the
dynamic focus setup was the standard rapid scanning optical delay (RSOD) line [12].
The Superlum Ltd SLD371 was used for imaging.
2.3 Mirror and lens mounting on the ultrasonic stage
Figure 1 shows the device used. A simple circuit board was built to provide
move signal) and to provide a stable interface to kinetic mounts holding the board and
the stage. Note that the stage is miniature (5mm x 5mm x 15mm) and fragile.
Miniature lens and mirrors are readily available from several manufacturers. For
dynamic focusing we used an achromatic lens 6mm in diameter and mass 0.26g
(Edmund Optics, Barrington, NJ, part number 45-785). Micro-mirrors were
custom-made in the EPSRC National Centre for III-V technologies, Sheffield, UK. They were
fabricated by the thermal evaporation of 300nm thick gold layer onto an epitaxy ready
GaAs wafer to ensure almost perfect surface flatness. Due to the crystalline nature of
the substrate, the wafer was then simply cleaved into a mirror. The thickness of the
substrate was 325 μm, resulting in a total mass of 2 µg (density of the GaAs is
5.32g/cm3, the size is 1mm x 1mm x 325 μm), i.e. the gold is so thin it does not add
to the weight. The lens or mirror was fixed to the stage using superglue.
2.4 Drive waveforms and ultrasonic stage specifications
Figure 2(c) shows the drive waveforms for left move and right move signal
pins. Note that the signals are active low. The stage is driven in open loop mode.
Pulse durations can go from 0.25ms for ~5 μm move, while 1 ms pulse generates 20 μm to 120 μm move [1]. Driver electronics translates voltage pulses into resonant frequency of the motor ceramic (~500 kHz). This in turn moves the stage.
3 RESULTS
The ultrasonic stage specifications are as follows [1]: travel range 2mm,
operating voltage 5V, typical velocity 50 mm/s to 90 mm/s (maximum velocity
without load 140 mm/s to 200 mm/s), resonant frequency 515 kHz. The velocity
profile and the stability of velocity profile have not been published. The test results
given below outline the suitability of the stage in OCT related applications and
dynamic focusing.
3.1 Optical coherence tomography
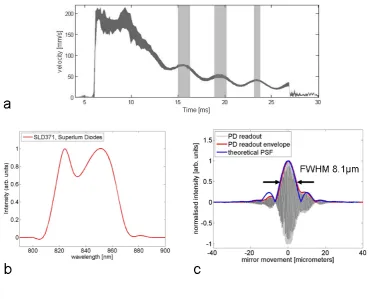
Figure 3(a) shows the range of stage velocities derived from 1000 A-scans. The
range is displayed as a thick curve representing mean stage velocity +/- one standard
deviation of velocities at the same point over 1000 A-scans Therefore, the thickness
of the curve shows the variability of velocity. A suitable stage would show a
trapezoidal velocity profile where the middle region should have essentially constant
velocity. This trapezoidal shape is not here. When the measurements need to be done
over 1 mm or more for OCT type applications, it was found that the stage does not
perform well due to unstable velocity profile.
Despite this, the “A-scans” show good repeatability, i.e. fringes (and their
mirror. This is verified by observing the vertical shaded regions in figure 3(a) where
the velocity change is less than 4% over 1000 A-scans measured. As there are
sections of relatively constant velocity (shown in figure 3(a) as shaded regions), the
stage can be used for measurements over this region (such as coherence function
measurement discussed below).
Unstable velocity profile may not reflect intrinsic stage performance for several
reasons. The beam wander is significant and this is detrimental to accurate detection
of reflected light. This effect can be reduced by mounting a miniature corner cube.
Furthermore, the slider attached to the ultrasonic stage must be detached to facilitate
mirror mounting for all stages we tested. This detachment and re-attachment might
conceivably have changed the overall properties of the stage. Lastly, the load applied
although minimal, changes the dynamic response.
3.2 Coherence function measurement
Figure 3(b) shows the spectra of Superlum SLED371 while figure 3(c) shows
the coherence function of the same SLED. Overlaid are the estimated PSFs from
spectra. The measured FWHM of the SLED corresponds to the specifications. The
non-gaussian envelope is due to the spectral shape of SLED output. However, the
sidelobes are higher in our measurement than in the estimates. This is probably due to
dispersion or polarization dependent loss in our setup. Note that we found the
coherence function measurement to be limited to coherence lengths ~ 70 μm. This
number was derived from figure 3(a) where the vertical shaded region shows stable
velocity of 70mm/s over 1 ms duration. Overall, the measurements match the
theoretically estimated PSFs to within 1%, so the stage can be used for very accurate
coherence function measurements of low coherent sources.
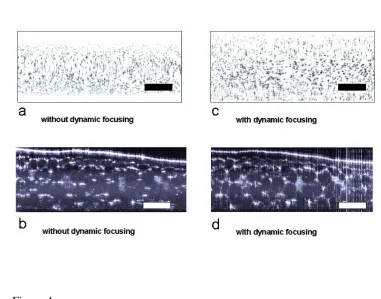
3.3 Dynamic focusing
Figure 4 shows the benefit of dynamic focusing. While figure 4(a) has the
objective focusing in the middle of the specimen (5 μm polystyrene spheres mixed
with water), figure 4(c) has the focus in the middle of the upper half and lower half of
the specimen. The length of the pulse was empirically determined to generate a focus
move by ~400 μm deeper into the specimen. Note that the drive waveforms and
velocity profile do not guarantee the matching of the coherence gate and the confocal
gate. Despite this, the DOF is better in figure 4(c). Vertical “streaks” represent high
reflections of single polystyrene sphere. These are present in the middle of figure 4(a).
In figure 4(c) these are present in the upper and lower regions while fairly absent from
the middle region. These observations correspond to DOF of the objective used and
Figure 4(b) shows an onion skin image without dynamic focusing while figure
4(d) shows the same image with dynamic focusing. More features are visible in figure
4(d), especially in the lower layers. Note that we tried this setup successfully on other
specimens including multi-layered sheet with embedded 1 μm hollow spheres at average mutual distances of about 50 μm [13, 14].
4 DISCUSSION
In total 5 PILine®
5 CONCLUSION
P-653 ultrasonic devices were used in this study. Three
ultrasonic stages had lightweight mirrors, while two had miniature achromatic lenses
for dynamic focusing. All stages with mirrors could measure coherence function of
SLEDs.
The images presented in this paper were acquired at 10 A-scans per second.
Improvements in software and detectors should enable acquisitions up to 50 A-scans
per second. Fourier domain OCT systems perform much better in this respect with
speeds up to 370000 A-scans per second [15]. Although slower, TD-OCT systems are
still much cheaper to build. Furthermore, TD-OCT systems are more appropriate for
dynamic focusing applications.
Furthermore, this study points that for stable velocity profiles we may not need
a closed loop stage as long as stable velocity can be achieved over a suitable depth
scan. For example, if the current stage can be improved to have stable velocity over 400 μm it may find its way into many OCT applications where deeper scanning is not so important.
Initial experiments show promise in applying the stage to optical coherence
microscopy (OCM). Although the specification indicates minimum movement of 5
um, the minimum step move is less on the edge of the range. Future study will
investigate OCM in more detail. There are several other applications of this stage.
Fast switching of the confocal plane could be a powerful addition to confocal
microscopy [16] and en-face swept-source OCM [17].
We have shown the benefits of using the stage in measuring the coherence
function of low coherence sources and in dynamic focusing. Our aim has been to
progress in evaluating cheaper devices on the market as these are the ones that are
6 ACKNOWLEDGEMENTS
This study was funded by a BBSRC grant BB/E002676/1. WS was supported
by the Technology Foundation of the Netherlands. We wish to thank Zenghai Lu and
James Jacobs for discussions and assistance with various components used in this
BIBLIOGRAPHY
[1] Physik Instrumente: P-653 PILine Datasheet. 2008,
[2] Drexler, W. and J.G. Fujimoto, Optical coherence tomography : technology and applications. 2008, Berlin; New York: Springer.
[3] Akcay, A.C., E. Clarkson, and J.P. Rolland, Effect of source spectral shape on task-based assessment of detection and resolution in optical coherence
tomography. Applied Optics, 2005. 44(35): p. 7573-7580.
[4] Cobb, M.J., X.M. Liu, and X.D. Li, Continuous focus tracking for real-time optical coherence tomography. Optics Letters, 2005. 30(13): p. 1680-1682. [5] Lexer, F., C.K. Hitzenberger, W. Drexler, S. Molebny, H. Sattmann, M.
Sticker, and A.F. Fercher, Dynamic coherent focus OCT with
depth-independent transversal resolution. Journal of Modern Optics, 1999. 46(3): p. 541-553.
[6] Pircher, M., E. Gotzinger, and C.K. Hitzenberger, Dynamic focus in optical coherence tomography for retinal imaging. Journal of Biomedical Optics, 2006. 11(5): p. 054013.
[7] Qi, B., A.P. Himmer, L.M. Gordon, X.D.V. Yang, L.D. Dickensheets, and I.A. Vitkin, Dynamic focus control in high-speed optical coherence tomography based on a microelectromechanical mirror. Optics Communications, 2004. 232(1-6): p. 123-128.
[8] Jernigan, R.C., Is OCT worth it? BioPhotonics, 2009. 15(1): p. 24-25. [9] Podoleanu, A.G., Optical coherence tomography. British Journal of
Radiology, 2005. 78(935): p. 976-988.
[10] Schmitt, J.M., Optical coherence tomography (OCT): A review. IEEE Journal of Selected Topics in Quantum Electronics, 1999. 5(4): p. 1205-1215.
[11] Bouma, B.E. and G.J. Tearney, Handbook of optical coherence tomography. 2002, New York: Marcel Dekker.
[12] Rollins, A.M., M.D. Kulkarni, S. Yazdanfar, R. Ung-arunyawee, and J.A. Izatt, In vivo video rate optical coherence tomography. Optics Express, 1998. 3(6): p. 219-229.
[13] Larsson, M., W. Steenbergen, and T. Stromberg, Influence of optical properties and fiber separation on laser Doppler flowmetry. Journal of Biomedical Optics, 2002. 7(2): p. 236-243.
[14] Steenbergen, W. and F. de Mul, New optical tissue phantom, and its use for studying laser Doppler blood flowmetry. Proceedings of SPIE, 1998. 3196: p. 12-23.
[15] Huber, R., D.C. Adler, and J.G. Fujimoto, Buffered Fourier domain mode locking: unidirectional swept laser sources for optical coherence tomography imaging at 370,000 lines/s. Optics Letters, 2006. 31(20): p. 2975-2977. [16] Botcherby, E.J., R. Juskaitis, M.J. Booth, and T. Wilson, Aberration-free
optical refocusing in high numerical aperture microscopy. Optics Letters, 2007. 32(14): p. 2007-2009.
FIGURES AND CAPTIONS
Figure 1
[image:13.595.118.437.166.435.2]
Figure 2
(a) the OCT setup, (b) the dynamic focusing arrangement, (c) shows the drive
waveforms employed for an OCT and coherence function measurement, (d) shows the
Figure 3
The curve in (a) is a plot of mean velocity +/- standard deviation of velocity
change over 1000 A-scans. The vertical shaded regions in (a) indicate the sections of
relatively constant velocity where coherence function of a light source can be
measured. The same regions are good for OCM as well. Spectra and coherence
function (or OCT point spread function) of SLED371, Superlum Diodes, Moscow,
Figure 4
Dynamic focusing increases the depth of field, in (a) only middle region is
visible while in (c) most of the phantom (5 μm polystyrene spheres suspended in
water) is visible. Similarly, the onion skin sample in (b) imaged without dynamic
focusing is worse than the one in (d). The bar in the lower right corner designates