White Rose Research Online
[email protected]
Universities of Leeds, Sheffield and York
http://eprints.whiterose.ac.uk/
White Rose Research Online URL for this paper:
http://eprints.whiterose.ac.uk/42892/
Conference item:
Whittaker, M, Dubina, E, Plank, J and Black, L
The Effects of Prehydration on
Cement Performance.
30th Cement and Concrete Science Conference, 13 -14
The Effects of Cement Prehydration of Engineering Properties
Mark Whittaker£, Elina Dubina€, Leslie Arkless£, Johann Plank€, Leon Black£* £University of Leeds, School of Civil Engineering, LS2 9JT, UK
€Technical University of Munich, Chair for Construction Chemicals,
Lichtenbergstr.-4, 85747 Garching, Germany
* corresponding author: [email protected]
Abstract:
This study investigated the effects of cement prehydration
on cement’s engineering properties. Anhydrous cement was exposed
over a saturated KCl solution to maintain 85% RH, for 7 and 28 days.
Mortar and cement pastes were tested for strength, workability and
setting time, with sample analysis by XRD and DTA. Results showed a
decreased reactivity of the prehydrated cements resulting in reduced
strength and increased setting times. We propose that this may be due
to an upset of the sulphate balance in the cement upon prehydration.
1.
Aims and Objectives
Cement prehydration, the reaction between cement clinker and water vapour, can occur during the manufacture of cement, its transportation or storage in either silos or bags. The factors affecting the degree of prehydration include the temperature, the relative humidity (RH), time of exposure and particle fineness. Previous research on prehydrated cement has shown adverse effects on the engineering properties and the different levels of reactivity of the different phases [1]. These include a reduction in strength, workability and setting time. The aim of this study was to further investigate these properties, attempting to understand why performance is affected in this way.
2.
Method
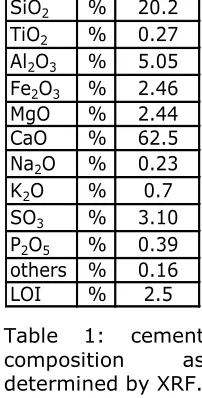
CEM I 42.5R was used for this project, with a composition as shown in Table 1. Anhydrous cement was taken from sealed plastic containers and spread thinly (2mm) over a flat surface, placed in a closed chamber and exposed to water vapour at 85% RH using a saturated KCl solution. The samples were exposed thus for 7 and 28 days, with temperature and RH monitored daily. After this time the cement was stored in bags closed as tightly as possible to limit air exposure and prevent further reaction. Thermal analysis of samples immediately after sealing and then one month later were identical indicating no signs of further reaction.
The anhydrous cement was characterised by thermal analysis and x-ray diffraction prior to any testing of its engineering properties. Mortars were prepared with an OPC:Sand:Water ratio of 1:3:0.5 for strength and workability testing according to [2] and [3] respectively. Strengths were determined after 1, 3, 7 and 28 days. Setting time was recorded on neat cement pastes according to [4]. Finally, hydrating pastes were characterised in-situ by XRD.
SiO2 % 20.2
TiO2 % 0.27
Al2O3 % 5.05
Fe2O3 % 2.46
MgO % 2.44 CaO % 62.5 Na2O % 0.23
K2O % 0.7
SO3 % 3.10
P2O5 % 0.39
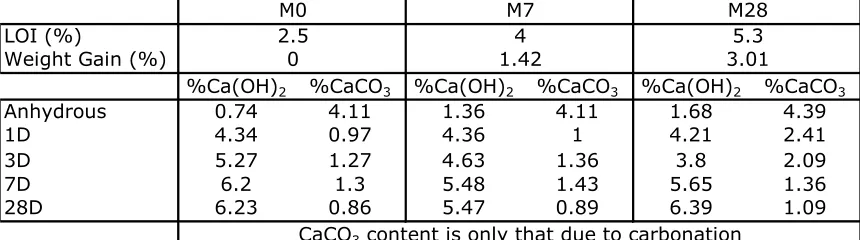
[image:2.612.422.523.499.698.2]LOI (%)
Weight Gain (%)
%Ca(OH)2 %CaCO3 %Ca(OH)2 %CaCO3 %Ca(OH)2 %CaCO3
Anhydrous 0.74 4.11 1.36 4.11 1.68 4.39
1D 4.34 0.97 4.36 1 4.21 2.41
3D 5.27 1.27 4.63 1.36 3.8 2.09
7D 6.2 1.3 5.48 1.43 5.65 1.36
28D 6.23 0.86 5.47 0.89 6.39 1.09
0 1.42 3.01
M0 M7 M28
CaCO3 content is only that due to carbonation
[image:3.612.91.521.73.193.2]2.5 4 5.3
Table 2 – LOI and weight gain data for the anhydrous materials, plus %CH and %CaCO3 from the anhydrous materials and pastes, calculated from TGA
3.
Results and Discussion
The cement increased in weight and showed increased loss on ignition upon prehydration (Table 2), indicating that water was physically or chemically bound to the cement particles. Thermal analysis was used to determine portlandite and calcite contents of anhydrous samples and pastes (Table 2). Anhydrous samples showed an increase in portlandite content caused by prehydration of the silicate phases. Subsequent portlandite carbonation is minimal, there being just a slight
increase in calcite content after 28 days. Prehydration also led to the formation of S-H and C-A-H plus gypsum by re-hydration of bassanite and/or anhydrite (Figure 1). Analysis of the pastes showed that conventional hydration leads to increased calcite and portlandite contents during hydration. Prehydrated cement pastes contained less portlandite indicating reduced reactivity. The results also show that they have higher calcite contents.
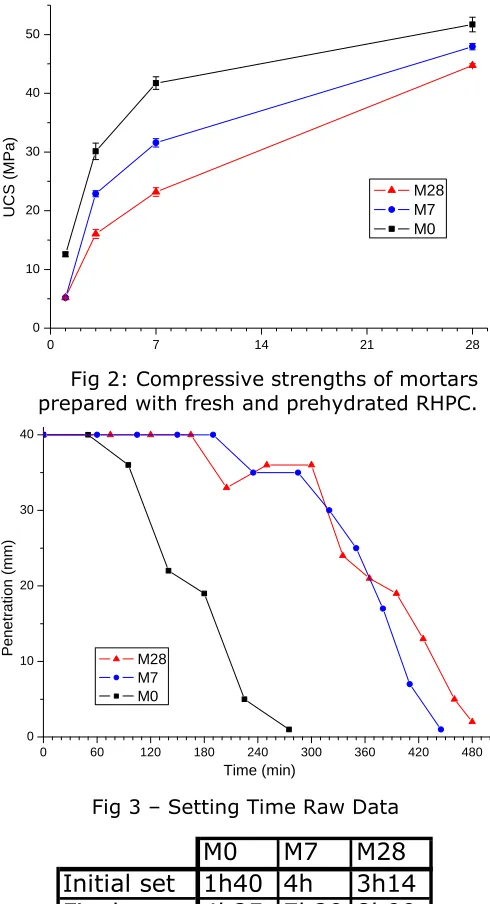
Figure 2 shows the development of mortar strength over 28 days. Strength is reduced when using increasingly prehydrated cement, particularly in early stages. There was a 58.5% reduction after one day yet only 13.5% reduction between mixes M0 and M28 after 28 days. This strength decrease has been noted previously [5,6], and Winnefeld [6] showed that prehydrated CEM I 42.5N no longer satisfies the strength requirement set out in BS EN 197-1:2000 [7] after prehydration for just two days. These results support the TGA observations which showed lower portlandite contents.
Prehydration also affected the water demand of the mortars. The workability measured according to [3] fell from 132 to 121.75 and then 118 mm for M0, M7 and M28 respectively. Similarly, the water demand for standard consistence increased, with water/cement ratios of 0.32, 0.35 and 0.495 for M0, M2 and M28 respectively. However, the setting time results were not so clear cut, as shown in Figure 3. Overall, setting was retarded for the prehydrated cements, but prehydrated cements were repeatedly observed to achieve an initial set, i.e. the time at which the penetration depth is 35 mm [4], and then regain plastcity, with re-setting some 60-90 minutes later. After which hardening proceeded as expected until final set was achieved, when penetration was 2mm.
0 200 400 600 800 1000
-0.8 -0.7 -0.6 -0.5 -0.4 -0.3 -0.2 -0.1 0.0
M28 M7 M0
mV
Temperature (oC) CaCO3 Ca(OH)2
C-A-H gypsum
[image:3.612.260.518.235.420.2]C-S-H
This behaviour presents problems over how best to report the results. However, since initial setting time is the point at which the material begins to lose plasticity it is sensible to report the first stiffening point (Table 3).
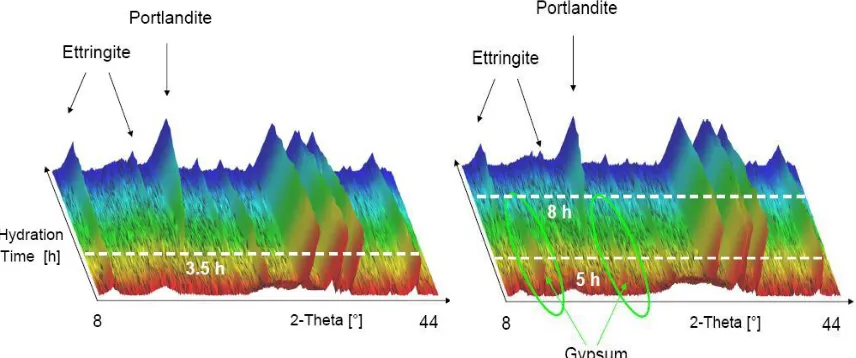
In-situ XRD was used to explain this unusual setting behaviour. Figure 4 shows the hydration behaviour of a paste (w/c = 0.5) prepared from non-prehydrated cement (M0) over a period of 12 hours. Ettringite was formed almost immediately from the reaction between soluble sulphates and C3A,
whilst portlandite, formed by hydration of the silicate phases, is present from beyond about 3 ½ hours.
The behaviour of the prehydrated samples was subtly, yet significantly different. Firstly, portlandite levels were greatly reduced in these pastes; with M28 showing even lower portlandite levels than M7 (Figures 5 and 6). This explains the reduction in compressive strength reported earlier, since the portlandite indicates hydration of silicate phases and is therefore a proxy for C-S-H. Additionally, pastes M7 and M28 contained gypsum during the early stages of hydration. Gypsum is less soluble than either anhydrite or bassanite and consequently, unlike when using fresh anhydrous cement, ettringite does not form immediately upon hydration, but rather after 5 or 6 hours. This explains the delayed initial setting time of prehydrated cements. Furthermore, the higher levels of gypsum in paste M7
may explain why its initial setting time is longer than that of M28.
We propose that the XRD data can also explain the unusual setting behaviour. The low solubility of gypsum compared to bassanite or anhydrite upsets the sulphate balance and delays ettringite formation. Thus, tricalcium aluminate hydrates in a sulphate-poor environment leading to stiffening in a manner similar to flash set, but delayed slightly due to a protective film of calcium aluminate and calcium silicate hydrates formed during prehydration [8]. However, over time the gypsum goes into solution and reacts with the calcium aluminate hydrates to form ettringite [9]. XRD shows that this conversion coincides with the cement’s plasticization, with further hydration continuing as normal and resulting in stiffening of the paste some 60-90 minutes later. This is supported by additional data for which there is not space to show.
0 7 14 21 28
0 10 20 30 40 50 U C S (MPa )
Length of Hydration (days)
[image:4.612.283.528.73.525.2]M28 M7 M0
Fig 2: Compressive strengths of mortars prepared with fresh and prehydrated RHPC.
0 60 120 180 240 300 360 420 480
0 10 20 30 40 P ene trati on (mm) Time (min) M28 M7 M0
Fig 3 – Setting Time Raw Data
M0 M7 M28
Initial set 1h40 4h 3h14
Final set 4h25 7h20 8h00
Figure 4:XRD pattern from M0 paste. Figure 5: XRD pattern from M7 paste.
4.
Conclusions
Prehydration of Portland cement severely affects its hydration behaviour and consequently its engineering performance. Prehydrated cements have an increased water demand, reduced workability and lower compressive strengths (particularly at early ages). Prehydrated cements also show unusual setting behaviour, in that they show an initial set before becoming plastic once more and then subsequently hardening in a conventional manner, albeit much delayed. All of these behaviours can be explained following characterisation of the prehydrated cement powders. Prehydration leads to the formation of hydration products on the surfaces of the cement grains, calcium silicate and calcium aluminate hydrates, portlandite and, importantly, gypsum. The formation of gypsum perturbs the sulphate balance, delaying ettringite formation and retarding setting. Importantly, this leads to a quasi-flash set which disappears as the gypsum slowly goes into solution and reacts with the calcium aluminate hydrates.
References
1
Mejlhede Jensen, O. et al., Cement and Concrete Research, 1999, 29, 1505-1512.
2
BS4550-3:4:1978, Methods of Testing Cement – Strength, BSI 1978.
3
BS 4551:2005 Mortar. Methods of test for mortar. Chemical analysis and physical testing.
4
BS 4550-3.6:1978 Methods of Testing Cement – Setting Time.
5
Theisen K., Johansen, V., J.American Ceramic Society, 1975, 54(9), 787-791.
6
Winnefeld, F., ZKG International, 2008, 61(11), 68-77.
7
BS EN197-1:2000 Composition, specifications and conformity criteria for common cements.
8
Dubina, E. et al., Advances in Applied Ceramics, 2010 109(5).
9
Fu, Y. et al., Cement and Concrete Research, 1996, 26, 417-426.