Using next-generation sequencing for high
resolution multiplex analysis of copy number
variation from nanogram quantities of DNA from
formalin-fixed paraffin-embedded specimens
Henry M. Wood
1,*, Ornella Belvedere
1, Caroline Conway
1, Catherine Daly
1,
Rebecca Chalkley
1, Melissa Bickerdike
1, Claire McKinley
1, Phil Egan
1, Lisa Ross
1,
Bruce Hayward
2, Joanne Morgan
1, Leslie Davidson
3, Ken MacLennan
4, Thian K. Ong
5,
Kostas Papagiannopoulos
6, Ian Cook
7, David J. Adams
8, Graham R. Taylor
1and
Pamela Rabbitts
11
Leeds Institute of Molecular Medicine, Section of Experimental Therapeutics, 2Leeds Institute of Molecular Medicine, Section of Genetics, Wellcome Trust Brenner Building, 3Department of Histopathology, Bexley Wing, 4
Leeds Institute of Molecular Medicine, Section of Pathology and Tumour Biology, Wellcome Trust Brenner Building, St James’s University Hospital, Leeds, LS9 7TF,5Leeds Dental Institute, Leeds General Infirmary, Leeds, LS2 9LU,6Department of Thoracic Surgery, Bexley Wing, 7Cytogenetics Unit, St James’s University Hospital, Leeds, LS9 7TF and8The Wellcome Trust Sanger Institute, Hinxton, Cambridge, CB10 1SA, UK
Received April 9, 2010; Revised May 13, 2010; Accepted May 20, 2010
ABSTRACT
The use of next-generation sequencing technologies to produce genomic copy number data has recently been described. Most approaches, however, reply on optimal starting DNA, and are therefore unsuitable for the analysis of formalin-fixed paraffin-embedded (FFPE) samples, which largely precludes the analysis of many tumour series. We have sought to challenge the limits of this technique with regards to quality and quantity of starting material and the depth of sequencing required. We confirm that the technique can be used to interrogate DNA from cell lines, fresh frozen material and FFPE samples to assess copy number variation. We show that as little as 5 ng of DNA is needed to generate a copy number karyogram, and follow this up with data from a series of FFPE biopsies and surgical samples. We have used various levels of sample multiplexing to demonstrate the adjustable resolution of the meth-odology, depending on the number of samples and available resources. We also demonstrate reprodu-cibility by use of replicate samples and comparison with microarray-based comparative genomic
hybridization (aCGH) and digital PCR. This tech-nique can be valuable in both the analysis of routine diagnostic samples and in examining large repositories of fixed archival material.
INTRODUCTION
Systems medicine is expected to link complex molecular data underlying disease phenotypes to patient outcomes (1). As technology for data generation, such as next-generation (NG) sequencing, and methodology for computational analysis develop rapidly, the accessibility of clinical material of sufficient quality and quantity is likely to be rate limiting in the discovery process. For cancer patients, diagnosis is virtually always based on the evaluation of a tumour sample, ideally a biopsy or surgical specimen. Left-over tissue, stored in pathology archives and no longer required following diagnosis or clinical management, proves an immense resource for mo-lecular analysis, as each cancer patient is a potential donor. The fixation procedures, necessary for tissue pres-ervation in the diagnostic setting, may however comprom-ise the quality of the material with regard to some applications. One of the applications described for NG sequencing is the production of copy number variation
*To whom correspondence should be addressed. Tel: +44 113 2066215; Fax: +44 113 3438 601; Email: h.m.wood@leeds.ac.uk
ßThe Author(s) 2010. Published by Oxford University Press.
(CNV) data by analysing the distribution of aligned reads to a reference genome (2–5). These initial studies have used a depth of sequencing that would preclude the routine analysis of large numbers of samples. They have also used optimal starting conditions in terms of DNA quality and quantity, which are not likely with clinical samples. However, Schweiger et al. (6) recently showed that DNA isolated from formalin-fixed paraffin-embedded (FFPE) tumours could be used for sequencing-based CNV analysis. Here, we report how we have modified the current methods for sequencing-based CNV analysis and overcome their limitations, to allow the high-throughput copy number analysis of DNA from suboptimal quality material, such as FFPE tissue. Specifically, we have investigated the feasibility of undertaking sequence analysis of samples in pools using unique oligonucleotide tags to distinguish individual patients. We demonstrate that up to 10 patient samples can be pooled in one sequencing lane of an Illumina Genome Analyzer II (GAII; Illumina Inc, San Diego, CA, USA). We also show that as little as 5 ng (compared to Illumina’s recom-mended 1mg) of template DNA from FFPE specimens is sufficient to generate a library of fragments for sequence analysis, resulting in a copy number karyogram that is indistinguishable from a karyogram generated from 1mg of template DNA or from DNA isolated from the same fresh-frozen tumours without prior fixation. These modi-fications will enable exploitation of the vast archives of FFPE material to supply the systems medicine research pipeline, and will bring this methodology within the reach of routine clinical analysis, while preserving the majority of the tissue block for other investigations.
To illustrate the value of this approach, we have obtained FFPE samples of repeat biopsies and resection specimens from the same patient whose oral cancer recurred over a 2-year period. We show that all samples share certain copy number aberrations indicating a likely common progenitor, but that the most recent samples display a new region of chromosomal amplification indicating that an initial clonal population of tumour cells has continued to mutate.
MATERIALS AND METHODS
Sample selection
Cell lines. LUDLU-1 cell line was established from a lung squamous cell carcinoma (7). AGLCL cell line was estab-lished following EBV infection of normal B cells from the same patient. Both cell lines were cultured in RPMI 1640 medium supplemented with 2 mM glutamine, 50 U/ml penicillin, 50mg/ml streptomycin and 10% foetal bovine serum using standard cell culture techniques. The HONE-1 cell line is an epithelial cell line derived from a poorly differentiated nasopharyngeal squamous cell car-cinoma (8). It was cultured in Iscove’s modified Dulbecco’s medium, supplemented with 2 mM glutamine, 50 U/ml penicillin, 50mg/ml streptomycin and 10% foetal bovine serum using standard cell culture techniques.
Clinical samples. Surgical resection specimens of lung tumours and corresponding normal lung tissue were pro-spectively collected at the local Department of Thoracic Surgery, snap frozen and stored in aliquots at 80C. FFPE blocks of lung tumours, oral tumours and dysplas-tic lesions were retrieved from the local pathology archive. Approval was obtained from the local ethics committee and written informed consent for the use of their tissue for research was available for all patients.
DNA isolation
Snap-frozen tissues and cell lines. Genomic DNA from clinical samples and cell lines was prepared by sequential phenol/chloroform extraction followed by ethanol precipi-tation, adapted from a previously described method (9). Briefly, frozen tissue was ground using pestle and mortar and the resulting powder suspended in 0.4% LiDS lysis buffer; cell lines were harvested from the culture flask, pelletted by centrifugation and resuspended in 0.4% LiDS lysis buffer. Proteinase K was then added to the cell lysate to a final concentration of 100mg/ml and incubated overnight at 55C. Following three phenol ex-tractions and one with chloroform, the final aqueous solution was added with 0.3 M sodium acetate pH 5.2 (1:10 vol:vol) and DNA precipitated by the addition of two volumes of 95% ethanol. The DNA precipitate was then collected by centrifugation, washed with 70% ethanol, air dried and finally dissolved in sterile water.
FFPE tissue sections. Areas of dysplasia or tumour to be dissected were identified and marked by a pathologist on an haematoxylin and eosin (H+E) stained slide cut from each FFPE block to be sampled. Ten 7mm sections were then cut and the dysplastic or tumour tissue was macro-dissected with a scalpel blade using the marked H+E slide as a guide. A further section was cut and then H+E stained to confirm persistence of histology throughout the areas sampled. DNA extraction was per-formed using the QIAamp DNA micro kit (Qiagen, Sussex, UK) according to the manufacturer’s instructions and DNA was eluted in 25ml of AE Buffer.
DNA concentration and purity was determined using the Nanodrop-8000 (Fisher Scientific UK Ltd, Leicestershire, UK) and the Quant-iT PicoGreen dsDNA BR assay (Invitrogen, Paisley, UK).
Array-CGH
Illumina Genome Analyser library preparation
Between 5 ng and 1mg genomic DNA were used to prepare the DNA libraries for sequencing, following standard Illumina protocols. DNA was sheared on a Covaris S2 Sample Preparation System (Covaris Inc., Woburn, MA, USA) and checked for appropriate size distribution on an Agilent Bioanalyser DNA 1000 LabChip. End repair was performed by using the End-It DNA End Repair Kit (Epicentre Biotechnologies, Madison, WI, USA) and Klenow DNA polymerase, followed by ligation of 6 bp unique tag adapter oligonucleotides, using previously es-tablished methods (11). Tags were chosen so as to avoid over-representation of any one base at each position, which can interfere with cluster recognition. Fragments were size selected to 200 bp using a gel cut step. Samples were enriched using a 12-cycle enrichment PCR. For low concentration DNA samples, an 18-cycle enrichment PCR was performed before the gel cut stage rather than after-wards. Libraries were then examined using an Agilent Bioanalyser DNA 1000 LabChip and Invitrogen’s Quant-iT Picogreen dsDNA BR assay kit to assess for DNA quality and concentration, respectively. This infor-mation was used to pool equal amounts of each sample library for cluster amplification and either 51 or 76 cycles of Illumina sequencing by synthesis, resulting in 45/70 bp of genomic DNA sequence and 6 bp of tagged adapter. Sequencing was initially done with 51-bp reads but the move was made to 76-bp reads as machine and analysis package upgrades resulted in better base calling for longer reads.
Data analysis
Image analysis and base calling were performed using Illumina’s CASAVA pipeline. Reads were trimmed of their 6 bp tags with the USE_BASES option and uniquely aligned to the human genome (UCSC version hg19) using the alignment algorithm Eland (12). Python scripts were used to first split the reads into files according to tag, and then to make pairwise comparisons of each tumour and normal sample by splitting the genome into non-overlapping windows of equal numbers of normal reads, typically 400, and counting the number of tumour reads which fell into each window.
Copy number analysis was done in R, first by normalizing the number of tumour and normal counts across the genome and calculating the log2 ratio of normalized tumour:normal read counts for each window. Second, segments of equal copy number were called using the Bioconductor DNAcopy package (13). These segments were converted into bedgraphs suitable for uploading onto the UCSC genome browser (http://genome.ucsc.edu/) (14) as well as being plotted over graphs of tumour read counts. A summary of the number of aligned reads and subsequently detected CNVs for each sample is listed in Table 1.
[image:3.612.58.571.454.717.2]A Pearson correlation was calculated between the array-CGH (aCGH) and sequencing data by calculating an average aCGH generated copy number for every genomic window of sequencing reads. This made it possible to perform a pairwise comparison of two files of equal length.
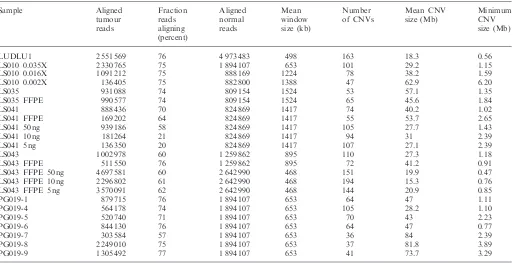
Table 1. Summary statistics for each sample Sample Aligned tumour reads Fraction reads aligning (percent) Aligned normal reads Mean window size (kb) Number of CNVs Mean CNV size (Mb) Minimum CNV size (Mb)
A similar method was used to calculate the correlation between molecular copy number counting (MCC) and sequencing data, sampling the sequence based copy number for every MCC data point.
RESULTS
Reproducibility and validation of NG sequencing for CNV analysis
We began by analysing the copy number profile of genomic DNA from the lung squamous cell carcinoma cell line LUDLU-1 and the DNA from the paired normal B cell line AGLCL. We confirmed that the tumour karyogram demonstrated copy number gain and loss features predicted for a squamous cell lung carcinoma such as 3p loss and distal 3q and 8q amplification (15–17) (Supplementary Figure S1). We confirmed by comparing the normal DNA from five individuals that comparison of normal DNA against normal DNA resulted in a feature-less karyogram with no detectable gain or loss (result not shown).
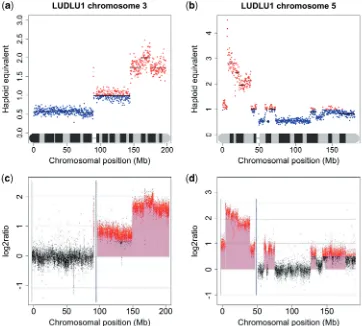
Further validation was achieved by comparing the copy number profile generated by NG sequencing with that obtained by aCGH. High-resolution aCGH was per-formed using an Agilent 244K array using DNA from LUDLU-1 and AGLCL cells. The aCGH-generated
copy number profiles appeared almost identical to those obtained from sequence analysis. Every chromosome showed the same pattern of gain and loss. Even smaller features such as small spikes of gain or loss were replicated. A Pearson correlation of 0.9362277 was calculated between the two data sets. Examples from the aCGH profile compared to a copy number karyogram generated from NG sequencing data is shown in Figure 1. To determine the validity of copy number annotation by sequencing even at high resolution, we compared its performance to another method that also generates copy number data in a digital format, MCC (18,19). We compared the copy number profile generated by NG sequencing with the MCC data for the 17 Mb amplicon in the distal part of chromosome 3q in the HONE-1 cell line and found the profiles to be very similar. Gains and losses were seen in the same places, although the MCC data were noisier and suggested a slightly higher copy number in places. A Pearson correlation of 0.8126372 was calculated between the two data sets (Figure 2).
[image:4.612.118.480.387.713.2]The reproducibility of copy number data produced from NG sequencing was confirmed by demonstrating vir-tually identical copy number karyograms on analysis of duplicates of four sets of DNA from tumour:normal pairs of fresh frozen lung squamous cell carcinomas (Supplementary Figure S2).
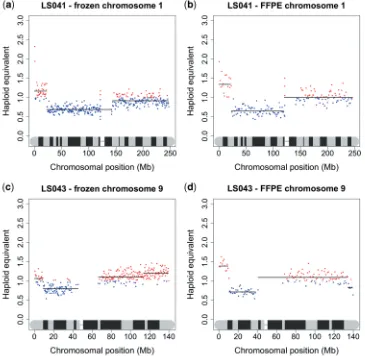
Finally, we compared the copy number karyograms for DNA extracted from snap frozen versus FFPE material from the same lung squamous cell carcinomas (Figure 3). As previously shown by Schweiger et al. the matching
[image:5.612.131.494.135.306.2]fresh and fixed copy number karyograms for some of the samples were almost identical even when examined at high resolution. For other samples, the positions of regions of CNV in the fixed samples were identical to
[image:5.612.131.496.350.706.2]Figure 3. Copy number karyograms of DNA extracted from snap frozen and FFPE tissue. Representative individual chromosome plots for two lung squamous cell carcinoma patients (LS041 and LS043) are shown. (a) LS041 snap frozen chromosome 1; (b) LS041 FFPE chromosome 1; (c) LS043 snap-frozen chromosome 9; (d) LS043 FFPE chromosome 9.
the frozen samples, but the magnitude of variation was greater. For example, in the fresh-frozen sample, LS043, shown in Figure 3, the distal 9 Mb of 9p has a tu-mour:normal ratio of 1.1:1, while the rest of the 9p arm has a ratio of 0.82:1. In the FFPE sample the two regions are in the same position, but have ratios of 1.51:1 and 0.75:1, respectively. This difference is probably due to the removal of non-cancerous cells (i.e. stromal cells, in-flammatory cells and endothelial cells) by macrodissection in the fixed samples.
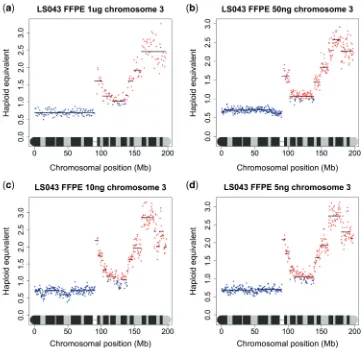
The effect of using decremental amounts of starting DNA
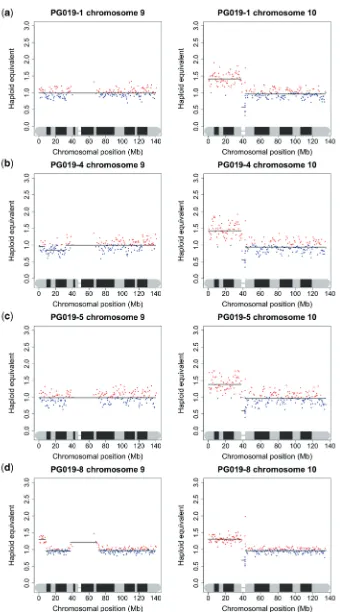
Due to the difficulty in obtaining large amounts of good quality DNA from many clinical samples, especially fixed archival surgical and biopsy specimens, we undertook to investigate the minimum amount of DNA that is needed to produce acceptable sequence data for copy number analysis. We performed a series of dilutions of DNA from one of the frozen tumour samples and one of the FFPE samples, so that sequencing libraries were generated from 400 ng, 200 ng, 100 ng, 50 ng, 10 ng and 5 ng of starting DNA, compared to Illumina’s recommended 1mg. As all the libraries appeared to be within normal parameters as judged by Agilent readings, only those prepared from 50 ng, 10 ng and 5 ng were sequenced. While it was difficult to accurately titrate the lower con-centration libraries to give a consistent number of sequencing reads, and some samples gave a low percentage of alignable reads, the karyograms produced were almost identical to those made under Illumina’s recommended conditions suggesting that copy number data could be obtained from nanogram quantities of DNA isolated from tissue sections of a FFPE block (Figure 4). To confirm this in a real sample, we obtained FFPE blocks of sequential biopsies and surgical specimens from a patient with multifocal oral cancer who has been under the care of the local maxillo-facial unit for several years. Specifically, we obtained blocks for (i) a biopsy of a tumour in the left tongue in May 2007, (ii) a biopsy of dysplasia in the right floor of the mouth in June 2008, (iii) a wide excision specimen of the same dysplasia in July 2008 and (iv) four distinct specimens of tumour-associated dysplasia obtained from a further anterior floor of mouth surgical resection in August 2009. DNA was isolated from macrodissected dysplastic and tumour tissue and libraries were prepared from template DNA ranging from 55 to 270 ng. The karyograms were mostly normal (results not shown): the most notable feature was gain of 10p, which was common to all lesions. The synchronous biopsies obtained in the surgical field in August 2009 carried an 8Mb region of amplification of distal 9p in addition to gain of 10p (Figure 5).
Feasibility of multiplexing
We investigated sequencing various numbers of pooled libraries together in order to gain an understanding of the quality of data obtainable from different levels of reagent and machine capacity investment. The initial ex-periment using the LUDLU-1:AGLCL cell line pair was performed using one eighth of an Illumina GAII run and
produced 7 897 570 uniquely aligning reads. Of these, tagging indicated that 2 547 384 were from LUDLU1. A total of 2 500 000 reads of 45 bp (51 bp – 6 bp tag) repre-sents 113 Mb, or0.04coverage. The 206 CNV regions were detected with mean size of 15 Mb and a smallest detectable size of 15 Kb.
For the subsequent experiment using DNA from snap-frozen tumour:normal pairs, the level of multiplexing was increased so that 10 samples (5 pairs) were pooled and analysed together on one eighth of an Illumina GAII run. Between 847 576 and 1 321 486 reads per sample were obtained. Between 57 and 115 copy number variation regions were detected, averaging between 26 and 58 Mb in size, with a smallest detectable region between 0.9 and 1.5 Mb. This experiment was duplicated and the reads from each sequencing run combined to give between 1 873 100 and 2 328 268 reads per sample (0.028–0.035
coverage). The overall CNV pattern of each sample remained unchanged (Figure 6a and b), but the DNAcopy algorithm was able to detect smaller regions of copy number variation, between 89 and 200 Kb. As a result, the number of observed regions increased to between 81 and 187.
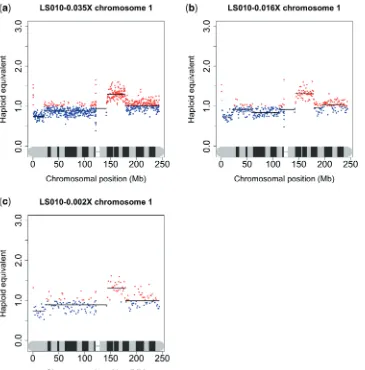
To determine how little data would give reproducible results, 90% of the reads from one of the frozen samples (LS010) were randomly removedin silico, leaving 136 405 tumour reads or 0.002coverage. This is an approximate simulation of running 80 tagged samples on one lane, or 0.15% of the sequencer’s total capacity. Currently, this is not technically feasible, but may be achievable in the near future as methods such as DNA Sudoku mature (20). Unsurprisingly, all fine scale data were lost, the smallest region of variation being detected being 5 Mb. It was still perfectly possible to see large-scale aberrations such as the gain or loss of whole chromosomal arms (Figure 6c), sug-gesting that this methodology could still provide useful data even when highly multiplexed.
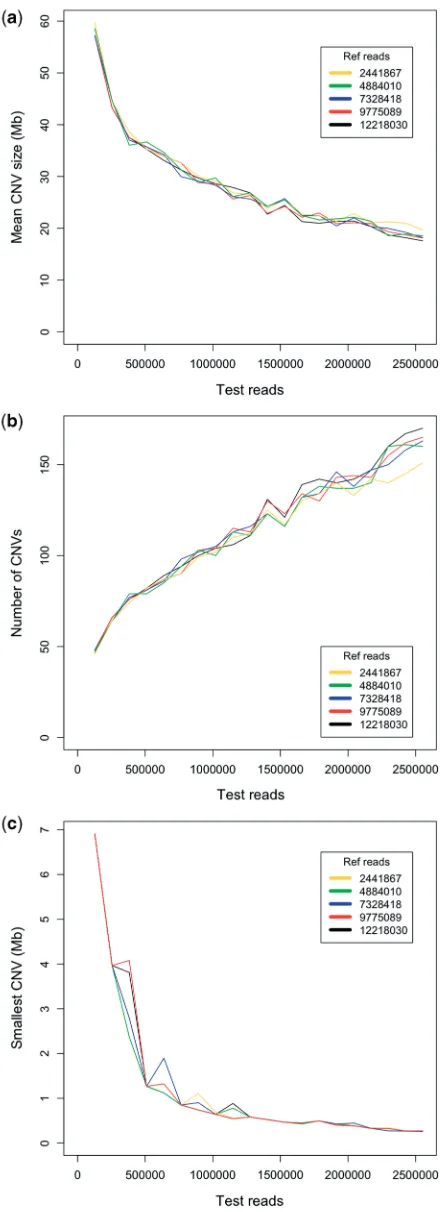
To further explore the theoretical limits of multiplexing, a series of simulations were performed using the LUDLU-1:AGLCL cell line pair. An additional 7.4 million AGLCL reads were sequenced, giving a total of 12 218 030 reads. Reads were randomly stripped away
DISCUSSION
We have demonstrated that NG sequencing platforms can be used in a high-throughput, cost-effective manner to elucidate copy number information from a variety of DNA sources, including cell lines, frozen tumour samples and FFPE material. We have shown that good quality data can be obtained when multiplexing up to 10 samples on one lane of an Illumina GAII. We have shown that the method is reproducible, and that the resolution is highly flexible and adjustable. The resolution has been shown to be comparable with aCGH when performed at low levels of multiplexing and has a high degree of correl-ation. NG sequencing also produces much more data than a comparable investment in a PCR-based method such as loss of heterozygosity (LOH) analysis or MCC when performed at higher levels of multiplexing. Sequence data and MCC does show a strong correlation, but not as strong as that between sequencing and aCGH. We have concentrated on tumour samples, but the method is equally applicable to studies of CNV in constitutional DNA. In fact, the data are much easier to interpret when all the cells in a sample have the same genotype.
Currently, the leading technology for investigating CNV is aCGH. However, limitations remain for certain applications. aCGH has proved difficult to use with DNA from FFPE samples. Typically, researchers have had to devise ingenious upstream methods in order to study archival material (21). Also, aCGH typically requires microgram quantities of DNA. When smaller samples are studied, a whole-genome amplification step is general-ly incorporated (22). Our method requires almost no extra fine tuning as we moved from cell line DNA to nanogram amounts of DNA from archival FFPE material, showing that neither a large amount of template or a whole genome amplification step are required. In addition, although we have only demonstrated the use of these data for copy number analysis, each lane of sequencing generates in the region of 700 Mb of sequence data, which can be analysed for other purposes such as searching for genetic variants or viral infection.
[image:7.612.131.494.66.414.2]Previous studies have used read depth of sequence to examine copy number but with ideal reaction conditions and greater depth of coverage (2–5). Other studies have explored the limits of this technology further, by use of multiplexing (23) or by using DNA from FFPE samples
(6). We have sought to combine both approaches and to further push the limits as to the minimum amounts of starting DNA required. The multiplexing aspect is import-ant because it allows researchers to tailor their study design according to the number of samples, desired reso-lution and available resources. The same sequencing library can be used for a 1 Kb or a 10 Mb resolution ex-periment. The only difference is the amount of sequencing required. Libraries can be aliquoted for use a number of times so that samples can be initially screened cheaply at low resolution and then further examined at high reso-lution at a later date and with no additional preparation. Data from two duplicate experiments on the same sample can be merged to double the coverage.
We have demonstrated that sequencing libraries can be constructed starting with nanogram quantities of DNA and, by combining individually tagged libraries, copy number karoygrams can be generated from 10 samples in a single Illumina sequencing run, with the theoretical possibility of extending this number up to at least 80. Besides demonstrating this high-throughput potential,
we have also confirmed the observations of Schweiger
et al. (6) that DNA isolated from FFPE material can serve as a template to create sequencing libraries for NG sequencing. We have substantially extended the range of samples that can be studied by reducing the amount of template required for library construction from 1.5mg to less than 100 ng. This is an important practical consider-ation because it allows minute tissue samples such as biopsies to be analysed. Not only are biopsies small but also the way they are obtained from patients often incorp-orates underlying stroma, requiring micro-dissection to increase the proportion of abnormal epithelial cells, decreasing the amount of DNA template still further. However these difficulties must be overcome, as analysis of biopsies is essential for both basic and translational cancer research.
[image:9.612.134.499.66.436.2]In attempting to identify the genomic drivers of malig-nant tumour initiation and progression of upper aerodigestive cancer, we have used a number of molecular genetic techniques to compare candidate regions, genes and chromosomes of pre-invasive lesions, obtained as
biopsies, and the subsequent tumours that develop at the site of the earlier pre-invasive lesions (24–26). In this study, we have used NG sequencing to generate whole genome copy number karyotypes of biopsies and tumours obtained in a chronologic series from a patient with oral cancer. The patient’s cancer has had a relatively indolent disease course reflected by several invasive tumours and dysplastic lesions but no metastatic disease. The karyotypes of the tumour and dysplastic lesions obtained carry relatively few gains and losses compared other the other carcinoma karyograms we examined. This may be a reflection of the tumour’s histology, a verrucous squamous cell carcinoma, whose benign growth pattern may in turn be a consequence of a relatively normal genotype. However, all specimens examined carry gain of the short arm of chromosome 10 indicating a clonal origin. Those obtained from the most recent surgery demonstrated genomic progression, having acquired amp-lification of distal 9p, an 8 Mb region encompassing 63 predicted genes (27). 9p loss has been associated with tumour progression (28,29), but gain in this region so far has not.
Besides the analysis of biopsies for laboratory studies of clonality and the genomics of tumour progression, the genomic assessment of tumours via the preliminary diag-nostic biopsy may a be a useful supplement to routine histopathology, as knowledge of a tumour’s genotype can provide information for prognosis and treatment response (30). The international initiatives to document cancer genomes (http://www.icgc.org/, http://cancergen ome.nih.gov/about/index.asp) will substantially augment our current knowledge. We have used fixed archival spe-cimens in this study, but the current samples of each new patient are also fixed as part of routine clinical practice, and the ability to generate whole-genome information from the fixed samples obtained as demonstrated here, indicates how cataloguing genome architecture could be become part of the repertoire of diagnostic tests for cancer.
SUPPLEMENTARY DATA
Supplementary Data are available at NAR Online.
ACKNOWLEDGEMENTS
The authors thank Dr Maria Kost-Alimova, Karolinska Institute, Stockholm, Sweden, for kindly providing the HONE-1 cell line used in this study.
FUNDING
Yorkshire Cancer Research (L341PG); Marie Curie Intra-European Fellowship within the 7th European Community Framework Programme (219540 to O.B.); Cancer Research UK and the Wellcome Trust (to D.J.A.). Funding for open access charge: Yorkshire Cancer Research.
[image:10.612.56.276.65.671.2]Conflict of interest statement. None declared.
REFERENCES
1. Auffray,C., Chen,Z. and Hood,L. (2009) Systems medicine: the future of medical genomics and healthcare.Genome Med.,1, 2. 2. Campbell,P.J., Stephens,P.J., Pleasance,E.D., O’Meara,S., Li,H.,
Santarius,T., Stebbings,L.A., Leroy,C., Edkins,S., Hardy,C.et al. (2008) Identification of somatically acquired rearrangements in cancer using genome-wide massively parallel paired-end sequencing.Nat. Genet., 40, 722–729.
3. Chiang,D.Y., Getz,G., Jaffe,D.B., O’Kelly,M.J., Zhao,X., Carter,S.L., Russ,C., Nusbaum,C., Meyerson,M. and Lander,E.S. (2009) High-resolution mapping of copy-number alterations with massively parallel sequencing.Nat. Methods,6, 99–103.
4. Xie,C. and Tammi,M.T. (2009) CNV-seq, a new method to detect copy number variation using high-throughput sequencing.BMC Bioinformatics,10, 80.
5. Yoon,S., Xuan,Z., Makarov,V., Ye,K. and Sebat,J. (2009) Sensitive and accurate detection of copy number variants using read depth of coverage.Genome Res.,19, 1586–1592.
6. Schweiger,M.R., Kerick,M., Timmermann,B., Albrecht,M.W., Borodina,T., Parkhomchuk,D., Zatloukal,K. and Lehrach,H. (2009) Genome-wide massively parallel sequencing of
formaldehyde fixed-paraffin embedded (FFPE) tumor tissues for copy-number- and mutation-analysis.PLoS ONE,4, e5548. 7. Rabbitts,P., Douglas,J., Daly,M., Sundaresan,V., Fox,B.,
Haselton,P., Wells,F., Albertson,D., Waters,J. and Bergh,J. (1989) Frequency and extent of allelic loss in the short arm of
chromosome 3 in nonsmall-cell lung cancer.Genes Chromosomes Cancer,1, 95–105.
8. Glaser,R., Zhang,H.Y., Yao,K.T., Zhu,H.C., Wang,F.X., Li,G.Y., Wen,D.S. and Li,Y.P. (1989) Two epithelial tumor cell lines (HNE-1 and HONE-1) latently infected with Epstein-Barr virus that were derived from nasopharyngeal carcinomas.Proc. Natl Acad. Sci. USA,86, 9524–9528.
9. Davis,L.G., Kuehl,W.M. and Battey,J.F. (1994)Basic Methods in Molecular Biology, 2nd edn. Appleton & Lange, Norwalk, pp. 16–21.
10. Fiegler,H., Redon,R. and Carter,N.P. (2007) Construction and use of spotted large-insert clone DNA microarrays for the detection of genomic copy number changes.Nat. Protocol,2, 577–587.
11. Craig,D.W., Pearson,J.V., Szelinger,S., Sekar,A., Redman,M., Corneveaux,J.J., Pawlowski,T.L., Laub,T., Nunn,G.,
Stephan,D.A.et al. (2008) Identification of genetic variants using bar-coded multiplexed sequencing.Nat. Methods,5, 887–893. 12. Bentley,D.R., Balasubramanian,S., Swerdlow,H.P., Smith,G.P.,
Milton,J., Brown,C.G., Hall,K.P., Evers,D.J., Barnes,C.L., Bignell,H.R.et al. (2008) Accurate whole human genome sequencing using reversible terminator chemistry.Nature,456, 53–59.
13. Venkatraman,E.S. and Olshen,A.B. (2007) A faster circular binary segmentation algorithm for the analysis of array CGH data.
Bioinformatics,23, 657–663.
14. Kent,W.J., Sugnet,C.W., Furey,T.S., Roskin,K.M., Pringle,T.H., Zahler,A.M. and Haussler,D. (2002) The human genome browser at UCSC.Genome Res.,12, 996–1006.
15. Bjorkqvist,A.M., Husgafvel-Pursiainen,K., Anttila,S., Karjalainen,A., Tammilehto,L., Mattson,K., Vainio,H. and Knuutila,S. (1998) DNA gains in 3q occur frequently in
squamous cell carcinoma of the lung, but not in adenocarcinoma.
Genes Chromosomes Cancer,22, 79–82.
16. Fong,K.M., Biesterveld,E.J., Virmani,A., Wistuba,I., Sekido,Y., Bader,S.A., Ahmadian,M., Ong,S.T., Rassool,F.V.,
Zimmerman,P.V.et al. (1997) FHIT and FRA3B 3p14.2 allele loss are common in lung cancer and preneoplastic bronchial lesions and are associated with cancer-related FHIT cDNA splicing aberrations.Cancer Res.,57, 2256–2267.
17. Balsara,B.R., Sonoda,G., du Manoir,S., Siegfried,J.M., Gabrielson,E. and Testa,J.R. (1997) Comparative genomic hybridization analysis detects frequent, often high-level, overrepresentation of DNA sequences at 3q, 5p, 7p, and 8q in human non-small cell lung carcinomas.Cancer Res.,57, 2116–2120.
18. Daser,A., Thangavelu,M., Pannell,R., Forster,A., Sparrow,L., Chung,G., Dear,P.H. and Rabbitts,T.H. (2006) Interrogation of genomes by molecular copy-number counting (MCC).
Nat. Methods,3, 447–453.
19. McCaughan,F., Darai-Ramqvist,E., Bankier,A.T., Konfortov,B.A., Foster,N., George,P.J., Rabbitts,T.H., Kost-Alimova,M., Rabbitts,P.H. and Dear,P.H. (2008) Microdissection molecular copy-number counting (microMCC)–unlocking cancer archives with digital PCR.
J. Pathol.,216, 307–316.
20. Erlich,Y., Chang,K., Gordon,A., Ronen,R., Navon,O., Rooks,M. and Hannon,G.J. (2009) DNA Sudoku–harnessing
high-throughput sequencing for multiplexed specimen analysis.
Genome Res.,19, 1243–1253.
21. Hostetter,G., Kim,S.Y., Savage,S., Gooden,G.C., Barrett,M., Zhang,J., Alla,L., Watanabe,A., Einspahr,J., Prasad,A.et al. (2010) Random DNA fragmentation allows detection of single-copy, single-exon alterations of copy number by oligonucleotide array CGH in clinical FFPE samples.Nucleic Acids Res.,38, e9.
22. Little,S.E., Vuononvirta,R., Reis-Filho,J.S., Natrajan,R., Iravani,M., Fenwick,K., Mackay,A., Ashworth,A.,
Pritchard-Jones,K. and Jones,C. (2006) Array CGH using whole genome amplification of fresh-frozen and formalin-fixed, paraffin-embedded tumor DNA.Genomics,87, 298–306.
23. Daines,B., Wang,H., Li,Y., Han,Y., Gibbs,R. and Chen,R. (2009) High-throughput multiplex sequencing to discover copy number variants in Drosophila.Genetics,182, 935–941.
24. Foster,N.A., Banerjee,A.K., Xian,J., Roberts,I., Pezzella,F., Coleman,N., Nicholson,A.G., Goldstraw,P., George,J.P. and Rabbitts,P.H. (2005) Somatic genetic changes accompanying lung tumor development.Genes Chromosomes Cancer,44, 65–75. 25. Banerjee,A.K., Read,C.A., Griffiths,M.H., George,P.J. and
Rabbitts,P.H. (2007) Clonal divergence in lung cancer development is associated with allelic loss on chromosome 4.
Genes Chromosomes Cancer,46, 852–860.
26. McCaughan,F., Pole,J.C., Bankier,A.T., Konfortov,B.A., Carroll,B., Falzon,M., Rabbitts,T.H., George,P.J., Dear,P.H. and Rabbitts,P.H. Progressive 3q amplification consistently targets SOX2 in preinvasive squamous lung cancer.Am. J. Respir. Crit. Care Med., doi:10.1164/rccm.201001-0005OC [18 March 2010, Epub ahead of print].
27. Rhead,B., Karolchik,D., Kuhn,R.M., Hinrichs,A.S., Zweig,A.S., Fujita,P.A., Diekhans,M., Smith,K.E., Rosenbloom,K.R., Raney,B.J.et al. (2010) The UCSC Genome Browser database: update 2010.Nucleic Acids Res.,38, D613–D619.
28. Rosin,M.P., Lam,W.L., Poh,C., Le,N.D., Li,R.J., Zeng,T., Priddy,R. and Zhang,L. (2002) 3p14 and 9p21 loss is a simple tool for predicting second oral malignancy at previously treated oral cancer sites.Cancer Res.,62, 6447–6450.
29. Martin,C.L., Reshmi,S.C., Ried,T., Gottberg,W., Wilson,J.W., Reddy,J.K., Khanna,P., Johnson,J.T., Myers,E.N. and Gollin,S.M. (2008) Chromosomal imbalances in oral squamous cell carcinoma: examination of 31 cell lines and review of the literature.Oral Oncol.,44, 369–382.
30. Douillard,J.Y., Shepherd,F.A., Hirsh,V., Mok,T., Socinski,M.A., Gervais,R., Liao,M.L., Bischoff,H., Reck,M., Sellers,M.V.et al. (2010) Molecular predictors of outcome with gefitinib and docetaxel in previously treated non-small-cell lung cancer: data from the randomized phase III INTEREST trial.J. Clin. Oncol.,