On Measuring Social Dynamics of Online
Social Media
Ian David Wood
Oct 2016
A thesis submitted for the degree of Doctor of Philosophy of the Australian National University
Declaration
The work in this thesis is my own except where otherwise stated.
Acknowledgements
This work would not have been possible without the help of many people. I cannot hope to include everyone here, and the journey has been long, with the early stages lost in the mists of time. Nonetheless, I would like to thank the following for their advice, support and encouragement: Henry Gardner, Rob Ackland, Dirk Van Rooy, Roddy Dewar, Scott Sanner, Richard Jones, Michael Dalvean, Liz Reiger, Otto Wood, Nausica Garcia Pinar, Sabrina Caldwell, Omid, Narjess Azfaly, Ardy Hadad, Brenda Martin, Mum, Dad, Jenny, Ian, Peter, Wendy and Misai.
Abstract
Due to the complex nature of human behaviour and to our inability to directly measure thoughts and feelings, social psychology has long struggled for empirical grounding for its theories and models. Traditional techniques involving groups of people in controlled environments are limited to small numbers and may not be a good analogue for real social interactions in natural settings due to their controlled and artificial nature. Their application as a foundation for simulation of social processes suffers similarly.
The proliferation of online social media offers new opportunities to observe social phenomena “in the wild” that have only just begun to be realised. To date, analysis of social media data has been largely focussed on specific, commer-cially relevant goals (such as sentiment analysis) that are of limited use to social psychology, and the dynamics critical to an understanding of social processes is rarely addressed or even present in collected data.
This thesis addresses such shortfalls by: (i) presenting a novel data collec-tion strategy and system for rich dynamic data from communities operating on Twitter; (ii) a data set encompassing longitudinal dynamic information over two and a half years from the online pro-ana (pro-anorexia) movement; and (iii) two approaches to identifying active social psychological processes in collections of online text and network metadata: an approach linking traditional psychometric studies with topic models and an algorithm combining community detection in user networks with topic models of the social media text they generate, enabling identification of community specific topic usage.
Contents
Acknowledgements vii
Abstract ix
1 Introduction 1
1.1 Overview of Research Contributions . . . 2
1.2 Grounding Simulations of Social Processes . . . 3
1.3 Social Data . . . 4
1.4 Mining Socio-Cultural Signals . . . 4
1.5 Visions and Contributions . . . 6
2 Relevant Literature 9 2.1 Human Behaviour . . . 10
2.1.1 Social Groups and Entities . . . 10
2.1.2 Language and Psychology . . . 12
2.2 Social Media Data . . . 14
2.2.1 Working with Data from Micro Blogs . . . 15
2.2.2 Hash Tag Usage . . . 15
2.2.3 Other Relevant Twitter Studies . . . 16
2.2.4 Online Pro-Ana Commuities . . . 17
2.3 Network Analysis . . . 18
2.3.1 Identifying Communities . . . 18
2.3.2 Twitter Networks . . . 20
2.3.3 Dynamics of Social Networks . . . 21
2.4 Topic Models . . . 22
2.4.1 Latent Dirichlet Allocation . . . 24
2.4.2 Topic Model Evaluation and Diagnostics . . . 27
2.4.3 Data Pre-Processing . . . 37
2.4.4 Topic Model Variants . . . 40
2.5 Summary . . . 46
3 A Data Collection System for Dynamic Twitter Data 49 3.1 Overview . . . 50
3.2 Adaptive Sampling for Search Tags . . . 51
3.3 Collecting Dynamic Twitter Data . . . 54
3.4 Algorithms and Technical Challenges . . . 55
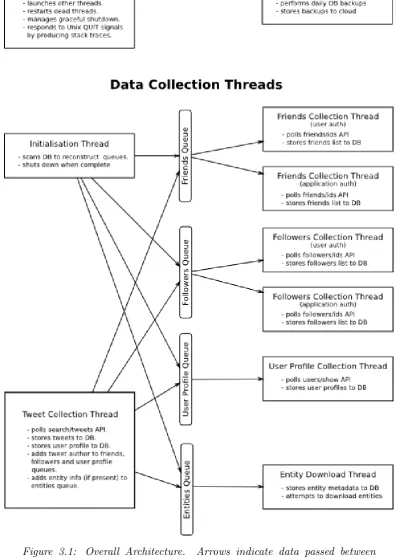
3.4.1 Overall Architecture . . . 55
3.4.2 Polling friend/follower lists — the main bottleneck . . . . 58
3.4.3 Image Collection . . . 59
3.4.4 Other Technical Challenges . . . 59
3.5 Dynamics of Collected Data . . . 60
3.6 Discussion and Future Work . . . 63
3.7 Conclusions . . . 65
4 Preliminary Data Analyses 67 4.1 Overview . . . 67
4.2 Working With Partial Network Data . . . 69
4.3 Follower Link Life Cycles . . . 71
4.4 Network Snapshots . . . 75
4.5 Grounded Analysis of Tweets . . . 78
4.6 Discussion and Future Work . . . 79
4.7 Conclusions . . . 81
5 Topic Models as a Quantitative Tool 83 5.1 Overview . . . 84
5.2 Posterior Predictive Checks . . . 85
5.3 Word Frequencies as Metrics . . . 86
5.4 Identity Salience . . . 87
5.5 Topic Model Regularisation . . . 87
5.6 Data Preparation — Pro-Ana Tweets . . . 88
5.7 Experiments . . . 89
5.7.1 Model Assessment . . . 90
5.7.2 Analysis of Salient Topics . . . 92
5.7.3 Caveats . . . 95
5.8 Discussion and Future Work . . . 97
6 Community Topic Usage 99
6.1 Overview . . . 100
6.2 Document Assignment Model . . . 102
6.2.1 A Conjugate Prior For Dirichlet Distributions . . . 103
6.3 Estimation . . . 104
6.4 Data Set . . . 105
6.5 Metrics of Model Quality . . . 108
6.6 Results . . . 111
6.7 Discussion and Future Work . . . 112
6.8 Conclusions . . . 114
7 Conclusion 117 7.1 Contribution . . . 117
7.2 Further Work . . . 120
7.3 Vision . . . 124
Bibliography 125
A Hash Tag Sampling Summary 145
B Topic Salience Summaries 151
C Grounded Analysis of Tweets 159
Chapter 1
Introduction
This chapter presents an overview of the context of and motivation for this thesis and briefly summarises its core contributions.
The study of how societies operate is at once highly challenging and highly rewarding. Societies are a complex and poorly understood phenomenon. We make decisions and do things collectively. Although sociologists and social psychologists have been studying how collective decision making happens and how it evolves, social processes on large scales of populations and time are still poorly understood. Cultural evolution remains a mystery [Pennebaker and Lay 2002]. It is important to realise the sheer scope of this challenge — the complexity of human social systems, arguably, rivals any other system we study bar cosmology and life itself.
Nonetheless, the modern proliferation of data about the individuals in our societies, the evolving tools and techniques available to examine this data, and the rapid evolution of computer hardware enabling our ability to process it, all show enormous promise in advancing our knowledge. Though there are limitations to this endeavour and the quantity of useful information that can be extracted from large scale social noise is not clear [Ruths and Pfeffer 2014], the opportunities have only begun to be realised and it is apparent that much more can be achieved.
Current research attempting to unravel social phenomena using quantitative methods focusses on agent based computational models that are grounded in the-ories of social phenomena and their dynamics. Due to the difficulty in measuring actual social phenomena, grounding such models in actual groups and societies is done in a very limited way. The core focus of the research described in this thesis is the collection of richly dynamic data specific to particular social groups and the search for methods to identify and measure relevant social processes within that data.
This chapter is organised as follows: Section 1.1 presents an overview of the research contributions presented in this thesis. Section 1.2 reviews the current status of social simulation research, highlighting the need for stronger empirical grounding. Section1.3discusses the breadth and scope of socially generated data that are available today, noting that data used in research typically lacks the rich dynamics and community focus that would be necessary to empirically ground simulations of social processes and introducing the techniques of Chapter 3 as a remedy to the situation. Section 1.4 presents current directions in the analysis of social media data, highlighting the need for analysis focussed on social processes, as would be needed to empirically ground social simulation. Topic models are presented as an avenue to detect those processes and the techniques of Chapters5 and 6 are introduced as initial steps toward their use in that way. Section 1.5 presents a vision and research agenda thus motivated and briefly reviews the contributions of this thesis in that context.
1.1
Overview of Research Contributions
This thesis presents 3 main research contributions. Firstly, in Chapters 3 an approach to identifying a specific community operating over social media is de-veloped, and system for collecting richly dynamic data from such a community operating on Twitter is presented. This approach and system are used to collect data from a community of people experiencing eating disorders (the Twitter “pro-ana” community — see Section 3.2) over a period of nearly 3 years. Chapter 4 provides an overview and some initial analyses of the collected data.
The second contribution, developed in Chapter 5, is an approach to linking topic models of text data connected with a particular community to traditional psychological studies where standard Likert scale questionnaires are used in com-bination with carefully orchestrated free text responses from survey subjects. Using such an approach, results of such realtively small scale, detailed studies can be applied in much larger collections of community communications.
as social norms and identities (see Section 2.1 for a discussion of such entities). These contributions are discussed in more detail in Chapter 7 along with a discussion of how these contributions can be applied in future sociological and social psychological research.
1.2
Grounding Simulations of Social Processes
Empirical grounding is a substantial challenge to research in social simulation. Psychologists have been studying people’s behaviour for many years, both in groups and as individuals, but this has largely been done in a laboratory setting or through surveys and questionnaires. People’s behaviour in real social contexts is thought to differ from how they behave in a laboratory and how they project themselves in questionnaire responses1. Sociologists and economists have also studied social behaviour for a long time, however their research has been either qualitative in nature or involving only collective statistics, without fine-grained measurements of individual behaviours and qualities. Until recently, measuring people’s social behaviour “in situ” on a significant scale has been impossible. Such a task is the central challenge of modern social simulation.
Although the findings of social psychology, sociology, and economics provide internal structure for social simulation models, and although aggregate features and statistics can often be measured, providing some level of validation, direct grounding of modelled qualities of individuals and their communications is diffi-cult and remains largely elusive [Windrum et al. 2007]. Data collected on individ-uals for grounding agent based models typically consist of inferred statistics from surveys of small sets of people randomly sampled from a larger population [Has-san et al. 2008], however such data lacks information on the fine dynamics of social interactions and detailed social structures. Social systems are inherently very complex, with a large number of diverse interacting processes. Without em-pirical data at least approaching the dimensionality and complexity of modelled systems, there is a great danger of overfitting (where the models fit the data, but do not generalise) and of missing important factors and processes.
Data collected from online social media promises new opportunities for empir-ically grounding agent based social models. Though some work in this direction exists (e.g.: [Garcia and Schweitzer 2011;Wise 2014]), to the best of my knowledge the direct measurement of social constructs that drive collective decision making
has not been investigated. Such identification is one of the core motivational goals of this thesis.
1.3
Social Data
The emergence and large scale uptake of online social media has opened enor-mous opportunities for the study of society and social processes. Combined with new machine learning and data mining techniques (in particular text analysis) the opportunities are great. This is particularly noticeable when one considers the apparent near ubiquitous uptake of social media by young people [Jones 2013; Go-Globe 2013] — there is good reason to believe that the rapid growth in so-cial media usage will continue and that the already notable proportion of soso-cial interaction occurring on-line will only increase in years to come.
Analysis of social media data has received attention in the study of sociology and psychology. For the greater part, however, methods applied largely involved aggregate statistics and in-depth subjective analyses (see Section 2.2). Attempts to identify psychologically relevant patterns attributable to individuals require more sophisticated tools.
Recent research into data mining and machine learning has developed tools that hold some promise to achieve this (see Sections 2.3 and 2.4). A great deal of this research has, in fact, been directed at social media data, however it has been largely focussed on direct commercial applications such as sentiment and emotion analysis (Section 2.1.2) and has been largely naive in its modelling and investigation of psychological processes. Data sets for this research typically contain limited dynamic information (e.g.: data collected over a very short period of time) and are typically either generic and community wide or focussed by particular commercial aims, rather than focussed on particular social groups. Chapter3provides a remedy to this situation, presenting a methodology to target particular social groups, an approach and system to collect richly dynamic data from the targeted group and a substantial data set retrieved from the anorexia and eating disorder community operating on Twitter.
1.4
Mining Socio-Cultural Signals
learning. A swathe of techniques have been developed to efficiently extract oth-erwise hidden patterns and information from large data sets. Text mining, the identification of patterns and extraction of information from large collections of text, is one area of application of these techniques that has been widely used.
There has been much research done on mining aspects of the ‘meaning’ of texts in the fields of computational linguistics and natural language processing. Bayesian graphical model approaches have been successful in this area [O’Connor et al. 2013]. What I attempt here has a rather different, though related, goal: I aim to detect actions and objects related to social processes. Many of these techniques draw on the distributional hypothesis of how we learn, perceive and communicate meaning [McDonald and Ramscar 2001], where meaning and ex-periential context are inextricably linked. By this hypothesis, the meaning of a portion of text can be identified, at least in part, by its lexical context within that text.
In this thesis I further draw on social representation theory from the field of social psychology [Billig 1991;Bauer and Gaskell 1999;Sammut et al. 2015] which posits the existence and importance of socially generated and propagated entities (representations) to the study of human social behaviour. Combining these ideas with the distributional hypothesis, one is drawn to the idea that social entities such as group norms and identities can also be identified by lexical contexts in text communications. Given that intra-group communication contains indications of shared socio-linguistic entities (such as norms, identities, conventions etc.) and given that the distributional hypothesis holds for cognition of those entities, one would expect those entities to be associated with particular lexical contexts, that is, loosely speaking, collections of words and phrases that co-occur.
Topic modelling (see Section 2.4) is a prominent approach for unravelling the semantics (meanings) expressed in collections of texts. In essence, topic models identify linguistic contexts whose semantics can then be interpreted by the words with substantial representation within those contexts. Topic models are a widely used and rapidly evolving set of data mining tools, finding many applications around document classification, search, and summarising key content in collec-tions of text documents. The ability of topic models to uncover contextualised patterns in text collections presents itself as a real possibility for identifying and measuring social entities. This is especially true if a community uses social media as its primary communication medium as may be the case for the anorexia and eating disorder community operating on Twitter (see Section 2.2.4).
with topic models in order to infer psychological characteristics of the authors of a collection of texts. As an example, results of a recent study of identity salience in young women is combined with a topic model of Twitter eating disorder and pro-anorexia data, demonstrating the ability of topic models to identify linguistic contexts of psychological relevance.
In order to study the dynamics of social groups and the symbols and beliefs they entail, it is important to identify the members of those groups. Social media network data sets can be expected to represent many overlapping and interwo-ven social groups, and much work has been done to identify those groups from network characteristics. Chapter 6 presents an approach to combine detected groups in a network of social media contributors with topic models from the social media texts that those contributors create, attributing detected topics to groups. The presented approach works well with large data sets due to the sub-stantial dimensionality reduction provided by the network detection algorithm and topic model. It is applied to a snapshot of the collected eating disorder and pro-anorexia Twitter data, revealing very distinct group topic usage.
1.5
Visions and Contributions
This research works from the larger vision of empirically grounded models of social processes capable of tracking and potentially predicting the evolution of social constructs that lead to collective decisions in our societies. Such models would enable research into social psychology and sociology in unprecedented ways and have the potential to provide deeper understandings of how our societies make decisions and function in general.
The sheer scope of this endeavour cannot be understated. Groups and societies are enormously complex entities and many of the relevant processes needed to understand them occur within peoples’ minds, a place into which we have no window. This vision is grand, and it remains to be seen to what extent it can be achieved. Nonetheless, new data sources from online social media (among others) show some potential for a beginning of such grounding.
Chapter 2
Relevant Literature
In this chapter I review the literature on research efforts related to the contribu-tions in this thesis. There are four areas that I review:
Section 2.1 reviews relevant research into human behaviour. This includes several aspects drawn from both the social psychology and sociology literature. Section 2.1.1 looks into the study of social groups and the role played by social entities such as norms and identities. Section 2.1.2 looks into the study of psy-chology as expressed in text — that is, the links between the psypsy-chology of an author and the text they produce.
Section2.2reviews various areas of relevant research using data collected from online social media. Section 2.2.1 outlines some of the difficulties and caveats when working with social media data. Section 2.2.2 looks at research into hash tag usage, noting in particular its role as a group meeting place. Section 2.2.3 mentions two studies of Twitter data of particular interest, one measuring stress levels of authors and the other using Twitter data to ground an agent based model. Section 2.2.4 briefly reviews work into online pro-anorexia and eating disorder communities.
Section 2.3 reviews relevant literature around the analysis of networks. Sec-tion 2.3.1 looks at research into community detection in networks. Section 2.3.3 briefly reviews work on the dynamics of social networks.
Section 2.4 presents a substantial review into Bayesian topic models. Sec-tion 2.4.1 introduces Latent Dirichlet Allocation (LDA), perhaps the most fa-mous and first Bayesian topic model. Section 2.4.2 describes approaches and literature around topic model evaluation and diagnostics. Section 2.4.3 reviews data pre-processing approaches used in practical applications of topic models. Section 2.4.4 presents a non-exhaustive but lengthy summary of some variants
and extensions to LDA.
2.1
Human Behaviour
This section looks into human behaviour research relevant to this thesis. This in-cludes group structure and function (Section2.1.1), and research around methods for identifying and measuring psychological features in text (Section 2.1.2).
2.1.1
Social Groups and Entities
Humans are social animals. Forming, interacting with and acting in groups is a fundamental part of human behaviour. When we operate as part of a group, we naturally form and adhere to social norms (rules of conduct), identities (what it means to be part of a group) and other socially constructed and transmitted entities (such as values and beliefs).
Social Representation Theory: In the study of social psychology, the theory that pertains most closely to the existence and nature of such entities is Social Representation Theory [Billig 1991;Bauer and Gaskell 1999;Sammut et al. 2015]. This theory has not received a great deal of attention in social psychology research since its advent in the 1990s, but many have argued that it is a necessary part of a complete theory of social psychology, as it is capable of considering culture and ideology, which are essentially impossible to study with traditional laboratory studies [Nafstad and Blakar 2012].
In social representation theory, socially constructed and transmitted represen-tations exist as shared conceptualisations. Sammut et al. [Sammut et al. 2015] present . . .
Such representations form a common context for social interactions and are often strongly connected to ones sense of self as well as defining and operational-ising social groups. Examples include social norms, shared ideals, rituals (both formal and informal) that provide a sense of belonging to a social or cultural group and many more. The social entities referred to in this thesis equate to such representations. Those that can be measured in online social media pertain mostly to communication, though habitual behaviour may also leave a mark on a person’s interaction with online social media.
Of further relevance here is the distributional hypothesis [Harris 1954; Firth 1957; McDonald and Ramscar 2001] which posits that meaning as perceived by humans is created and defined by cognitive context — we learn the meanings of things through observations/exposure to manifestations of those things in some cognitive context, and hence those meanings are inextricably connected to the contexts in which the concepts are encountered. This supports the idea that socially generated and propagated entities in communities that communicate via online social media can be recognisable as frequent lexical contexts, especially when interaction within a group occurs mostly online.1
It is interesting to note that in the case of highly abstract concepts, the manifestations may consist of the contexts alone without specific concrete markers (such as particular words or objects). This means that social entities that are highly abstract may still be identifiable and measurable among social media texts, even in the absence of specific words or phrases that define them.
Frames: A related concept to the social entities discussed above are “frames” [Fillmore 1976; Fillmore 1982]. Widely used in the field of sociology2, a frame is a stance or perspective, usually with associated language constructs, that is used by and defines a social group. A frame fulfils a role both as a social identity (I am a group member and valuable because I believe in this frame) and as conforming behaviour (those who express our frame are with us). A frame can be seen as a particular type of social entity or representation, typically with a concrete manifestation and strong connection to a social identity.
One recent study of particular interest here posited that the “Topics” in topic models (see Section 2.4) could be used as proxies for “frames” [DiMaggio et al.
1Note that in natural language processing, the distributional hypothesis is typically applied
to interpret the meaning of words from their lexical contexts — here we seek the meaning of contexts in a broader sense, with possibly multiple lexical expressions.
2As of October 2015, Google scholar counted 744 and 2023 citations of Fillmore’s 1976 and
2013]. This is similar to the supposition that topic model topics can represent social entities and can act as a tool for their identification and measurement. Though this study implicitly associated frames with topic model topics, draw-ing on the conceptual similarity between them, the authors nonetheless draw interesting conclusions that agreed with perceived shifts in thought and culture surrounding the studies target themes (US government arts funding).
Dunbar’s Number: Though not directly linked to the primary research agenda here, observations of collected data are suggestive that Dunbar’s number may be playing a role, prompting a potential avenue for future research (see Section 4.1, second paragraph).
Based on studies of the size of the neocortex in primate brains, Robin Dun-bar, in the early 1990’s, recognised a link between the size of the neocortex in primate brains and the maximum size of social groups [Dunbar 1992]. Extrapo-lating this to humans, he suggested that for humans, the maximum size of social groups is about 150 (with 95% confidence interval from 100 to 230) [Dunbar 1993] and presented numerous examples of human social organisation that fall within these bounds. That study also hypothesised that language evolved primarily as an efficient method of social bonding that enabled larger group sizes than pri-mates, for whom social grooming is the primary method. Many more recent studies have verified this range including groups in social media and specifically Twitter [Gon¸calves et al. 2011;Dunbar et al. 2015].
Another line of enquiry into the size of social groups that pre-dated Dunbar’s work looked at the number of acquaintances individuals have with people from a set of non-social minority groups (such as people whose name is Christopher or diabetes sufferers). They found a remarkably consistent pattern following a skewed distribution with a mean of about 291 (median 235) [Killworth et al. 1984; McCarty et al. 2001]. The mode of this distribution is close to 150. Adding fur-ther granularity to these numbers, several recent studies have found relationships between the size of parts of the brain and social network size [Dunbar 2012].
2.1.2
Language and Psychology
analysis can provide indirect measures of demographic variables (social status, age, sex), but also social motives (coercion, deception). It can can inform us whether an author is emotionally involved instead of detached, and even allows to infer a number of clinically important psychological traits (such as extraversion and neuroticism).
Analysis of text to find clues to the psychology of the person who wrote or said the words has a rich history. Many studies have been done that correlate the use of certain types of words or language forms with aspects of personality and a person’s psychology. Several tools for automated analysis of texts have been created based on the results of these studies and our understanding of human psychology. As a rule, these tools rely on the frequency with which certain carefully selected classes of words are used in the text, though some structural statistics are also used. The most important tools are listed below:
LIWC — Linguistic Inquiry with Word Count Linguistic Inquiry with Word Count [Tausczik and Pennebaker 2010a] is one such tool that has been particularly widely used. Its approach is very simple: it calculates the frequencies of 77 classes of words and punctuation and 3 structural statistics in each text. These frequencies and statistics are known to correlate with certain aspects of a person’s psychology and state of mind.
LIWC includes 32 word categories that indicate psychological processes (e.g.: af-fect, such as positive and negative emotions; social, such as family and friends; cognitive such as insight and causation), 22 that indicate linguistic processes (e.g.: adverbs; negations; swear words), 7 personal concern categories (e.g.: home; religion; work; leisure) and 3 paralinguistic dimensions (fillers; assents; nonfluen-cies) [Skowron et al. 2011].
PYM Norms — Paivio, Yuille and Madigan Another important tool is commonly referred to as the PYM norms, named after the original authors: Paivio, Yuille and Madigan [Paivio et al. 1968] and later extended by Clark and Paivio [Clark and Paivio 2004]. These norms grew from the theory of cog-nitive psychology. A large number of words (2311) are rated as indicators of various cognitive processes such as imagery, concreteness, meaningfulness, and familiarity.
patients rate a series of statements about mood on how well they describe their feelings. Many of these statements are single words. Bollen et al [Bollen et al. 2011] adapted and extended POMS-bi norms for large scale text analysis with the aid of Google N-grams data.
Sentiment and Emotion Analysis There has been a recent surge of interest in the machine learning research community to identify peoples’ attitudes toward particular entities. Driven by a business need to measure consumer sentiment, a wide range of tools and approaches have been developed for measuring sentiment in (mostly online) text. These approaches typically use keywords to locate refer-ences to the item of interest (eg: “google” or “apple” or a book/movie title) then attempt to asses the sentiment of the surrounding text on a positive/negative scale. The sentiment scale could be discrete (eg: the values {-1,0,1}) or contin-uous (eg: a real number in the interval [-1, 1]). The sentiment scale is typically one dimensional, however there are situations when a person may experience both positive and negative sentiment at the same time, and some approaches use two separate scales, allowing for this possibility (e.g.: [Thelwall et al. 2012]).
Another related area that is gaining interest is affective computing — the detection of human affect (emotion) in text or other media such as voice or video. This has had particular success with voice and video media, however detection of emotion in text has received less attention, in part due to difficulties in providing a ground truth (as human emotion annotations often show poor inter-annotator correlation [Mohammad and Alm 2015]). Using user generated annotations in the form of hash tags on Twitter is a promising approach to improve this situation [Mohammad and Kiritchenko 2015]. A similar approach was effective at identifying author sentiment utilising hash tags and text smileys in twitter data [Davidov et al. 2010].
Though of some relevance, sentiment and emotion analysis measure psycho-logical states, they do not have direct application to the contribution presented in this thesis, which is focussed on the detection of social psychological entities through topic models. In future work investigating candidate detected entities, emotion and sentiment analysis may however play a role.
2.2
Social Media Data
in an unobtrusive way. The quantity of data available is somewhat daunting. For example, a blog and social media dataset from a one month period in 2011, used in the ICWSM 2011 Data Challenge, amounted to some 3 TB (3000 GB) of text [K. Burton et al. 2011]. Analysis of such large corpora of texts requires clever automated techniques and perhaps a dash of high performance computing.
2.2.1
Working with Data from Micro Blogs
Data from Twitter and other micro-blogs present specific challenges. Due to the restrictions on the length of tweets and the cumbersome nature of typing, language usage is often abbreviated [Eisenstein 2013], often breaking grammar rules and using community specific abbreviations, smileys, text art and other creative forms. The fact that texts have few words/tokens also poses difficulties, with one study suggesting that aggregating tweets can improve analyses [Hong and Davison 2010].
One important factor to keep in mind when data mining social media data is self selection bias: users of different social media platforms and different groups of people who use those platforms come from specific subgroups of the society at large, and comments made on social media platforms are filtered by a person’s particular desire to communicate. It is important to consider these biases when attempting to draw conclusions beyond the literal scope of the set of users whose data is in your study and the specific social context that it represents [Ruths and Pfeffer 2014].
2.2.2
Hash Tag Usage
Hash tags are widely used in social media platforms as a means to add a “tag” to the text they are producing. Typically, a hash tag is simply a hash symbol “#” preceding a word, for example #happy. It can be said that the initial intention of hash tags was as a means of categorising and identifying types of content and its semantics. This is certainly true for social bookmarking sites such as Delicious3. Users of Twitter, Tumblr and similar micro-blogging sites have created other uses for hash tags. For example, tags such as #fail convey a judgement about something, #meh conveys a sense of boredom in response to something and #happy conveys an emotion. Their most typical role is still to convey thematic information about the content of the tweet, but emphasis, emotion and many
other expressions are commonplace, limited only by the creativity of the Twitter community.
Of particular interest here is the use of hash tags as a virtual meeting place and to address and define a particular community [Java et al. 2007; Huberman et al. 2008; Paul and Dredze 2011; Bruns and Burgess 2011; Himelboim 2014]. This, and the observation that people tweeting on “#pro-ana” and related tags appear to form such a community, are key to the data collection methodologies presented in Chapter 3.
The advent of group chats on Twitter has been noted in recent years [Cook et al. 2013; Budak and Agrawal 2013]. Group chats are groups of Twitter users that meet at specific times and hash tags on a regular basis. Many such chats are deliberately organised by institutions such as in education [Budak and Agrawal 2013] and depression/mood disorder support groups, but there is also a growing number of relatively spontaneous chats organised primarily by a passionate in-terest such as movies or skiing [Cook et al. 2013]. This is a refined version of the use of hash tags to define a community, and coordinated meetings between individuals and sub-groups will likely spontaneously occur within communities organised around hash tags.
There has been much research applying topic models to Twitter data. The extra meaning attached to hash tags has been used in some studies to improve topic models of tweet collections in several ways. Perhaps the simplest is to pool tweets by hash tag, which has been found to perform well for document clustering tasks and to improve topic coherence [Hong and Davison 2010; Mehrotra et al. 2013]. In other approaches, hash tags are used as labels in a supervised topic model [Ramage et al. 2010] and incorporated into the generative model [Lim et al. 2013]. Both approaches showed improvements in an author recommendation task. Where Ramage et al. focussed on characterisation of tweets according to substance, status, style and social dimensions, Lim et al. showed how their model could be used for automatic topic labelling and demonstrated improvements in clustering tasks and topic coherence.
2.2.3
Other Relevant Twitter Studies
were used as a ground truth. The accuracy of these hash tags for identifying stress was verified by human annotation. Their system achieved good predictions of physiological and “other” stress (F1-measures4 of 0.71 and 0.81 respectively) but performed poorly on affection, work and social stresses (F1-measures of 0.34, 0.54 and 0.50). Unstressed posts were detected very well (F1-measure of 0.999). Lin et al. tested support vector machines and three neural network models, with all performing similarly. An important take-home message from this work is the value of multi-modal analysis, and in particular including features extracted from images, for detecting psychological states.
2.2.4
Online Pro-Ana Commuities
In this section I briefly outline research and media commentary on the online pro-anorexia movement and explain reasons why this community is of particular interest for studying social processes in an online setting.
The online “pro-ana” (pro-anorexia) movement has received much attention in the study of clinical psychology (e.g.: [Homewood and Melkonian 2015;Sheldon et al. 2015; Yeshua-Katz and Martins 2013; Casilli et al. 2012]) and in popular media (e.g.: [McColl 2013; Times ; Tribune ; Reaves 2001]). The movement has received criticism on the grounds that it encourages eating disorders [Rouleau and von Ranson 2011; Jett et al. 2010; Cohen 2007] and acclaim on the grounds that it provides social support for an otherwise stigmatised condition [Yeshua-Katz and Martins 2013; Dias 2013; Csipke and Horne 2007]. Media depiction of unreasonably thin women and general support of the “thin ideal” have been cited as a potential factor leading to the increase in eating disorder diagnoses [Derenne and Beresin 2006].
As can be seen, there is an ongoing debate about the role of the online (and in particular social media) pro-anorexia movement. Though beyond the scope of this thesis, the collected data described in Chapters 3 and 4 as well as the methodologies developed in later chapters provide opportunities for answering some of the questions in that debate.
Of further relevance to this work is the social stigma attached to eating dis-orders such as anorexia in the wider society [Yeshua-Katz and Martins 2013]. Such stigma suggests that people with these conditions will be discouraged from
4The F1-measure of a predictor of a particular class or labelling is the harmonic mean of
communication about their condition within their immediate, physical, commu-nity. An anonymous venue such as online social media provides an environment relatively safe from that stigma, thus it may be expected that social media com-munities formed around eating disorders such as anorexia have very little offline communication. This means that a full picture of the group-wide communications of such communities can be obtained.
A couple of other studies are worth mentioning here: A grounded analysis of themes of communication in social media eating disorder communities has been undertaken [Juarascio et al. 2010]; A comparison of language usage between pro-anorexics and recovering pro-anorexics was performed, identifying differences in self-presentation [Lyons et al. 2006]; Analysis of pro-anorexia social media usage have been proposed for building qualitatively-informed agent-based models [Tubaro and Casilli 2010].
2.3
Network Analysis
In many areas of science, the study of network structures and properties can yield useful and profound results, and this is particularly true of the study of so-cial networks, where a substantial literature has been developed [Scott 2012]. In the course of studying complex systems, networks are typically an effective way of representing relational data. Examples can be found among social systems (friend and acquaintance networks), ecological systems (food webs), biochemi-cal systems, technologibiochemi-cal systems (e.g.: power networks, the internet), logistic systems, communication systems and the list goes on. Networks of interest are often very large, with thousands or millions of nodes and millions or billions of edges (links between nodes). Typically there is extra meta-data associated with network nodes or edges [Fortunato et al. 2013]. Extracting useful information and insights from such data is an important and non-trivial task.
2.3.1
Identifying Communities
Much work on community detection in networks has used a model where communities are disjoint, so that no community overlap is possible [Fortunato 2010]. Here the problem is posed as finding a partition of the network, where each partition is considered a community. A range approaches to this formulation exist with a corresponding rich literature [Tang and Liu 2010]. Let us consider an undirected network (or equivalently “graph”) consisting of a collection of “nodes”5 and the “edges” that connect them6. For example, individual Twitter users could be the nodes, and mutual Twitter follower relations the edges.
One approach to non-overlapping community detection of note, and which has been widely used in the research literature, is often referred to as “modularity clustering”. This approach considers the difference between the number of edges connecting pairs of network nodes and the expected number of edges given the degree distribution. This quantity, summed over node pairs within a group of nodes is known as the groups “modularity”. If m is the total number of edges,
di is the degree of node i (the number of edges connected to node i), Aij is the
network’s adjacency matrix (Aij = 1 if there is an edge between nodesi and j, 0
otherwise) and C a collection of nodes, the modularityQC of C can be written:
Qc=
1 2m
X
i,j∈C;i6=j
(Aij −didj/2m) (2.1)
Modularity can be either positive or negative, with positive values indicat-ing the possible presence of community structure. Modularity clusterindicat-ing seeks to partition the network such that the sum of the partition modularities is max-imised [Newman 2006].
A second approach of note draws on an information theoretic view of the prob-lem, seeking to optimise the information about the original network contained in the cluster representation [Rosvall and Bergstrom 2007]. This approach was found to perform as well as modularity clustering on evenly distributed clusters, but outperformed modularity clustering (and other approaches) on data where the community structure in the network was uneven, with some small and some large communities.
In many cases, and, in particular, with social networks, communities can be expected to overlap, and recently a substantial body of work has been devoted
5The term “vertex” is often used also.
6For simplicity, we consider only undirected unweighed edges and only one possible edge
to overlapping community detection [Xie et al. 2013]. Of particular note is the mixed membership stochastic block model [Airoldi et al. 2009], a Bayesian model for overlapping community detection, and the efficient inference algorithm for this model developed in [Gopalan and Blei 2013]. This model and inference technique can be said to be state of the art, showing notable improvements on various standard data sets and being applicable to massive networks in reasonable time.
2.3.2
Twitter Networks
Network metrics of Twitter data have revealed varying and quite different charac-teristics. For example, a study of early Twitter data (2009) from Singapore found 72% reciprocity (friend links that “follow back”) [Weng et al. 2010] whereas an-other 2009 study that obtained a nearly complete snapshot of the Twitter network found on average only 10% reciprocity [Cha et al. 2010].
Kwak et al. [Kwak et al. 2010] attempted to crawl the entire Twitter follower graph. They collected user profiles by snowball sampling [Biernacki and Wal-dorf 1981] from famous blogger Perez Hilton7 also adding users who mentioned trending topics8 during the period of data collection (approximately one month), claiming to have crawled “the entire Twitter-sphere” — not an entirely unrea-sonable assertion, since any Twitter account they missed can be said to not have contributed to public discourse through either mentioning popular topics or con-nections in the follower network. They present a number of general statistics on the friend/follower network and other user, tweet and network characteristics. Of particular note are their findings that a user’s retweet count does not correlate with the number of followers nor PageRank [Page et al. 1999] in the follower net-work; there is a non-power-law follower distribution, short effective diameter, and low reciprocity in the follower network. All of these are unexpected in the light of known characteristics of human social networks [Newman and Park 2003].
Huberman et al. [Huberman et al. 2008] investigated the relation between the Twitter follower network and the mention network. When one posts a tweet, it is possible to include another user’s user name preceded by an “@” symbol, in which case the other user is alerted to the tweet. This is known as “mentioning” and was taken as a closer indication of true social networks than the follower network. They found that real social networks (approximated by the mention network) are
7Perez Hilton had over a million followers at the time of the study.
8Trending topics are hash tags, keywords and phrases identified by Twitter as “trending”,
subgraphs of the follower network. In another example, [Jurgens 2013] found that the location of nearby users in the mention network to be useful in inferring the location of users for which no direct location information is available.
Retweets, when a twitter user reproduces a tweet verbatim (possibly with some small addition of their own) provide another opportunity to extract a user network from a collection of tweets. A retweet network is typically thought of as a network of information flows. A number of studies have utilised retweet networks. For example in [Conover et al. 2011], community structures in a retweet network were found to be good predictors of political alignment.
Several other Twitter studies described in the following section (Section2.3.3) looked at aspects of network dynamics.
2.3.3
Dynamics of Social Networks
Social network dynamics has been established as playing an important role in coordinated action. In a controlled study by Rand et al. [Rand et al. 2011], people preferentially added social ties to cooperative people, and broke them with uncooperative people. A substantial body of work exists on link prediction in networks (social or otherwise) [L¨u and Zhou 2011; Wang et al. 2014]. Almost all of this work focusses on the prediction of new future links or missing links, with no attention given to predicting the dissolution of links or presence of spurious links [Wang et al. 2014], though two recent studies defy this pattern.
Kwak et.al. [Kwak et al. 2011] studied “unfollow” behaviour of 1.2 million Korean speaking Twitter users. They took daily snapshots of the user’s friend lists and attempted to identify factors leading to unfollow events — when a user has been following another users tweets, but decides to no longer follow them. Factors that were found to be significant were reciprocity in follow relationships (users unfollowed users who did not follow them), the duration of the relationship (users unfriended users they had not been following for long), the followee’s infor-mativeness (if a user has retweeted or favorited followee’s tweets) and overlap of the user and followee’s friend and follow lists. They also conducted a survey of 22 Twitter users to determine their motivations for unfollowing, identifying frequent tweeters, tweeters of uninteresting topics and tweeters of mundane details of their lives to be significant motivators.
knitted groups they found that relational properties such as mutual following and followers in common reduce the likelihood of unfollowing. They found that unfollowing tends to be reciprocal — if someone unfollows you, you are more likely to unfollow them in return. They found no evidence that common interests and informativeness of interactions impacted unfollow behaviour. Their work suggests that there may be many diverse types of Twitter user groups where the impact of relational and informational factors may differ.
2.4
Topic Models
Much of the content in this Section appears in my publication [Wood 2013], though greatly expanded here. Some concepts here are used later, but others go beyond the scope of the thesis but are considered here for completeness and as a context for future work.
In the context of the ideas presented in this thesis, topic models serve as a candidate for the detection and quantification of social constructs relevant to the dynamics of social processes (see Chapter 5).
Probabilistic topic models originated from the search for automated tech-niques to identify the semantic content of texts without any pre-conceived notion of what the semantic content may be. The intuition is that texts covering similar themes will tend to use similar vocabulary — one expects, therefore, that counts of individual words in such texts will be strongly correlated, and it is these cor-relations that are of interest. Another perspective on this task is that of finding a low dimensional representation (topics) of high dimensional data (very many different words) that maintains the characteristics of interest (the semantics).
Many methods proposed to date for finding text semantics use a “bag of words” model to represent texts: a list of word counts. A text is typically repre-sented as a vector of word counts. The resultant vectors have very high dimension (the size of the vocabulary of the corpus under consideration). Simply calculat-ing the correlation matrix for such data is infeasible as the computational and memory overheads would be enormous and there would be many more parame-ters than data, rendering the result meaningless. Topic models were developed to overcome these limitations and provide meaningful and tractable summaries of text corpora.
vocabulary) which are non-negative and add up to one. In probabilistic models, such topics are taken to represent multinomial distributions over words. Such models typically provide a list of topic proportions for each document in the corpus, taken as a multinomial over topics in probabilistic settings. The idea is that a combination of a documents topic proportions and the word proportions of those topics should approximate the actual word counts in the document. The exact process by which that combination is made depends on the model in question.
Latent Semantic Indexing (LSI) [Deerwester et al. 1990], also known as Latent Semantic Analysis (LSA), was an early attempt at a topic model. It used singular value decomposition (SVD) on the matrix of document word count vectors. In essence, this decomposition reveals a number of topics (lists of word proportions — these are the left singular values) equal to the rank of the document-word matrix and associates a “strength” with each topic (the singular value itself). Typically only the strongest 300 or so topics are used, depending on the cor-pus [Bradford 2008]. In the literature, these topics are often referred to as “latent semantic spaces”.
2.4.1
Latent Dirichlet Allocation
Latent Dirichlet Allocation (LDA) [Pritchard et al. 2000; Blei et al. 2003]9 uses a similar model to PLSI, but applies Bayesian inference. Dirichlet priors (con-jugate to multinomials) are used, which greatly simplifies the structure of the posterior and, thus, inference procedures. Gibbs sampling [Griffiths and Steyvers 2004] or variational methods [Blei et al. 2003] are typically used to estimate the posterior. More recently, an approach using statistical recovery has been devel-oped that is orders of magnitude faster, making a relatively simple separability assumption [Arora et al. 2012]. These Bayesian methods produce models that generalise far better than previous maximum-likelihood approaches.
One way to envisage LDA is to imagine solving a puzzle. You start with many jars (documents) containing coloured marbles (words) and a collection of bags (topics). You need to distribute the marbles into the bags, trying to ensure that each bag contains mostly marbles of only a few colours. There is another restriction, however: you need also to make sure that each jar has most of its marbles in only a few bags. Usually this problem has no good solution — if you satisfy one requirement, the other doesn’t do very well. If, however, some of the documents (jars) cover the same semantic topic (which we represent by a small set of colours/word types), you can put all the words (marbles) characteristic of that literal topic into the one bag. Those documents (jars) then look “pretty good”. Similarly, if several semantic topics are referred to in a document, you can put most of that document’s words into bags representing those topics and do “pretty well”.
There is a tension here between the two requirements — a reluctance to have marbles of more than a few colours in a bag and a desire to put most of a document’s marbles into only a few bags. The balance between these is governed by two parameters of the LDA model, typically labelled α (less topics for a document) and β (less words for a topic). The third parameter for LDA is the number of topics.
LDA uses Bayesian inference — that is, it proposes a parametrised generative model for the texts and then seeks the most probable parameter set given the text under investigation10. In order to make this inference, a ‘prior’ distribution over
9The same model was invented independently in the fields of population genetics [Pritchard
et al. 2000] and text analysis [Blei et al. 2003]. Both papers have been highly influential, with 12369 and 9056 citations respectively (Google Scholar Aug. 2014)
10True Bayesian inference seeks the full probability distribution over model parameters,
possible parameter values is provided. These inferred parameters are typically referred to as the model’s latent variables or hidden variables, whereas the term parameters typically refers to some parametrisation of the prior distribution.
Given data D, latent variables Θ and prior P(Θ), by Bayes rule we have:
P(Θ|D) = P(D|Θ)P(Θ)
P(D) (2.2)
We seek values for Θ that maximise P(Θ|D). Since P(D) does not vary with Θ,
P(D) can be seen as a normalisation constant and does not need to be calculated.
The generative model proposed by LDA consists of a fixed number, T, of topics, each represented as a multinomial distribution over words, and a multi-nomial distribution over topics assigned to each document. Implicit here is a corpus structure that has a fixed number, D, of documents and a fixed length,
Nd, for each document d. Each word-position in each document is then filled
by first choosing a topic from the containing document’s topic distribution, then choosing a word from that topic’s word distribution.
[image:39.595.327.518.559.659.2]The prior used for for the word-topic and topic-document multinomials is the Dirichlet distribution. This is a natural choice as it is conjugate to the multi-nomial distribution — the posterior distributions are also Dirichlet, greatly sim-plifying posterior estimation. With appropriate parameter settings, the Dirichlet priors also encourage sparsity — probability is concentrated around multinomials with most of their entries near zero. This is almost always desired for the topic-word distributions (topics with few topic-words), but for the document-topic distribu-tions it is sometimes natural to encourage topic diversity (where each document contains a broad mixture of topics).
Figure 2.1: LDA Plate Diagram This process is often represented
with a plate diagram such as Fig-ure 2.1. In the diagram, boxes rep-resents collections of documents — K
topics, M documents and N words (ideally, N would be subscripted as it varies between documents, but this is usually omitted). Circles represent in-dividual entities: α and β are
param-eters for the Dirichlet priors, θ the topic mixture for a document, φ a topic, Z
a topic chosen from θ and W a word chosen from Z. W is grey, indicating that it is an observed variable (the only one in this model). Similar plate diagrams are often used to describe the model intra-dependencies of LDA variants and adaptations.
Estimation
As with most Bayesian models of modest complexity, direct calculation of maxi-mum a posteori (MAP) values forθandφis not feasible. Instead one must employ a method that estimates these values. As noted earlier in this section, most of the literature employs either Gibbs sampling [Griffiths and Steyvers 2004] or varia-tional methods [Blei et al. 2003]. Below I describe in somewhat more detail the Gibbs sampling approach.
Gibbs sampling is a method for estimating multivariate probability distri-butions that originated in statistical physics [Geman and Geman 1984]. It is a Markov chain Monte-Carlo (MCMC) method, meaning it produces a series of values that constitute a Markov chain whose stationary distribution is the probability distribution being sought. After a “burn-in” period during which the Markov chain settles down to a close approximation to its stationary distribution, the values can be taken as good estimates for samples from the target distribu-tion. Gibbs sampling achieves this by sampling from each of the model’s latent variables in turn, keeping the others fixed. A collapsed Gibbs sampler, as used in LDA estimation, first integrates out some of the models variables. For LDA estimation, θ and φ are integrated out, thus we need only sample word topic allocations z.
The full derivation of the Gibbs sampling update equations for LDA utilises relatively standard mathematical techniques which I do not present here. The resulting update equations are as follows. Write j for a particular topic index, vocabulary size W, T topics and nd
j, nwj the counts of words assigned to topic j
in document d or word w respectively. The −i, j subscripts indicate that word
i of the corpus is left out of the count. A ‘·’ in place of a super- or sub-script indicate a sum over that index (from [Griffiths and Steyvers 2004]).
P(zi =j|z−i,w)∝
nwi
−i,j +β
n·
−i,j+W β
ndi
−i,j+α
ndi−i,·+T α (2.3)
second numerator is fixed and we can simplify thus:
P(zi =j|z−i,w)∝
nwi
−i,j+β
n·
−i,j+W β
(ndi−i,j +α) (2.4) Once we are satisfied that the model has converged to a reasonable level, we can calculate posterior values for document topic distributions θ and topic word distributions φ as follows.
φ(jw) ≈ n
w j +β
n.
j+W β
(2.5)
θj(d) ≈ n
d j +α
nd . +T α
(2.6)
2.4.2
Topic Model Evaluation and Diagnostics
Though topic models are powerful devices for identifying thematic patterns in collections of text documents (e.g.: [Griffiths et al. 2004;Blei 2012]), the models generated are not guaranteed to accurately represent real and meaningful patterns in the data. Even with random data, a model will be produced. Further, it is typically the case that a model will contain some “good” topics and some “poor quality” topics [Chuang et al. 2013;Mimno et al. 2011] (seeHuman Assessments below for interpretations of topic quality). Another study [Poldrack et al. 2012] observed that models with differing numbers of topics resolved concepts in the corpus with differing granularity. Thus there may not be a single “best” model, and which to choose may depend on the particular aims of the study at hand.
been limited to qualitative human judgements [AlSumait et al. 2009]. Recent work has identified several automated metrics that correlate well with such as-sessments as well as approaches for “posterior predictive checking” of topic models (see Automated Model Diagnostics below).
Topic Model Hyper-parameters
LDA, in its original form [Pritchard et al. 2000; Blei et al. 2003], requires the analyst to choose values for hyperparameters (the number of topics and Dirichlet sparsity parameters for word-topic and topic-document priors). With experience, reasonable choices can be made, although automated techniques have been de-veloped that perform well and are generally seen as preferable. Two important approaches have been developed: (i) estimation of optimal Dirichlet parameters and (ii) so called ‘non-parametric models’ that essentially infer the number of topics (with a hyper-parameter determining how this is done; See Section 2.4.4). Wallach et al. [Wallach et al. 2009; Wallach 2008] investigated inference of Dirichlet hyperparameters from data. They built models that inferred values for the Dirichlet priors of topic-document distributions α and word-topic distribu-tions β, also experimenting with the standard symmetric priors and asymmetric versions of each. They found that the best configuration, in terms of data like-lihood in the posterior, was to estimate an asymmetric topic-document prior
α and a symmetric β. Allowing β to be asymmetric did not significantly im-prove likelihood. They argued that an asymmetric α allows some topics to be distributed fairly uniformly among documents, capturing very frequent words, whereas a symmetric β ensures that topics are distinct. Others have also noted that their hyperparameter optimisation performs well in terms of semantic co-herence [Chuang et al. 2013] and in comparison to a grid search for optimal parameters [Asuncion et al. 2009]. It is interesting to note that one study found that optimising Dirichlet hyperparameters did not improve model quality, how-ever they manually removed general and uninformative words from the data prior to estimating their final models, which may have obviated the need [Talley et al. 2011].
Held-Out Likelihood
a proxy for likelihood — it is monotonically decreasing in the likelihood of the held-out data [Blei et al. 2003].
A large proportion of papers relating to LDA use perplexity on held-out data as the measure of model quality. It has, however, been observed that perplexity does not necessarily capture human assessment of topic quality [Chang et al. 2009] and that models with more topics than indicated by optimal perplexity can better identify more granular concepts [Talley et al. 2011]. It is difficult to argue that the model with the best perplexity necessarily captures the types of structures we are interested in. Indeed, much of the effort in applied topic modelling attempts to recognise and remove modelled structures that are judged as noise or ‘junk’ (e.g.: [Chuang et al. 2013; Talley et al. 2011]). A model that captures such ‘junk’ structures well, but other, more interesting, structures poorly, may exhibit a good perplexity score, but is clearly suboptimal in real terms.
Perplexity is the inverse of the geometric mean of per-word likelihoods. Given held-out documents D and denoting the total number of words in the held-out documents as |D|:
Perplexity(D) := −exp
P
w∈Dlogp(w|model)
|D|
Note that calculating p(w|model) exactly is usually intractable as it is nec-essary to integrate over all possible topic-word assignments, however there are a number of ways to estimate it: for example see [Wallach et al. 2009].
Human Assessments
Application-focussed human assessments are always possible, however they re-quire many man-hours (often from experts) and care must be taken to control for individual and systematic human biases. Several such studies have, nonetheless, been made, with some interesting observations on the ability of Bayesian topic models to find semantically-meaningful topics in text.
A powerful approach is to construct a multinomial model of topics based on human-identified semantics in a body of text. Chuang et al. [Chuang et al. 2013] recruited the help of domain experts to construct a comprehensive and exhaustive11model of the topics in a corpus of research literature. This model was then compared with LDA topic models generated with a comprehensive sweep of parameter settings (number of topics and concentration parameters for word-topic
and topic-document priors). They identified several types of low-quality topics (fused, junk or missing) as well as good quality or ‘resolved’ topics, and observed all types in all models with proportions varying with parameter settings. A number of other studies have also observed that that LDA topic models typically contain a number of topics of poor quality [Hall et al. 2008; Talley et al. 2011; Poldrack et al. 2012]. Another common observation is that increasing the number of topics can resolve topics of increasing granularity [Poldrack et al. 2012]
Many studies aimed at producing high-quality models of specific document corpora have used post-hoc assessments of topic relevance to judge model quality (e.g.: [Hall et al. 2008; Talley et al. 2011; Wahabzada et al. 2012]). Dirichlet hyperparameters are typically either optimised during estimation (using methods such as in [Wallach et al. 2009]) or chosen by the authors. Similarly, the number of topics is often an ad-hoc choice by the authors that is not clearly explained in the publication (e.g.: [Hall et al. 2008]).
One study of successful NIH12 grant applications [Talley et al. 2011] is of par-ticular interest. This study combined diagnostic heuristics (see Subsection 2.4.2 below) with expert assessment by the authors. Preliminary models were found to contain topics that had “relatively uniform and distinctively low document allocations” (a diagnostic of semantically poor topics), and these topics were consistently found to contain general, non-research terms. Using these topics as an aid, the authors manually constructed a list of ∼1200 uninteresting words,
which were removed from the data for subsequent models. They also manually constructed lists of acronyms and commonly used bigrams and phrases. The result of both activities was to greatly improve assessed model quality.
Many studies have used topic models to tackle established estimation problems for which standard annotated data sets have been constructed (e.g.: [Griffiths and Steyvers 2003; Griffiths et al. 2004; Fei-Fei and Perona 2005; Boyd-Graber et al. 2007]).
It is worth noting that the paper that first introduced Gibbs sampling for LDA [Griffiths and Steyvers 2004] used subject category meta-data to qualita-tively verify a topic model of PNAS13 abstracts. The authors used a Bayesian approach to select the number of topics, then selected topics that were ‘diagnostic’ of each subject category (those with the highest average topic proportions) and made qualitative observations about topic semantics and category relationships.
12The American National Institutes of Health
Automated Model Diagnostics
Given the expense and potential impracticability of human assessments of topic models (e.g.: models with thousands of topics), there have been several attempts to construct automated methods that can separate topics judged by humans to be uninformative or incoherent from those judged as meaningful semantic units.
Types of Low Quality Topics Chuang et al. [Chuang et al. 2013] identified “junk” or “fused” topics in their analysis (“fused” meaning topics representa-tive of two or more expert-identified topics). Mimno et al. [Mimno et al. 2011] asked domain experts to characterise ways in which topics could fail to represent semantically coherent units, resulting in a more detailed assessment, identifying several ways a topic can be “fused” as well as topics that are almost coherent. They summarised responses thus:
• Chained: words used in different contexts pull the contexts into one topic (these are “fused” topics).
• Intruded: either merged “chimera” topics (“fused”) or a few words intruding into an otherwise coherent topic.
• Random: few sensible connections between words (“junk”).
• Unbalanced: words are connected, but combine very general and specific terms (“fused”).
Mimno later summarised diagnostic tools he had developed based both on this study and other practical experiences in topic modelling [Mimno 2012a]. These tools are implemented in the popular Mallet topic modelling toolkit [McCallum 2002].
• Topic size: Topics accounting for very few words in the corpus are more likely to be random, capturing words not accounted for by other more co-herent topics.
• Similarity to corpus frequency: A topic whose word probabilities match cor-pus frequencies is not very informative and tends to represent the remainder of the corpus after useful topics have been identified.
• Locally frequent words: Words appearing with high frequency in a small selection of documents, for example character names particular to a single chapter of a novel, often tend to dominate a topic. Such topics provide little extra semantic information, but can be recognised by their occurrence in very few documents but with high document proportions.
• Co-doc coherence: A measure of semantic coherence, and the main output of [Mimno et al. 2011]. Explained in more depth in the following paragraphs.
Topic Coherence Measures A number of studies have been made attempt-ing to automatically assess topic semantic coherence with the aim of predictattempt-ing human judgements. Two strategies for measuring human judgements have been proposed, both of which use short lists of the most probable words for each topic. The first asks assessors to rank a topic on a Likert scale (typically 1–3) [New-man et al. 2010]. The other draws on the observation that topics often contain significant “intruder” words that do not fit the semantics of the other words in the topic, posing a task where assessors attempt to detect a word chosen to not fit the semantics of the topic which has been deliberately added to the topic representation [Chang et al. 2009].
An important distinction between the coherence measures that have been introduced lies in the use of a large external reference corpus. Word relationships determined from the external corpus can be used to assess the thematic quality of topics. Newman et al. use pointwise mutual information (PMI) in the reference corpus between a topic’s top words [Newman et al. 2010]. An approach creating a “semantic vector space” from reference data and using similarity metrics in those spaces performed marginally better than previous coherence measures [Aletras and Stevenson 2013].