White Rose Research Online URL for this paper:
http://eprints.whiterose.ac.uk/139879/
Version: Published Version
Monograph:
Conti, Stefano and Claxton, Karl Philip orcid.org/0000-0003-2002-4694 (2008) Dimensions
of Design Space: : A Decision-Theoretic Approach to Optimal Research Design.
Discussion Paper. CHE Research Paper . Centre for Health Economics, University of
York , York, UK.
eprints@whiterose.ac.uk https://eprints.whiterose.ac.uk/ Reuse
Items deposited in White Rose Research Online are protected by copyright, with all rights reserved unless indicated otherwise. They may be downloaded and/or printed for private study, or other acts as permitted by national copyright laws. The publisher or other rights holders may allow further reproduction and re-use of the full text version. This is indicated by the licence information on the White Rose Research Online record for the item.
Takedown
If you consider content in White Rose Research Online to be in breach of UK law, please notify us by
Dimensions of Design Space:
A Decision-Theoretic Approach to
Optimal Research Design
Dimensions of Design Space:
A Decision-Theoretic Approach to Optimal
Research Design
Stefano Conti
1Karl Claxton
1, 2Centre for Health Economics, University of York, UK
1Department of Economics and Related Studies, University of York, UK
2CHE Discussion Papers (DPs) began publication in 1983 as a means of making current research material more widely available to health economists and other potential users. So as to speed up the dissemination process, papers were originally published by CHE and distributed by post to a worldwide readership.
The new CHE Research Paper series takes over that function and provides access to current research output via web-based publication, although hard copy will continue to be available (but subject to charge).
Acknowledgements
This work was funded by a programme grant from the UK Medical Research Council as part of the Health Services Research Collaboration.
Earlier work, which formed the basis of this paper, was originally presented at the Society for Medical Decision Making Meeting in Boston 2006.
The authors† wish to thank Neil Hawkins and Nicky Welton for helpful comments and advice.
Disclaimer
Papers published in the CHE Research Paper (RP) series are intended as a contribution to current research. Work and ideas reported in RPs may not always represent the final position and as such may sometimes need to be treated as work in progress. The material and views expressed in RPs are solely those of the authors and should not be interpreted as representing the collective views of CHE research staff or their research funders.
Further copies
Copies of this paper are freely available to download from the CHE website
www.york.ac.uk/inst/che/publications/index.htm. Access to downloaded material is provided on the understanding that it is intended for personal use. Copies of downloaded papers may be distributed to third-parties subject to the proviso that the CHE publication source is properly acknowledged and that such distribution is not subject to any payment.
Printed copies are available on request at a charge of £5.00 per copy. Please contact the CHE Publications Office, email che-pub@york.ac.uk, telephone 01904 321458 for further details.
Centre for Health Economics Alcuin College
University of York York, UK
www.york.ac.uk/inst/che
© Stefano Conti and Karl Claxton
Abstract
Bayesian decision theory can be used not only to establish the optimal sample size and its allocation in a single clinical study, but also to identify an optimal portfolio of research combining different types of study design. Within a single study, the highest societal pay-off to proposed research is achieved when its sample sizes, and allocation between available treatment options, are chosen to maximise the Expected Net Benefit of Sampling (ENBS). Where a number of different types of study informing different parameters in the decision problem could be conducted, the simultaneous estimation of ENBS across all dimensions of the design space is required to identify the optimal sample sizes and allocations within such a research portfolio. This is illustrated through a simple example of a decision model of zanamivir for the treatment of influenza. The possible study designs include: i) a single trial of all the parameters; ii) a clinical trial providing evidence only on clinical endpoints; iii) an epidemiological study of natural history of disease and iv) a survey of quality of life. The possible combinations, samples sizes and allocation between trial arms are evaluated over a range of cost-effectiveness thresholds. The computational challenges are addressed by implementing optimisation algorithms to search the ENBS surface more efficiently over such large dimensions.
Keywords: Bayesian decision theory; expected value of information; research design; cost-effectiveness analysis
1. Introduction
Health-care systems typically face two conceptually separate, albeit concurrent, questions: firstly, should a health-care technology be adopted (reimbursed) in the light of current evidence about resource use and health outcomes? Secondly, is additional research required to support the use of the technology, and if so how much and what type of research would be most useful? Both questions are at the heart of much of the international debate about the appropriate regulation and reimbursement of health-care technologies. In general, decisions to adopt (reimburse) or reject a technology can be made on the basis of existing information or conditional on providing additional evidence to inform this decision in the future. In the United States the FDA requires claims for a technology to be “sufficiently substantiated”, based on some assessment of the benefits and costs of acquiring more information to support the claim (see Neumann et al., 2000). In England and Wales the National Institute for Health and Clinical Excellence (NICE), which issues guidance to the NHS on the use of technologies, also issues guidance on the need for further research (NICE, 2004). It has made adoption conditional on the production of further evidence and in some circumstances has made recommendations that a technology can only be used in research (Chalkidou, et al. 2007).
Addressing the question of whether and what type of research is needed becomes more challenging when the full range of different types of study and different designs (e.g., sample sizes) which could be conducted are considered. In most situations a variety of different types of study, informing different (groups of) parameters or endpoints, is usually possible. For instance, while randomised controlled trials (RCTs) are useful to investigate those clinical endpoints vulnerable to section bias, other (not necessarily experimental) studies may be called upon to collect information about the natural history of a disease of interest or some measure of quality of life associated with particular clinical events. To start to address these research decisions, a measure of the social value of the information generated by research is needed.
1.1 Methodological background
The Bayesian approach to value of information has a firm foundation in statistical decision theory (see e.g. Schlaifer, 1959; Howard, 1966; Berger, 1985; Pratt et al., 1995; Raiffa and Schlaifer, 2000; Parmigiani, 2002). It provides a coherent framework to establish the social value of additional information, which has been successfully applied in other areas of research (e.g. Hammitt and Cave, 1995; Thompson and Graham, 1996; Thompson and Evans, 1997) and more recently proposed in the evaluation of health-care technologies (see e.g. Claxton and Posnett, 1996; Felli and Hazen, 1998; Claxton, 1999; Yokota and Thompson 2004; Briggs et al., 2006). In particular, an increasing number of applications in this area have incorporated an analysis of the value of perfect information (see e.g., Ades et al., 2004; Fenwick et al. 2006; Claxton and Sculpher, 2006; Philips et al., 2006; and Colbourn et al., 2007; Bojke et al., 2008). However, the demonstration and application of value of sample information analysis are more limited (see e.g. Ades et al., 2004; Willan and Pinto, 2005; Brennan and Kharroubi, 2007ab; Eckermann and Willan, 2008) and to date no attempt has been made to explore all the dimensions of design space available using these methods.
1.2 Design space
In its simplest form, research design can be formulated as a sample size determination problem (see reviews from e.g. Pezeshk, 2003; Chaloner and Verdinelli, 1995): under this perspective, the design problem reduces to identifying the optimal size for each of the studies which could be conducted. The optimal sample size for a single study will be the sample size that generates the greatest ENBS. For studies which include a number of treatment arms (e.g., a RCT comparing a new technology to one or more alternatives) not only the optimal total number of patients to enrol needs to be sought, but also their optimal allocation to each treatment arm. Equal between-arm allocation is often adopted based on a simplifying assumption of equal variance for each arm. However, this assumption is seldom justified and, even if it were, the resource and opportunity cost of allocation to different arms is very unlikely to be the same. Therefore, when only considering a single RCT, both optimal sample size and its allocation need to be established (Claxton and Thompson, 2001).
It is seldom the case that a single RCT is the only research possibility. If more than one type of study can be conducted, then optimal sample size and its allocation can be established for each study independently. If these are mutually exclusive alternatives then the research decision is simply to choose the optimally designed single study which offers the highest ENBS. However, in many common circumstances, different types of study are not mutually exclusive and can be conducted concurrently. The social value of a combination of studies (a portfolio) is not the sum of the ENBS of each but must be estimated simultaneously. The portfolio optimisation problem becomes one of finding the allocation of patients between and within studies which provides the maximum ENBS. The optimal portfolio size and allocation will generally be different to that implied by simple combination of independent designs. The research decision problem becomes one of a choice between a number of alternative single studies or an optimally designed portfolio. This choice can be based on the ENBS offered by each.
The purpose of this paper is to demonstrate the principles and methods for the thorough assessment of all these dimensions of the design space. Its aim is to show that Bayesian decision theory can provide a coherent and useful analytical framework to estimate the social value of research, establish optimal research designs and inform the research decision. The paper proceeds by introducing an illustrative example of a simple decision model of zanamivir for the treatment of influenza, reporting estimates of cost and effect based on, the then, current information. The necessary and sufficient conditions for conducting further research reported before optimal research designs are considered in more detail. A single RCT with equal allocation is considered first, and then equal allocation is introduced. Subsequently other types of study are introduced, first optimised independently and then simultaneously as a portfolio. The research decision is then reconsidered once the analyses of all these dimensions of design space have been explored. In doing so, we adopt an optimisation algorithm which eases the computational challenges arising from using Bayesian decision theory to optimise over such large dimensions of design space.
2. An illustrative example
The principles and benefits of adopting a Bayesian decision theoretic approach to research decisions is illustrated using a simple example of the use of zanamivir in the treatment of influenza. NICE conducted an appraisal of zanamivir in 2000 and issued guidance (NICE, 2000b) which imposed a number of restriction and conditions on its use. In particular, treatment should only be offered when influenza is circulating in the community and for at-risk adults who present within 36 hours of the onset of influenza like illness. At-risk adults were defined as those over the age of 65 or those with chronic respiratory disease, significant cardiovascular disease, immunocompromised and those with diabetes mellitus.
The assessment report included fixed effect meta-analysis for both these endpoints. None of the trials included effect on hospitalisation or economic and quality of life data.
[image:10.595.69.531.266.541.2]A simple decision tree model was constructed to compare zanamivir with standard care. The proportion of influenza positive patients presenting with influenza like illness (pip) was based on evidence from a sponsored submission (Glaxo-Wellcome, 2000). The probability of complications requiring antibiotics and the probability of hospitalisation with standard care (pcs and phs) was based on observational data (Meier et al., 2000). The reduction in symptom days (rsd) was based on the results of the fixed effect meta analysis. The reduction in complications for those receiving zanamivir was based on the log-odds ratio from the same meta-analysis (LORc) and a similar effect on hospitalisation (LORh) was assumed. The improvement in quality of life due to reduced symptom time (utl) was based on an assumed impact on all dimensions of EQ5D. Resource use was based on published unit costs, hospital length of stay and number of GP visits (Netton and Dennett, 1998; Burls et al., 2000).
Table 1: Parameters of the decision model for zanamivir vs. standard care
Parameter Prior Likelihood Source
Probability of influenza-positive
(pip)
Β
(
34
,
66
)
Bin
(
n
Std,
pip
)
Glaxo-Wellcome submission (2000) Probability of complications
under standard care (pcs)
Β
(
452
,
548
)
Bin
(
n
Std,
pcs
)
Study based on GPRD (Meier et al., 2000) Probability of hospitalisation
under standard care (phs)
Β
(
25
,
975
)
Bin
(
n
Std,
pcs
)
Study based on GPRD (Meier et al., 2000) Complications
LOR (LORc)
(
)
210
168
.
3
,
353
.
0
−×
−
N
Normal proxy to Binomial (Ades et al., 2004, sec. 4.1)Fixed effects meta-analysis in Burls et al.
(2002) Hospitalisation
LOR (LORh)
(
)
210
168
.
3
,
353
.
0
−×
−
N
Normal proxy to Binomial (Ades et al., 2004, sec. 4.1)Fixed effects meta-analysis in Burls et al.
(2002) Reduction in symptom days
(rsd)
N
(
1
.
67
,
0
.
748
)
(
(
1 1))
363
,
− −+
×
Zan Stdn
n
rsd
N
Fixed effectsmeta-analysis in Burls et al. (2002) Annual utility gain (utl)
(
)
310
613
.
4
,
242
.
0
−×
−
N
(
(
)
1)
185
.
0
,
−+
×
Zan Stdn
n
utl
N
Obtained from Burls et al.(2002)
A probabilistic reanalysis of this model was conducted, based only on the information which was publicly available in the assessment report at the time the guidance was issued. The uncertainty surrounding the decision to adopt zanamivir for this patient group was characterised by assigning prior distributions to each of the key parameters and are detailed in Table 1. Unit prices and resource use were assumed to be known. Monte Carlo (MC) simulation was conducted to obtain the joint distributions of costs and effects and net benefit (Stinnett and Mullahy, 1998) for a range of cost-effectiveness thresholds
( )
λ
. Zanamivir is more costly but more effective than standard care with an expected incremental cost-effectives ratio of £51,700. The cost-effectiveness acceptability curve is illustrated in Figure 1a (Van Hout et al. 1994; Fenwick et al., 2001) and indicates that when000
,
60
£
=
3. Is additional research required?
In absence of sunk costs or other irreversibilities (Eckermann and Willan, 2006; Griffin et al., 2007; Palmer and Smith, 2000) the technology which is expected to be cost-effective should be selected based on current information. However, a second decision also needs to be made: is additional research required to support the use of the technology, and if so how much and what type of research would be most useful?
3.1 Necessary condition for further research
The Expected Value of Perfect Information (EVPI) surrounding the decision to adopt or reject a technology places an upper bound on the social value of additional evidence and a necessary condition for deciding to conduct further research, i.e., further research is potentially worthwhile only if the population EVPI is greater than the expected costs of further studies.
A decision model with unknown parameters
ϑ
yields (typically by MC simulation) a distribution for the net benefitsNB
t( )
ϑ
of each treatment optiont
=
1
,
K
,
T
for a homogeneous patient population. After characterising the uncertainty around model parametersϑ
by assigning prior probability distributions (see Table 1), the EVPI for an individual patient is defined as( )
ϑ
ϑ[
( )
ϑ
]
ϑ t
T t t
T
t
NB
NB
EVPI
=
Ε
⎢⎣
⎡
⎥⎦
⎤
−
Ε
=
=
max
1,K,max
1,K, . (1) Given current information, the adoption decision can only be made before the uncertainty about model parametersϑ
resolves for all evaluated treatment options, i.e., choose the alternative which maximises the expected net benefitΕ
ϑ[
NB
t( )
ϑ
]
. In principle, perfect information aboutϑ
would allow maximisation of the actual net benefitNB
t( )
ϑ
for any particular value ofϑ
, hence yielding( )
ϑ
t t
NB
max
; however, since the true values are unknown, such maximum values need to beaveraged over the joint distribution of
ϑ
, which in turn leads toΕ
ϑ[
max
tNB
t( )
ϑ
]
. Thus the EVPI is the difference in social pay-off when making decisions with perfect rather than current information (see Ades et al., 2004).While EVPI indicates the maximum social value of information about the decision problem, it does not indicate which type of evidence (which model parameters) might be most useful. The EVPI calculation can be extended to calculate the EVPPI associated with selected (groups of) parameters (Ades et al., 2004). Having divided model parameters
ϑ
=
(
ϕ
,
ψ
)
into nuisance( )
ψ
and relevant( )
ϕ
parameters of interest,(
)
[
]
{
ψϕϕ
ψ
}
ϑ[
( )
ϑ
]
ϕ ϕ t T t t T
t
NB
NB
EVPPI
=
Ε
Ε
−
Ε
=
=
max
1,K,,
max
1,K, (2) quantifies the maximum social value of acquiring information aboutϕ
alone. With perfect knowledge about parameters of interestϕ
, the decision-maker is able to identify the technology yielding highest expected net benefit (with respect to the residual uncertainty aboutψ
)max
tΕ
ψϕ[
NB
t(
ϕ
,
ψ
)
]
However, as in the case of EVPI, the true value of
ϕ
is unknown so that an additional expectation(
)
[
]
{
ψϕϕ
ψ
}
ϕ
max
tΕ
NB
t,
Ε
over the prior distribution ofϕ
needs to be evaluated. It should benoted that EVPI does not additively decompose into its individual EVPPI components, due to the presence of interactions occurring within the model structure.
Expressions (1) or (2) provides the EVPI or EVPPI for each time this decision is made (i.e., for an individual patient or individual patient episode). These values need to be expressed for the current and future population that could benefit from further research. If
Q
h patients (or episodes) enter thePopulation EVPI, or PEVPI at discount rate
r
,(
)
∑
=
+
×
=
Hh
h h
r
Q
EVPI
PEVPI
1
1
(3)
is obtained. Both
Q
h andH
are in principle also subject to uncertainty and proxy a complex anduncertain process of future changes (Philips et al., 2008). In this example we assume
H
=
7
years,000
,
136
=
h
[image:12.595.109.476.218.474.2]Q
andr
=
6
%.
Figure 1: Cost-Effectiveness Acceptability Curve (a) and Population Expected Values of Perfect Information (b) (vertical lines = ICER)
Estimates of population EVPI and EVPPI over a range of cost-effectiveness thresholds are illustrated in Figure 1b. At cost-effectiveness thresholds greater that £30,000 the population EVPI is likely to exceed the costs of further investigation and further research maybe worthwhile. The EVPPI associated with reduction in symptom days on zanamivir is relatively high but a more precise estimate would require experimental design to avoid selection bias. This suggests that a further randomised trial may be worthwhile. However, there are other parameters associated with significant EVPPI (most notably the quality of life associated with influenza symptoms and the probability that a patient presenting with influenza like symptoms does in fact have influenza) which may not require experimental design and could be informed by an observational study or a survey of quality of life.
3.2 Sufficient condition for further research
The estimates of population EVPI and EVPPI only provide an upper bound on the social value of research. However, fully informing the research decision requires a sufficient condition to be established based on the expected benefits and costs of particular proposed research designs.
Sample information would allow an update of (imperfect) prior knowledge of model parameters into a
from
J
samples ofn
=
(
n
1,
K
,
n
J)
patients, will inform parametersϑ
. The expected social value of evidence generated by the designn
is then expressed by the Expected Value of Sample Information (Ades et al., 2004),( )
{
ϑ[
( )
ϑ
]
}
ϑ[
t( )
ϑ
]
T t t x T t
x
NB
NB
n
EVSI
=
Ε
Ε
−
Ε
=
=
max
1,K,max
1,K, , (4)which measures the additional value of the adoption decision when based on sample
( )
n
rather thancurrent information. Analogously to (2), the information about
ϑ
conveyed inx
would allow the decision-maker to establish which treatment yields highest expected net benefitΕ
ϑx[
NB
t( )
ϑ
]
. Due to the sampling variability surroundingx
, a further expectation over its predictive distribution is however needed (first term at the RHS of (4)). At a particular cost-effectiveness threshold the EVSI converges to the EVPI as sample size increases and provides an upper bound to EVSI. As with EVPI the EVSI needs to be expressed for the population of current and future patients who will benefit from this information. The population EVSI for proposed research with sample sizesn
is given by( )
( )
∑
(
)
=+
×
=
H h h hr
Q
n
EVSI
n
PEVSI
11
(5)The estimation of
EVSI
( )
n
poses greater challenges than EVPI because both inner and outer expectations within the first term of (4) can be computationally burdensome, especially with non-multi-linear decision models1 (Ades et al., 2004). In this simple example, both log-odds ratios of complications and hospitalisation are modelled via a Normal approximation to Binomial likelihoods (see Table 1) and second-order Taylor series expansions were also invoked to ensure multi-linearity and are recommended in computations involving non-linear parameter transformations in otherwise linear net benefit functions (Ades et al., 2004,).The
PEVSI
( )
n
needs to be compared to the costs of samplingC
( )
n
, which includes resource and opportunity costs:( )
∑
( )
( )
∑
∑
{
[
( )
( )
]
}
≠ = = =−
Ε
+
+
⎥
⎦
⎤
⎢
⎣
⎡ +
=
T t t t t t t T t t T t t tf
c
n
EVSI
n
n
n
NB
NB
c
n
C
1 1 1ϑ
ϑ
ϑ . (6)
The first term of (6) includes the fixed and reporting resource costs, the second term includes expected benefits from the research which will be forgone by those patients enrolled in the study (the population that can benefit from the results of the research is ‘used up’) and the third term includes the expected net benefit forgone by those patients allocated to the treatment(s) which are not a priori
cost-effective.
The social value of proposed research is the difference between expected benefits
(
PEVSI
( )
n
)
andcosts
(
C
( )
n
)
or the Expected Net Benefit of Sampling( )
n
PEVSI
( )
n
C
( )
n
ENBS
=
−
, (7)This provides a sufficient condition for deciding to conduct more research, i.e., only if
ENBS
( )
n
is greater than zero is further research justified. It also provides the means to choose between different types of study and different designs (sample size and its allocation). The research decision can now be characterised as choosing the type of study(ies) and design(s) which maximises the ENBS.4. Research design space
Ideally, the research design
n
∗ yielding the highest ENBS over a range of sample sizes should be sought and implemented. In principle this defines a relatively straightforward integer programming problem, where the objective functionENBS
( )
⋅
is to be maximised over the examined design spaceD
of study sizesn
.
Complications, however, arise in practice due to the nature of the objective function: in most situations exact ENBS evaluation is not possible due to the nested expectation and maximisation required in the definition (4) of PEVSI. The problem ofENBS
( )
⋅
not being generally available in closed form is usually circumvented by replacing (7) with a suitable approximation, ensuring that the maximum it produces would consistently estimaten
∗. A number of approximation-based solutions dealing with difficulties in PEVSI calculations recently appeared in the statistical literature: see in particular Brennan and Kharroubi (2007a), Oakley (2005) and O'Hagan et al. (2005). The most established and straightforward method (see Gilks et al., 1996, ch. 14), which is alsoadopted throughout the paper, relies on the empirical MC estimator
ENBS
( )
n
∧
. This is obtained from taking sample averages over both the predictive distribution of the data
x
(for the outer expectation in (4)) and the posterior distribution of the model inputsϑ
conditional on datax
(for the inner expectation).4.1 Designing a single study
[image:14.595.125.468.472.730.2]A simple research design which would inform the zanamivir vs standard care decision problem consists of a RCT allocating equal number of entrants to its arms (a fixed sample design) and simultaneously informing all model parameters. In this case, the ENBS maximising design
n
∗ indicates how many patients should be enrolled in the trial for it to provide the highest social value. This initial simplicity of the design space(
D
=
ℵ
)
allowed full enumeration of a sufficient range of sample sizes to identify the optimal sample size and the maximum ENBS at very high MC resolutions (506 iterations).Figure 2 and the first two rows of Table 2 summarises the results of fully exploring this limited design space when fixed costs
c
f are excluded for simplicity, as they do not influence optimal sample size(or its allocation) and reporting costs
c
Std andc
Zan for each arm are assumed equal at £600 perpatient. Figure 2a illustrates
PEVSI
( )
n
,C
( )
n
andENBS
( )
n
for a range of sample sizes when000
,
50
£
=
λ
. As expectedPEVSI
( )
n
increases withn
but at a declining rate, approaching PEVPI in the limit. Therefore, the ENBS reaches a ‘non sharp’ maximum where the ENBS curve is relatively flat, i.e., sample sizes slightly greater or less than optimal have little impact on ENBS. Figure 2b illustrates ENBS curves at three cost-effectiveness thresholds over the same range of sample sizes. The ENBS is highest whenλ
=
£
50
,
000
reflecting the fact that the decision is most uncertain (see Figure 1a) and information is more valuable whenλ
=
£
50
,
000
rather thanλ
=
£
60
,
000
or000
,
40
£
=
λ
(see Figure 1b). Again, the ENBS curve is relatively flat at its maximum. The optimal sample size also changes with the cost-effectiveness threshold. This relationship is explored more fully in Figure 2c which plots the optimal sample size for a range of cost-effectiveness thresholds. At000
,
30
£
<
λ
the optimal sample size is zero and no further research is needed. Whenλ
>
£
30
,
000
the optimal sample size increases with
λ
reaching a maximum of 999 atλ
=
£
61
,
000
and declines thereafter because the increased opportunity costs incurred by enrolled patients starts to outweigh the marginally diminishing gains generated from additional sample information. Figure 2b and 2c show that both the value of conducting research and its optimal design (in this case only sample size) depends critically on economic considerations represented by the cost-effectiveness threshold.4.2 Optimisation algorithms
The limited design space
D
=
ℵ
considered above makes an exhaustive search forn
∗ using estimates of ENBS at very high MC resolutions feasible. However, such an exhaustive search is unlikely to be possible when the other dimensions of the design space described are considered because the computational burden increases geometrically with the dimensions that need to be explored, e.g., considering optimal allocation of each possible sample between two arms of a trial means increasing the dimension ofD
from 1 to 2. One way of mitigating this “curse of dimensionality” is to replace the previous exhaustive search with a more efficient search for the maximum ENBS and the associated optimal sample size. A number of more efficient searches or optimisation algorithms are available which when started at a randomly chosen point will evaluate ENBS at candidate sample sizes iterating to the sample size that provides the maximum ENBS. The improved adaptive Nelder-Mead simplex method (see e.g. Nocedal and Wright, 1999, ch. 9) was adopted for its robustness and parsimony in general multi-variate optimisation settings.This optimisation algorithm searches for the global maximum on the ENBS surface. If the surface is smooth with a single global maximum then a single optimisation routine would be required to identify
the maximum ENBS and optimal sample size. However, although
ENBS
( )
n
∧
from MC simulation is a
consistent estimator of (7) the estimated surface
ENBS
( )
⋅
, is rough, and its roughness depends on the MC resolution used in its estimation. This rough surface does not preserve the convergence properties underpinning most optimisation algorithms and a single optimisation routine will not necessarily locaten
∗. However, the Sample Average Approximation (Shapiro, 2000) indicates thatthe estimated optimal design
n
n DENBS
( )
n
∧ ∈
=
arg
max
ˆ
converges to the optimal design( )
n
ENBS
n
∗=
arg
max
n∈D at an exponential rate with the MC resolution. This suggests that a number( )
L
of optimisation routines are required, each started at random sample sizes. This multipleoptimisation provides a sample of estimated optimal sample sizes
n
ˆ
1,
K
,
n
ˆ
L and associated( )
⋅
∧
ENBS
values. This sample of estimates provides credible ranges forn
∗ andENBS
( )
n
∗ , with theaverage optimal sample size
(
n
n
L
)
l l
∑
⎟
⎠
⎞
⎜
⎝
⎛
=
∑
∧L
ENBS
ENBS
l l providing central estimates. By selecting the number of optimisations and
[image:16.595.119.468.194.439.2]the MC resolution used to estimate each candidate ENBS, a credible range for optimal design can be established for feasible computing times. A narrower range can be achieved with higher MC resolutions but at the cost of additional computation time. Of course, a sufficient number of optimisations needs to be conducted to ensure the credible range includes the optimum (this will tend to be greater for lower MC resolutions as the surface will be rougher).
Figure 3: Estimates of maximum ENBS (equal allocation) (a) and optimal sample allocation (b) (filled circles = mean values)
In the simple
D
=
ℵ
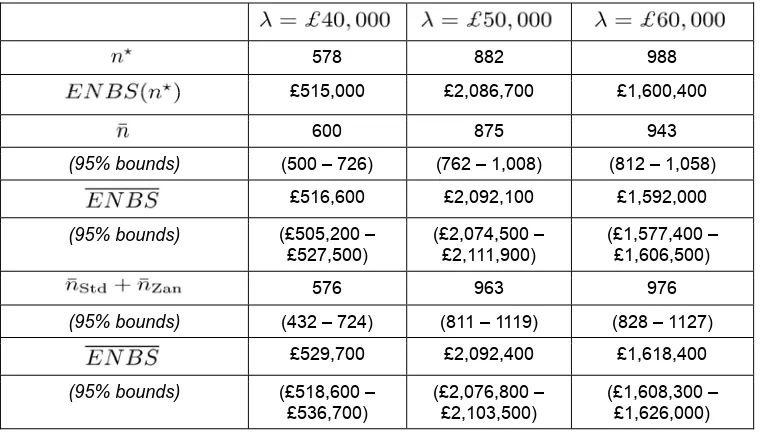
research design considered above, the ENBS can be expected to reach a single global maximum.2 However, for higher-dimensional design problems there may not necessarily be a single maximum on the ENBS surface, so a single optimisation routine may locate a local rather then global maximum even on a smooth surface. Therefore, using a number of optimisation routines each started at random points in the design space also ensures that the global rather than a local maximum will be located. The presence of a local maximum would be indicated by a bi- or multi-modal distribution of the estimated maximum ENBS. It should be noted that the distribution of the estimates of maximum ENBS were unimodal for all the dimensions of design space explored below, indicating that in this example at least the ENBS surface had a single maximum for all the deigns explored.Table 2: Summary results for a single trial design
Rows 1-2: equal allocation (high MC resolution); 3-6: equal allocation (optimisation); rows 7-10: optimal allocation (optimisation).
578 882 988 £515,000 £2,086,700 £1,600,400
600 875 943
(95% bounds) (500 – 726) (762 – 1,008) (812 – 1,058) £516,600 £2,092,100 £1,592,000
(95% bounds) (£505,200 – £527,500)
(£2,074,500 – £2,111,900)
(£1,577,400 – £1,606,500)
576 963 976
(95% bounds) (432 – 724) (811 – 1119) (828 – 1127)
£529,700 £2,092,400 £1,618,400
(95% bounds) (£518,600 – £536,700)
(£2,076,800 – £2,103,500)
(£1,608,300 – £1,626,000)
4.3 Optimal sample allocation
So far the exploration of research design space has been restricted to a single RCT allocating an equal number of entrants to its arms and informing all parameters. The problem is simply to identify the sample size that maximises ENBS, i.e., a single dimension of design. However, evaluation of the alternative designs available requires consideration of both the total number of patients to enrol and how they should be allocated between each of the alternative interventions available. The benefits of allocating the sample to different arms of a trial will tend to differ because the variance of the net benefit of each intervention considered is unlikely to be the same. Even if the benefits are similar, the costs of allocating the sample to different arms will differ because even if the reporting costs are the same (as in this case) the opportunity costs (net benefit forgone) of allocation will differ when
ICER
≠
λ
. Therefore the assumption of equal allocation is unlikely to be justified (Claxton and Thompson, 2001).In this example, the problem is to establish the total sample size and its allocation between the two arms which provide the maximum ENBS,
n
∗=
(
n
∗Std,
n
∗Zan)
. The design space increases from one(
D
=
ℵ
)
to two dimensions(
D
=
ℵ
2)
and the computational burden makes the type of exhaustive search at high MC resolutions illustrated in Figure 2 infeasible. The optimisation algorithm described above was implemented and the results for three values ofλ
are illustrated in Figure 3b and reportedin Table 2. Informal inspection of Figure 3b suggests that in this example the optimal allocation does not differ markedly from equal allocation (the rising diagonal) – the joint density of the estimated
n
Std∗ andn
Zan∗ combinations is diffuse and covers equal allocation. This might be expected as the variance of the net benefit of the two arms are similar, and the only difference in sampling costs is the expected net benefit forgone (third term in (6)). However, whenλ
>
ICER
the optimal allocation does suggest that more of the sample should be allocated to standard care, i.e., when the prior decision favours zanamivir it is additional information about standard care rather than zanamivir which is more likely to revise this decision3. These additional benefits of allocation to standard care outweigh the additional opportunity costs of sampling (the expected net benefit forgone).Optimal allocation allows designs to be adopted which either provide more benefit for a particular total sample size and/or reduce the costs of sampling. Therefore, the maximum ENBS must be greater with optimal allocation but the total sample size may not necessarily be higher as more efficient use is made of a smaller sample when allocated efficiently. The results reported in Table 2 confirm this. The estimated maximum ENBS is higher at each of the three cost-effectiveness thresholds, although not markedly so, reflecting the similarity between optimal and equal allocations. The optimal total sample size appears higher when
λ
=
£
50
,
000
but not necessarily at other values ofλ
. The credible intervals for the total optimal sample size are wider than with equal allocation, reflecting the greater complexity of the design space. The credible ranges for the maximum ENBS, however, are narrower indicating that the ENBS surface with optimal allocation is ‘flatter’ and therefore estimates are more stable at the maximum. This is because there are more combinations of(
n
Std,
n
Zan)
which result in ENBS values which are similar and close to their maximum.5. Designing a portfolio of studies
A single RCT which simultaneously informs all the parameters is not the only type of research which could be conducted. Only some of the parameters (reduction in symptom days and the log-odds ratios for complication and hospitalisation) require experimental design to avoid selection bias. Other parameters associated with significant EVPPI (see Figure 1b) may not require experimental design and could be informed by other designs. For example, a survey of quality of life could be undertaken to estimate the quality of life associated with influenza symptoms. An observational epidemiological study could be designed to estimate the probability that a patient presenting with influenza like symptoms does in fact have influenza, as well as the base line probabilities of complication and hospitalisation. If more than one type of study can be conducted, then optimal sample size and its allocation can be established for each type of study independently. If these are mutually exclusive alternatives then the research decision is simply to choose the optimally designed single study with offers the highest ENBS. However, if they are not mutually exclusive but can be conducted together the ENBS of the combination (portfolio) is not the sum of the ENBS of each but must be estimated simultaneously.
5.1 Individual study designs
[image:19.595.117.469.214.452.2]Three alternative types of study can be considered: a simple RCT which only provides information about the clinical endpoints (rsd, LORc and LORh) which are vulnerable to selection bias; an epidemiological study updating pip, pcs and phs, and a survey of quality of life providing estimates of utl. The maximum ENBS and optimal sample size can be established for each study independently of the others. Therefore, one search over two dimensions of design space (optimal sample size and allocation) for the clinical trial,
n
Trl=
n
Std+
n
Zan, and two separate one-dimensional searches for optimal sample size for the epidemiological studyn
Epi and survey of quality of lifen
Utl is required.Figure 4: Estimates of maximum ENBS and optimal sample sizes (filled circles = mean values)
The optimal design of each of these independent studies is illustrated in Figure 4 when
λ
=
£
50
,
000
and details are provided in Table 3 at three cost-effectiveness thresholds. Of these three studies the clinical trial provides the highest ENBS with an optimal sample size much larger than the RCT updating all parameters in Figure 2. This is due to the lower reporting costs of this simpler design (£300 rather than £600) and the fact that the clinical endpoint of reduction in symptom days is associated with the highest value of information.4 5 It should be noted that the credible range for the optimal sample size of this design is greater than previously, reflecting the relative ‘flatness’ of the ENBS surface.6 The survey of quality of life generates the next highest ENBS but at the lowest optimal sample size. This is for three reasons: it is associated with high PEVPPI (see Figure 1b); it has a diffuse prior which means that relatively small amounts of sample information are valuable (PEVSI increases rapidly with
n
Utl); and the reporting costs are assumed to be relatively high (£500). Consequently the ENBS curve has a more pronounced maximum and the credible range for the estimates of optimal sample size is relatively narrow. The epidemiological study generates a lower4 Sample size is higher and the ENBS surface is ‘flatter’ for 2 reasons: i) When the marginal sampling costs are lower optimal sample size will always be higher and the ENBS surface will always be flatter at its maximum other things (i.e., EVSI) being equal. ii) This trial design excludes those parameters with diffuse prior distributions where a relatively small amount of information is valuable and PEVSI increases rapidly with
n
. The parameter rsd is associated with the highest value of information but its prior distribution already has substantial informational content so the PEVSI increases more slowly with sample size. The combined effect of both leads to a higher optimal sample size on a ‘flatter’ ENBS surface.5 Only the estimated optimal total sample sizes from multiple optimisations rather than the optimal allocation between standard care and zanamivir can be represented in two dimensions in Figure 4. Due to computational burden an exhaustive search at very high MC resolution is only possible and illustrated for the single dimensional designs of an epidemiological study and a survey of quality of life.
ENBS but at a higher sample size. This should be expected given the lower PEVPPI associated with these parameters (see Figure 1b), relatively low reporting costs (£200) and less diffuse prior distributions.
Table 3: Summary results for different types of studies
Rows 1-4: clinical trial (optimal allocation); 5-8: epidemiological study; rows 9-12: utility survey; rows 13-16: independent research portfolio.
1,203 2,074 2,263
(95% bounds) (1,055 – 1,366) (1,896 – 2,260) (2,060 – 2,458)
£69,600 £1,577,800 £1,207,700
(95% bounds) (£65,500 – £63,200) (£1,569,200 – £1,585,900)
(£1,200,100 – £1,216,000)
0 453 392
(95% bounds) N.A. (393 – 504) (339 – 444)
0 £731,100 £199,900
(95% bounds) N.A. (£726,200 –
£735,900)
(£196,500 – £202,800)
147 236 239
(95% bounds) (115 – 171) (208 – 267) (203 – 270)
£121,000 £1,335,200 £838,000
(95% bounds) (£117,500 – £123,700)
(£1,328,600 – £1,341,800)
(£831,800 – £844,000)
1,350 2,763 2,894
(95% bounds) (1,170 – 1,537) (2,497 – 3,031) (2,602 – 3,172)
£433,800 £2,129,700 £1,692,100
(95% bounds) (£432,300 – £435,400)
(£2,126,700 – £2,132,500)
(£1,689,900 – £1,694,600)
5.1 Optimal portfolio design
[image:21.595.120.464.307.553.2]While relatively straightforward to implement, the strategy of designing each study independently before combining them to construct a portfolio of research will generally fail to identify the optimal combination which maximises ENBS. Identifying individual research designs independently is sub-optimal because it neglects the relationships between studies designed to investigate different but related aspects of the same decision problem, i.e., it assumes the contribution provided by each study (the parameters they investigate) to the value of information is additive. Therefore the optimal design of a portfolio of research can be regarded as finding the total sample size which when allocated optimally between different studies and/or arms of studies will maximise ENBS. In this example it requires simultaneously searching for
n
∗=
(
n
Std∗,
n
Zan∗,
n
Epi∗,
n
Utl∗)
. The computational scale of this problem and the need for optimisation should be apparent – the dimensions of the design space is now 4(
D
=
ℵ
4)
. Despite the scale of this problem the optimisation procedures outlined above can be used to provide central estimates of total sample size, its allocation, maximum ENBS and the associated credible intervals. Computational burden can be made feasible by the selection of sufficient number of optimisation routines at a manageable MC resolution. Therefore the feasibility of exploring the design space is not really a question of whether it is feasible or not but more a question of what precision is affordable.Figure 5: Optimal sample sizes and allocations from individual (a) and optimal portfolio (b) research designs
The results of optimisation over these 4 dimensions of design space are illustrated in Figure 5 and reported in more detail in Table 4. Figures 5a and 5b illustrate the optimal sample allocations with their credible intervals when studies are respectively designed independently and simultaneously. An informal comparison confirms that that a portfolio of research made up of combining independently designed studies will not necessarily be the same as an optimal portfolio which simultaneously allocates sample between different studies and the arms of studies. There are similarities: for example, the relative size of total sample allocated to the clinical trial, epidemiological study and the survey of quality of life are similar. Also within the clinical trial optimal allocation to the two arms is similar to previous results (see Table 2) where a greater proportion is allocated to standard care when
ICER
<
λ
but more to zanamivir whenλ
>
ICER
7. However these differences in allocation are smaller with independent design rather then simultaneous optimisation across these studies. One noticeable difference, at
λ
=
£
40
,
000
, is that optimal sample size for the epidemiological study iszero, indicating it should be excluded from the portfolio of research when designed independently of the others. However, when designed simultaneously the sample size is positive and it should be included in a portfolio of research.
[image:22.595.96.499.205.420.2]Simultaneous allocation within and between studies allows optimal portfolios to be identified which either provide more benefit for a particular total sample size and/or reduce the costs of sampling.
Table 4: Summary results for an optimal portfolio
Rows 1-2: clinical trial (optimal allocation); 3-4: epidemiological study; rows 5-6: utility survey; rows 7-10: optimal research portfolio.
1,349 1,901 1,991
(95% bounds) (1,179 – 1,529) (1,709 – 2,096) (1,823 – 2,167) 387 511 259
(95% bounds) (243 – 538) (291 – 677) (173 – 360)
170 203 198
(95% bounds) (127 – 219) (151 – 260) (153 – 254)
1,906 2,614 2,449
(95% bounds) (1,687 – 2,134) (2,376 – 2,850) (2,251 – 2,655) £524,200 £2,180,400 £1,756,700
Therefore, the maximum ENBS must be greater with optimal design but the total sample size may not necessarily be higher as more efficient use is made of a smaller sample when allocated optimally. In this case the overall total sample size of the optimal portfolio is lower than the combination of individually designed studies at
λ
=
£
50
,
000
orλ
=
£
60
,
000
(i.e., it makes more efficient use of a smaller sample) but is greater whenλ
=
£
40
,
000
The ENBS for the optimal portfolio reported in Table 4 confirms that the ENBS for an optimally designed portfolio always exceeds the ENBS for the combination of individually designed studies reported in Table 3 at each of the cost-effectiveness thresholds.6. Discussion
A Bayesian decision theoretic approach to both adoption and research decisions means that a rational and consistent approach to both is possible. The decision to adopt a technology can be based on expected net benefits (whilst explicitly taking account of any sunk costs and other irreversibilities) rather than traditional rules of inference. Similarly research design issues cannot be resolved using simple universal rules of precedent either, e.g., the traditional power calculation is based on established benchmarks of power and statistical significance and can be seen as essentially arbitrary. Efficient research design is an empirical and partly economic question determined by the characteristics of the decision problem, the prior information available and the monetary valuation of health outcome which will be applied once the research is completed and an adoption decision must be made. In other words, the efficient design of research cannot be separated from the objectives and constraints on service provision.
has been more limited and restricted to considering the value and optimal sample size of a single study to inform a decision to adopt or reject a technology. The analysis reported above demonstrates that Bayesian decision theory can be used to more fully inform the research decision by exploring more dimensions of research design space when considering the question of whether more evidence is needed to support a decision to adopt or reject a health technology. The research decision is not simply a binary question of whether to conduct further research or not, nor is it restricted to the more complex question of the optimal size of a single study. The research decision requires an examination of much wider dimensions of design space, including how patients should be allocated between the arms of a single study as well as the range of possible combinations of different types of studies that could be conducted to inform particular uncertain parameters.
In this particular example, even when considering a single study with fixed sample design, the optimal allocation of patients between the arms of the proposed trial is important even when the direct costs of allocation between different arms are the same. In this sense optimal allocation is a more fundamental question than the issues which arise in sequential trial designs. As well as an efficiently designed single trial informing all parameters (with optimal sample size and allocation) the research decision space also includes: i) conducting a simpler (and cheaper) clinical trial providing evidence only on clinical endpoints; ii) an epidemiological study of natural history of disease; and iii) a survey of quality of life. The research decision not only requires consideration of each of these independent alternatives but also their possible combinations. The example demonstrates that where a number of different types of study informing different parameters in the decision problem could be conducted, the simultaneous estimation of ENBS across all dimensions of the design space is required to identify the optimal sample sizes and allocations within such a research portfolio.
The computational challenges of exploring these wider dimensions of design space are considerable. However, the use of more efficient algorithms to search the ENBS surface for its maximum rather then exhaustively search over such large dimensions makes this task feasible and substantially reduces computation time. In this example, multiple optimisation routines were used which appear to provide reliable estimates of optimal sample size, allocation and maximum societal payoff to research. Usefully they also provide a credible range for optimal samples sizes and social payoff. The computational burden of exploring design space can be made feasible by the selection of sufficient number of optimisation routines at a manageable MC resolution. Indeed, it is not really a question of whether it is feasible to explore these additional dimensions of design space, but rather a question of what precision is affordable.
References
Ades AE, Lu G, Claxton KP. (2004) Expected value of sample information calculations in medical decision modeling. Medical Decision Making 24 (2): 207-227.
Armitage P. (1985) The search for optimality in clinical trials. International Statistical Review 53: 15-24.
Bather JA. (1981) Randomized allocation of treatments in sequential experiments. Journal of the Royal Statistical Society (Series B). 43 (3): 265-292.
Berger JO. (1985) Statistical decision theory and Bayesian analysis. Springer Series in Statistics, 2nd edition, Springer-Verlag, New York, USA.
Bojke L, Claxton K, Sculpher MJ, Palmer S, Philips, Z. (2008) The cost-effectiveness and value of information associated with repeat screening for age related macular degeneration. Medical Decision Making 28: 33-43.
Brennan A, Kharroubi SA. (2007a) Efficient computation of partial expected value of sample information using bayesian approximation. Journal of Health Economics. 26: 122-148.
Brennan A, Kharroubi SA. (2007b) Expected value of sample information for Weibull survival data.
Health Economics 16 (11): 1205-1225.
Briggs A, Claxton K, Sculpher MJ. (2006) Decision analytic modelling for the evaluation of health technologies. Oxford University Press., Oxford.
Burls A, Clark W, Stewart T, Preston C, Bryan S, Jefferson T, Fry-Smith A. (2000) Zanamivir for the treatment of influenza in adults. Supplement to the NICE Technology Assessment Report. Available for download from http://guidance.nice.org.uk/.
Burls A, Clark W, Stewart T, Preston C, Bryan S, Jefferson T, Fry-Smith A. (2002) Zanamivir for the treatment of influenza in adults: a systematic review and economic evaluation. Health Technology Assessment. 6 (9).
Chalkidou K, Hoy A, Littlejohns P. (2007) Making a decision to wait for more evidence: when the National Institute for Health and Clinical Excellence recommends a technology only in the context of research. J R Soc Med 100 (10):453-60.
Chaloner K, Verdinelli I. (1995) Bayesian experimental design: a review. Statistical Science. 10(3): 273-304.
Claxton KP. (1999) The irrelevance of inference: a decision-making approach to the stochastic evaluation of health care technologies. Journal of Health Economics. 18: 341-364.
Claxton KP, Posnett J. (1996) an economic approach to clinical trial design and research priority setting. Health Economics. 5(6): 513-524.
Claxton KP, Sculpher MJ. (2006) Using value of information analysis to prioritise health research: some lessons from recent UK experience. PharmacoEconomics. 24 (11): 1055-1068.
Claxton KP, Thompson KM. (2001) A dynamic programming approach to the efficient design of clinical trials. Journal of Health Economics 20(5): 797-822.
Drummond MF, Sculpher MJ, Torrance GW, O'Brien BJ, Stoddart GL. (2006) Methods for the economic evaluation of health care programmes. Oxford Medical Publications, 3rd edition, Oxford University Press, New York, USA.
Eckermann S, Willan A. (2008) Time and expected value of sample information wait for no patient.
Value Health. In press.
Eckermann S, Willan AR. (2006) Expected value of information and decision making in HTA. Health Economics 16 (2): 195-209.
Felli JC, Hazen GB. (1998) Sensitivity analysis and the expected value of perfect information. Medical Decision Making. 18(1): 95-109.
Fenwick E, Claxton KP, Sculpher MJ. (2001) Representing uncertainty: the role of cost-effectiveness acceptability curves. Health Economics. 10(8): 779-787.
Fenwick E, Palmer S, Claxton K, Sculpher M, Abrams K, Sutton A. (2006) An iterative Bayesian approach to health technology assessment: application to a policy of preoperative optimization for patients undergoing major elective surgery. Medical Decision Making 26: 480-496.
Gelman A, Carlin JB, Stern HS, Rubin DB. (2004): Bayesian data analysis. Texts in Statistical Science Series, 2nd edition, Chapman & Hall, Boca Raton, USA.
Gilks WR, Richardson S, Spiegelhalter DJ. (1996) Markov chain Monte Carlo in practice. Interdisciplinary Statistics Series, Chapman & Hall, London, UK.
Glaxo Wellcome UK Limited (2000) Submission to the National Institute for Clinical Excellence for Relenza™ (zanamivir) in the treatment of influenza. First submission to the National Institute for Clinical Excellence. Glaxo Wellcome UK Limited.
Griffin SC, Claxton KP, Palmer SJ, Sculpher MJ. (2007): Dangerous omissions: the consequences of ignoring decision uncertainty. Re-submitted to Health Economics.
Griffin S, Welton N, Claxton K. Exploring the research decision space: the expected value of information for sequential research designs. Re-submitted to Medical Decision Making 2008.
Hammitt JK, Cave JAK. (1995): Research planning for food safety: a value of information approach. RAND, Santa Monica, USA.
Howard RA. (1966) Information value theory. IEEE Transactions on Systems, Science and Cybernetics. SSC-2 (1): 22-26.
Jones AM. (ed) (2006) The Elgar companion to health economics Edward Elgar, Aldershot, UK.
Meier CR, Napalkov PN, Wegmüller Y, Jefferson T, Jick H. (2000) Medical visits and drug utilization associated with influenza in the United Kingdom: a large population-based survey.European Journal of Clinical Microbiology & Infectious Diseases. 10(11): 834-842.
National Institute for Clinical Excellence (2000a) Hip disease - replacement prostheses. TA2. Available for download from http://guidance.nice.org.uk/.
National Institute for Clinical Excellence (2000b) Zanamivir for the treatment of influenza in adults. TA15. Available for download from http://guidance.nice.org.uk/.
National Institute for Clinical Excellence (2003a) Cervical cancer - cervical screening (review). TA69. Available for download from http://guidance.nice.org.uk/.
National Institute for Clinical Excellence (2004) Guide to the methods of technology appraisal. Available for download from http://www.nice.org.uk/.
Netton A, Dennett J. (1998) Unit costs of health and social care 1998/99. Kent, Personal Social Services Research Unit, University of Kent.
Neuman P, Claxton KP, Weinstein MC. (2000) FDA regulation of health economic information. Health Affairs. 19(5): 129-137.
Nocedal J, Wright SJ. (1999) Numerical optimization. Springer Series in Operations Research, Springer-Verlag, New York, USA.
Oakley JE. (2005) Decision-theoretic sensitivity analysis for complex computer models. Technical Report, Department of Probability and Statistics, University of Sheffield, UK.
O'Hagan A, Stevenson M, Madan J. (2005) Monte Carlo probabilistic sensitivity analysis for patient level simulation models: efficient estimation of mean and variance using ANOVA. Technical Report, Department of Probability and Statistics, University of Sheffield, UK.
Palmer SJ, Smith PC. (2000) Incorporating option values into the economic evaluation of health care technologies. Journal of Health Economics. 19(5): 755-766.
Parmigiani G. (2002) Modeling in medical decision making: a Bayesian approach. Statistics in Practice Series, John Wiley & Sons Ltd., Chichester, UK.
Pezeshk H. (2003) Bayesian techniques for sample size determination in clinical trials: a short review.
Statistical Methods in Medical Research. 12(6): 489-504.
Pratt JW, Raiffa H, Schlaifer R. (1995) Introduction to statistical decision theory. MIT Press, Cambridge, USA.
Philips Z, Claxton KP, Palmer SJ. (2008) The half-life of truth: what is the appropriate time horizon for research decisions? Medical Decision Making (in press).
Philips Z, Claxton KP, Palmer SJ, Sculpher MJ. (2006) Priority setting for research in health care: an application of value of information analysis to glycoprotein iib/iiia antagonists in non-st elevation acute coronary syndrome. International Journal of Technology Assessment in Health Care 22(3): 379-387.
Raiffa H, Schlaifer R. (2000) Applied statistical decision theory. Wiley Classics Library Series, Wiley-Interscience, New York, USA.
Schlaifer R. (1959) Probability and statistics for business decisions: an introduction to managerial economics under uncertainty. McGraw-Hill, New York, USA.
Shapiro A. (2000): Stochastic programming by Monte Carlo simulation methods. Stochastic Programming E-Print Series. Available for download from http://hera.rz.hu-berlin.de/speps.
Stinnett AA, Mullahy J. (1998): Net health benefits: a new framework for the analysis of uncertainty in cost-effectiveness analysis. Medical Decision Making. 18(2): S68-S80.
Thompson KM, Evans JS. (1997) The value of improved national exposure information for perchloroethylene (perc): a case study for dry cleaners. Risk Analysis 17(2): 253-271.
Thompson KM, Graham JD. (1996) Going beyond the single number: using probabilistic risk assessment to improve risk management. Human and Ecological Risk Assessment. 2(4): 1008-1034.
Whitehead J. (1997) The design and analysis of sequential clinical trials. Statistics in Practice Series, John Wiley & Sons Ltd., Chichester, UK.
Willan AR, Pinto EM. (2005) The value of information and optimal clinical trial design. Stat Med. 24:1791-806.
Yokota F, Thompson K. (2004) Value of information literature analysis: a review of applications in health risk management. Med Decis Making. 24: 287-298.