Focussed Hydrothermal Alteration in Upper
Crustal Oceanic Faults on Macquarie Island
VOLUME 2
Steven John Lewis,
B.
Sc. (Hons).
UNIVERSITY OF TASMANIA
Submitted in fulfilment of the requirements for the Degree of Doctor of
Philosophy
University of Tasmania (April, 2007)
Introductory note on thesis structure
Because of its length, this PhD dissertation has been hard-bound into two separate volumes. Volume 1 contains all of the preliminary thesis information (i.e., the Abstract, Table of Contents, List of Figures and Tables, and the Acknowledgments), as well as Chapters 1 to 6. Volume 2 follows consecutively onwards (page numbers) from the previous tome and
Chapter 7. — Whole-rock Geochemistry of
Focussed Alteration Facies
7.1. Introduction
Whole-rock geochemical data are widely used to investigate the effects of hydrothermal alteration in the ocean crust, and to help interpret the processes and products of fluid—rock interaction, e.g., Gillis and Thompson (1993), Humphris et al. (1998), Teagle and Alt (2004). Whole-rock data are particularly useful for evaluating element mobility in hydrothermal systems, and for recognising subtle geochemical signatures (alteration effects) that may otherwise remain undetected. During this project, major and trace element compositions were determined for representative whole-rock samples (focussed alteration fades) in the Major Lake, Caroline Cove, and Sellick Bay Fault Zones. Similar geochemical data were also collected for some spatially and genetically related lithologic domains, such as the Sandell Bay Sheeted Dyke Swarm (SBSD). The new analyses were supplemented by data from previous geological studies of Macquarie Island (e.g., Griffin and Varne, 1980; Griffin, 1982; Kamenetsky et al., 2000), and included an extensive set of whole-rock compositions (unpublished data) provided by Mr John Everard at Mineral Resources Tasmania.
Major and trace element compositions of hydrothermally altered volcanic rocks and sheeted dykes are used in this chapter to:
i. Characterise, evaluate, and interpret geochemical effects arising from the hydrothermal processes that formed the vein and breccia, quartz-chlorite (VQC) facies; the massive and veined, chlorite-quartz-pyrite (CQP) facies; and the vein-dominated, prehnite-zeolite (VPZ) facies;
Relate the whole-rock compositions of altered rocks in the VQC, CQP, and VPZ facies to their hydrothermal mineral assemblages;
Determine the primary (magmatic) geochemical signature of rocks within each fault zone (using immobile element ratios), and compare their respective host domains;
v. Derive characteristic and effective lithogeochemical criteria (such as alteration indices) for discriminating the VQC, CQP, and VPZ fades from their surrounding host rocks; and
vi. Assess the spatial extent of VQC fades alteration near the Major Lake Fault Zone (using the previously defined lithogeochemical criteria), specifically focussing on geochemical evidence for subtle fluid dispersion haloes in the surrounding footwall rocks.
7.2. Analytical methods
The major and trace element compositions of seventy-two whole-rock samples were measured by standard X-ray fluorescence (XRF) techniques at the University of Tasmania (Table 7.1). Comprehensive accounts of sample preparation procedures, analytical parameters, and data quality are presented in Appendix 5.1-5.3, together with descriptions of the analysed rock samples (Table A-5.1 to Table A-5.4). XRF analyses were used to determine concentrations of the major element suite: Si, Ti, Al, Fe, Mn, Mg, Ca, Na, K, P, and S, and the trace elements: Nb, Zr, Sr, Cr, Ba, Sc, V, Y, Rb, Zn, Cu, and Ni. In addition, selected trace element concentrations (Li, Mo, Ag, Cd, Sn, Sb, Te, Ta, Bi, Th, and U) were measured in ten samples from the CQP facies using the inductively-coupled-plasma mass spectrometry (ICP-MS) system at the Centre for Ore Deposit Research (Appendix 5.4). Commercial fire assay analysis was also undertaken on these ten samples to determine whole-rock concentrations of Au (Appendix 5.5).
7.3. Overview of whole-rock geochemistry data
Representative whole-rock compositions (mean and standard deviation data) for focussed alteration facies from the Major Lake, Caroline Cove, and Sellick Bay Fault Zones are presented in Table 7.2. New XRF data (this study) for the Sandell Bay Sheeted Dyke Swarm (the regional footwall of the Major Lake Fault) are also shown in Table 7.2. These geochemical data represent average whole-rock compositions derived from multiple sample analyses for each alteration fades or lithologic domain. Based on recommendations outlined in Gifkins et al. (2005) (regarding best practice for dealing with geochemical data derived from intensely altered rocks) the initial whole-rock data were not recalculated to volatile-free compositions or normalised using other data-handling techniques, e.g., Rollinson (1993). The complete XRF dataset
comprising seventy-two rock compositions is presented in Appendix 5 (Table 5.5 to Table A-5.7)*, together with comprehensive statistical information for these analyses (Table A-5.8 to Table 5.11). Location details are given in the main sample catalogue (Appendix 2; Table A-2.1).
Table 7.1: Summary of X-ray fluorescence (XRF) analyses for whole-rock samples from the Major Lake, Caroline Cove, and Sellick Bay Fault Zones.
Focussed alteration facies or
regional lithologic domain Structural system Main rock types Number of XRF analyses Comments
17 XRF analyses comprising 9 Two repeat samples were submitted to check for compositional samples from Site 2A and 8 variations and the analytical reproducibility for discrete samples samples from Site 2B (Table A-5.1) (MCQ-330 and MCQ-350).
Sandell Bay Sheeted Dyke Regional footwall adjacent to the Sheeted dolerite dykes and Swarm (SBSD) Major Lake Fault transition zone pillow basalts
Vein and breccia, quartz-
chlorite (VQC) facies Major Lake Fault
Sheeted dolerite dykes and transition zone pillow basalts
9 XRF analyses comprising 6 samples from Site 2A and 3
samples from Site 2B (Table A-5.2)
The abundance and intensity of quartz and pyrite veins, disseminated grains, and massive alteration patches varies for each VQC facies sample.
Foliated, massive chlorite
(FMC) facies Major Lake Fault Pillow basalt
2 XRF analyses from Site 2A (Table A-5.2)
Both FMC fades samples appear compositionally and texturally similar, and are typical of the exposed MLFZ core.
Massive and veined, chlorite- Caroline Cove Fault Pillow basalt and minor basaltic 26 analyses from the Caroline Cove Three CQP fades samples are affected by minor late-stage quartz-pyrite (CQP) facies hyaloclastite area (Site 3A) (Fable A-5.3) alteration of the PF0 fades (oxidation overprint).
Vein-dominated, prehnite- zeolite (VPZ) facies
Pillow basalt and minor basaltic 18 analyses from the Sellick Bay hyaloclastite escarpment (Site 1A) (Fable A-5.4)
The VPZ fades samples consist of moderately and strongly altered basalt, and many contain massive and vein phases. Sellick Bay Fault
Notes:
1. Samples from the SBSD, and the VQC and FMC facies, were collected during detailed and spatially well-constrained sampling transects across-strike of the Major Lake Fault Zone (MLFZ). Samples were systematically collected between 0-550 m from the MLFZ at Sandell Bay creek (Site 2A), and between 0-320 m from the MLFZ at Major Lake foreshore (Site 2B).
2. Location details for each rock sample analysed by XRF are listed in Appendix 2 and shown on the study site geology maps in Chapter 5.
Table 7.2: Whole-rock geochemical data (composite mean values and standard deviations) for alteration fades in the Major Lake, Caroline Cove, and Senick Bay Fault Zones.
Fault Zone Major Lake Fault 1 : 1 : Caroline Cove Fault 1 1 Sellick Bay Fault
Facies VQC FMC SBSD VQC SBSD CQP CQP CQP VPZ VPZ
Group < 48 % Si 48-55% Si > 55% Si Gp. I Gp. II
# of samples 6 2 9 3 8 7 11 8 8 10
Study site 2A 2A 2A 2B 2B 3A 3A 3A IA IA
Major elements by XRF (oxide wt. %)
5i02 54.99 (15.67) 47.75 (0.33) 48.31 (0.83) 74.94 (6.43) 48.79 (0.66) 45.09 (2.82) 50.94 (1.99) 70.31 (8.57) 47.67 (1.43) 41.26 (2.32)
TiO2 0.96 (0.37) 1.26 (0.01) 1.12 (0.21) 0.67 (0.32) 1.15 (0.23) 1.12 (0.52) 1.39 (0.38) 0.56 (0.36) 1.40 (0.14) 0.58 (0.42)
Al203 14.39 (5.61) 16.33 (1.21) 17.09 (2.05) 7.54 (2.66) 15.17 (0.37) 1 1.79 (5.57) 12.75 (3.26) 5.67 (2.67) 16.68 (1.27) 19.13 (2.56)
Fe203 4 12.65 (4.30) 8.64 (0.23) 8.51 (1.10) 6.60 (1.04) 9.93 (0.95) 17.91 (8.33) 12.96 (4.43) 11.73 (3.68) 8.12 (0.75) 7.64 (2.85)
MnO 0.27 (0.11) 0.17 (0.03) 0.16 (0.01) 0.17 (0.12) 0.19 (0.03) 0.18 (0.08) 0.22 (0.07) 0.12 (0.07) 0.16 (0.02) 0.14 (0.09)
MgO 6.48 (2.74) 7.79 (0.93) 7.81 (0.86) 3.23 (0.26) 8.62 (0.99) 7.00 (3.82) 8.05 (2.21) 3.60 (2.65) 6.75 (.032) 3.07 (2.52)
CaO 1.69 (1.14) 10.77 (1.04) 10.59 (0.82) 0.58 (0.36) 10.91 (0.36) 5.47 (5.24) 3.70 (2.42) 1.19 (1.75) 10.03 (0.85) 21.22 (4.52)
Na20 3.28 (1.7) 3.13 (0.35) 3.18 (0.43) 1.74 (1.39) 2.54 (0.65) 1.76 (1.28) 3.13 (1.07) 0.99 (1.07) 3.04 (0.86) 0.88 (1.03)
K20 0.24 (0.29) 0.18 (0) 0.40 (0.21) 1.03 (1.36) 0.34 (0.13) 0.10 (0.11) 0.13 (0.04) 0.05 (0.04) 0.52 (0.22) 0.02 (0.03)
F205 0.11 (0.05) 0.16 (0.01) 0.20 (0.14) 0.08 (0.05) 0.15 (0.04) 0.16 (0.06) 0.18 (0.08) 0.11 (0.08) 0.22 (0.03) 0.11 (0.05)
L.0.1 5 4.58 (1.18) 3.58 (0.08) 2.59 (0.71) 3.27 (0.89) 1.96 (0.30) 8.98 (4.88) 6.56 (1.37) 5.06 (1.37) 5.30 (2.49) 5.75 (1.27)
Total 99.65 (0.15) 99.77 (0.29) 99.95 (0.20) 99.50 (0.91) 99.77 (0.15) 99.55 (0.85) 100.01 (1.18) 99.37 (1.18) 99.89 (0.09) 99.80 (0.16)
Total S (wt. vo 0.94 (0.54) 0.02 (0) 0.09 (0.10) 1.37 (1.570 0.03 (0.05) 8.35 (9.59) 3.99 (2.65) 4.13 (2.65) 0.01 (0) 0.01 (0)
Fe/(Fe + Mg) 0.35 (0.08) 0.22 (0.02) 0.22 (0.02) 0.34 (0.03) 0.23 (0.02) 0.42 (0.24) 0.30 (0.21) 0.52 (0.21) 0.23 (0.01) 0.45 (0.22)
Trace elements by XRF (ppm)
Nb (1 ppm) g 10 (6) 10 (0) 14 (14) 7 (4) 9 (4) 10 (5) 13 (3) 6 (2) 18 (4) 8 (5)
Zr (1 ppm) 65 (26) 84 (1) 80 (27) 48 (24) 72 (18) 80 (38) 100 (28) 39 (26) 103 912) 41 (33)
Sr (1 ppm) 68 (44) 155 (1 1) 207 (73) 22 (18) 144 (30) 172 (194) 92 (45) 81 (93) 208 (74) 32 (19)
Cr (1 ppm) 291 (125) - 402 (131) 316 (44) 112 (21) 390 (234) 206 (109) 214 (94) 98 (62) 147 (25) 158 (139)
Ba (4 ppm) 81 (85) 52 (5) 174 (117) 105 (155) 77 (25) 522 (906) 327 (940) 3257 (6509) 109 (58) 8 (4)
Sc (2 ppm) 28 (12) 33 (1) 33 (5) 17 (7) 38 (2) 31 (12) 35 (8) 17 (7) 31 (2) 26 (12)
V (1 ppm) 202 (77) 245 (6) 226 (36) 139 (53) 259 (25) 265 (134) 262 (81) 167 (124) 235 (25) 216 (46)
Y (1 ppm) 18 (7) 26 (0) 24 (5) 10 (4) 25 (4) 25 (11) 28 (9) 18 (8) 28 (3) 14 (8)
Rb (1 ppm) 5 (6) 3 (0) 6 (4) 38 (0) 5 (2) 2 (1) 5 (2) 1 (0) 8 (6) b.d.
Zn (1 ppm) 241 (154) 63 (0) 85 (54) 2645 (4378) 65 (13) 316 (173) 529 (698) 312 (300) 62 (5) 28 (19
Cu (1 ppm) 368 (180) 70 (0) 53 (29) 410 (490) 78 (40) 49 (46) 42 (32) 4000 (10870) 56 (11) 67 (39)
Ni pprn) 72 (46) 145 (64) 1 02 (9) 33 (12) 119 (45) 84 (38) 87 (28) 38 (21) 70 (6) 72 (49)
Notes:
1. YQC = vein and breccia, quartz-chlorite facies; SBSD = Sandell Bay Sheeted Dyke Swarm;
CQP = massive and veined, chlorite-quartz-pyrite facies; VPZ = vein-dominated, prehnite-zeolite facies. FMC = foliated, massive chlorite facies
2. Gp I in the VPZ facies consists of pillow basalts that are moderately altered, and Gp II consists of pillow basalts that are intensely altered (many Gp. II samples contain abundant massive- and vein-phase material).
3. # of samples refers to the total number of whole-rock analyses undertaken for each facies group to derive the composite geochemical data presented here.
4. Total Fe expressed as Fe 203.
5. L.O.I. = loss-on-ignition (mostly volatile water and carbon dioxide component).
6. In addition to the L.O.I. value, the total S content (wt. °A) is also shown for each composite sample. 7. The Fe/(Fe + Mg) value is calculated using molar °/o data.
8. The trace elements determined by XRF are shown with their detection limit values in the adjacent brackets. 9. b.d. = trace element concentration is below the detection limit for the specific element.
To assist in classifying and interpreting the major and trace element data, samples from each facies were further subdivided (Table 7.2). The SBSD and VQC facies are grouped according to their respective site locations; either Sandell Bay creek (Site 2A) or Major Lake foreshore (Site 2B). Three compositional subgroups of the CQP facies (Group I, II, and III) are based upon relative abundances of Si02, which proxies for observed (hand-sample) variations in the amount of quartz alteration. Samples from the VPZ facies are subdivided on the basis of hand-sample observations of relative alteration intensity. Group I of the VPZ facies comprises the least altered basaltic rocks (primary igneous textures are commonly preserved), whereas VPZ Group II consists of intensely altered, massive and vein phase material dominated by hydrothermally derived minerals such as prehnite, zeolites, and Fe-oxyhydroxides.
Whole-rock compositions of altered rocks from each fault zone are highly diverse. Average concentrations of many major and trace elements vary between discrete facies, and also within each facies and their respective subgroups (Table 7.2). Geochemically, most of the altered fault zone rocks are significantly different from primary (magmatic) compositions defined by
(relatively pristine) Macquarie Island volcanic glass (Table 7.3). Qualitative trends of major element enrichments (compared to magmatic compositions) show that the geochemical composition of some fault zone rocks clearly reflects the dominant suite of alteration minerals. For example, major element compositions of basalts from the CQP facies commonly define partial mixing trends (direct lines or inter-mixed zones) that link the composition of the main hydrothermal minerals and their least altered precursors (Figure 7.1). Similar major element relationships are also qualitatively observed for some altered rock samples in the VQC and VPZ facies. A more detailed appraisal of major and trace element variations using quantitative (mass balance) techniques is presented and discussed in Chapter 7.5.
In summary, the most notable and distinctive characteristics of the whole-rock geochemical data obtained during this investigation are:
i. The highly elevated loss-on-ignition (LOT) values for the VQC, CQP, and VPZ facies, which commonly range from — 3-9 wt. %. In comparison, most regionally altered basalts and dykes on Macquarie Island have LOT values 5 2-3 wt. %, e.g., Griffin (1982). Typical LOI for Macquarie Island volcanic glass is < 1.0-1.5 wt. %
Table 7.3: Major and trace element compositions of volcanic glasses from Macquarie Island. Sample 47979 25637 G855 G882 47963 Av. G452 H135 38287 G492 25601 Av.
Group I I I I I Gp I II II II II II Gp II
Si02 49.56 49.30 48.31 47.94 48.18 48.66 49.96 50.58 49.74 49.65 49.16 49.82
TiO2 0.97 1.19 1.38 1.61 1.91 L41 1.35 1.72 2.10 1.63 1.75 L71
Ai2O3 17.09 17.25 17.77 17.96 18.17 17.65 15.49 15.03 15.97 17.27 17.52 16.26
Fe2O3 8.06 7.50 7.55 7.03 6.81 7.39 9.47 10.17 9.59 8.10 7.55 8.98
MnO 0.14 0.17 0.14 0.09 0.08 0.12 0.13 0.18 0.17 0.13 0.15 0.13
MgO 8.75 8.36 7.80 6.59 5.90 7.48 8.13 6.83 6.68 6.96 6.77 7.07
CaO 12.82 12.69 11.93 11.25 10.85 1L91 11.59 11.12 10.18 10.61 10.02 10.70
Na2() 2.37 2.58 2.99 3.57 4.24 3.15 2.60 2.54 3.37 3.29 3.70 3.10
IC20 0.14 0.42 0.75 1.29 1.76 0.87 0.12 0.20 0.66 0.82 1.10 0.58
P205 0.08 0.21 0.28 0.47 0.66 0.34 0.13 0.17 0.35 0.36 0.40 0.28
L.O.I 0.37 0.65 0.95 1.53 1.79 L02 0.43 0.59 1.07 1.03 1.32 0.90
Total 100.35 100.32 99.85 99.33 100.35 100.00 99.40 99.13 99.88 99.85 99.44 99.55
Total S 0.08 0.08 0.08 0.07 0.08 0.08 0.10 0.11 0.11 0.08 0.08 0.10
Fe # 0.32 0.31 0.33 0.35 0.37 0.33 0.37 0.43 0.42 0.37 0.36 039
Nb 7 25 44 70 91 47 6 11 39 41 54 30
Zr 55 77 90 130 163 103 72 110 160 131 146 124
Sr 155 246 335 555 703 399 111 141 225 367 443 257
Cr 357 320 224 155 133 238 339 257 223 304 207 266
Ba 39 134 242 444 584 289 31 54 190 249 337 172
Sc 34 32 30 27 24 29 36 38 32 29 27 32
V 210 220 205 186 178 200 283 317 299 217 210 265
Y 19 20 22 22 23 21 27 35 39 26 25 30
Rb 4 13 25 45 60 29 3 6 22 27 37 19
Zn 68 64 66 58 60 63 81 103 101 81 76 as
Cu 98 90 81 67 61 79 77 76 61 76 57 69
Ni 151 149 129 87 62 116 174 89 88 153 113 123
Notes:
1. Data obtained from Kamenetsky et al. (2000).
2. Group I = near-primitive glass compositions; Group II = 'fractionated' glass compositions. 3. L.O.I = loss-on-ignition.
4. Fe # = Fe / (Fe + Mg) in molar %.
S. The complete glass dataset of Kamenetsky et al. (2000) is considerably more diverse than shown here.
6. The trace element data shown above are similar to those determined for rocks from the Major Lake, Caroline Cove, and
Sellick Bay Fault Zones during this study.
The least altered rocks occur in the regionally altered Sandell Bay Sheeted Dyke Swarm (SBSD), which is the host domain for the VQC facies (Major Lake Fault Zone). Rocks from the SBSD have relatively low LOI values (commonly < 2-3 wt. %), and their major and trace element compositions are relatively similar to those of Macquarie Island glasses and other least altered basalts, e.g., J. Everard, unpublished data. These
geochemical characteristics strongly support the results arising from my field and petrographic studies (Chapter 5 and 6). Furthermore, they provide clear evidence that the focussed alteration fades are products of relatively more intense and robust
•
Field of least-altered basaltic rocks in Zone BVI.
Silica enrichment trend representing addition of massive and vein quartz.
•
•
•
•
•
•
• (:().1' lactc,
4..1,) Altcrcd b.i,:t1t, iii /Amt. It \ (.QP di nun!
•
•
I
QuartzI
A. 5
211 ill
• CQP fact,: built
Field of least altered
basaltic rocks in Zone BVI. • • •
i IC
20 60 80
SiO, (wt. °A)
•
Fe-enrichment trend associated with the formation of hydrothermal pyrite.
Chlorite
• Least altered basalts in Zone 13111 (CQP host domain)
•
•
Silica addition trend
•
•
•
•
reflecting quartz-rich alteration.•
•
Lartz 441
Pyrite
The Fe #'" value of basaltic rocks from focussed alteration facies is consistently higher than that of corresponding regional host domains, i.e., their least altered equivalents. For example, contrast the rocks from the VQC fades (most with Fe # values > 0.35) with the SBSD (mean Fe # = 0.23) (Table 7.2). These differences in Fe and Mg abundance are clearly unrelated to primary variations in igneous compositions (such as those caused by crystal fractionation or melt heterogeneities), as they variably effect volcanic rocks and dykes in each structural system. The Fe # variations suggest that Fe-enrichment (possibly coupled with Mg-depletion?) is an important hydrothermal characteristic of the focussed alteration assemblages. In the VQC and CQP fades Fe-enrichment reflects the presence of abundant hydrothermal pyrite and chlorite, whereas Fe-oxyhydroxide minerals are a common component of the VPZ facies;
iv. Many rocks from the VQC and CQP facies are highly enriched in Si02 relative to least altered basalts and other stratigraphically equivalent rocks in the same igneous package (Table 7.2). Similar to the variations in Fe noted above, the wide range of Si
compositions for the fault zone assemblages is not interpreted to represent the effects of primary fractionation or other igneous-related processes. In general, the magnitude of silica enrichment in each sample is directly related to the observed abundance (hand-sample and thin-section) of massive and vein quartz. This is well illustrated by the subgroup classification scheme devised for the CQP fades; most Group I (quartz-poor) rocks have mean 5i02 — 45 wt. °A, whereas Group III rocks (average — 70 wt. % SiO2) contain extensive quartz vein networks and irregular patches of massive quartz;
v. Altered rock samples that contain abundant quartz are also highly enriched in metallic trace elements such as Cu and Zn, e.g., basalts from the VQC fades and Group III in the CQP facies. Elevated base metal concentrations are presumably related to the abundance of sulfide minerals (e.g., pyrite), and provide further evidence for the positive correlation of quartz and sulfide compositions in the focussed alteration assemblages. Trace element enrichments in sulfide minerals from the VQC and CQP facies are further discussed in Chapter 8.3;
vi. Extensive pyrite alteration in the CQP fades (and minor barite) is reflected by significant concentrations of total sulfur, which commonly ranges from — 4-8 wt. %. Minor pyrite also occurs in the VQC facies (although considerably less abundant than at Caroline Cove), with average S concentrations — 1-1.5 wt. %. The elevated sulfur compositions are at least an order of magnitude greater than the amount of sulfur in least altered basalts and volcanic glasses (commonly 0.1 wt. °A S; Table 7.2). In comparison, the altered rocks from the VPZ and FMC fades lack sulfide minerals and
also have low sulfur concentrations more akin to typical MORB values, e.g., — 850 ppm background levels in MORE (Alt, 1995);
vii. The concentration of CaO in altered rocks from the VQC and CQP facies (commonly <2 wt. %) is substantially less than the average CaO content of regional basalts and volcanic glasses on Macquarie Island (— 10-12 wt. %; Table 7.3). As previously discussed in the mineral chemistry section (Chapter 6.4), primary Ca-rich plagioclase (An5o_90) is extensively recrystallised to albite (Ans_is) in these rocks which, combined with the paucity of newly formed Ca-rich phases (e.g., no abundant calcite or prehnite, and only minor epidote), provides evidence for the mass dissolution and removal of Ca from the fault zone assemblages. However, despite widespread albitisation (Na-enrichment), whole-rock Na concentrations are relatively similar in the focussed alteration zones and regional domains (this anomaly is further addressed in the mass balance section in Chapter 7.5). In contrast to the Ca-depleted facies, intensely altered VPZ basalts (Group II) commonly contain > 20 wt. °/0 CaO; this reflects abundant hydrothermal Ca-rich minerals such as laumontite (Ca-zeolite) and prehnite;
viii. The concentrations of Ti, Mn, K, and P are consistently low in each focussed alteration facies (mostly < 1 wt. % for their respective oxides) and compositionally similar to the least altered basaltic rocks and glasses. The relatively low and uniform concentrations of these major elements suggests they are not significant components of the
hydrothermal fluids that formed the main alteration assemblages, and are unlikely to have been extensively mobilised during fluid—rock interaction;
ix. Trace elements such as Y, Nb, Zr, and Sc also have relatively low and uniform
abundances in most of the fault zone and regional rocks (commonly < 50 ppm). These elements are commonly assumed immobile in submarine hydrothermal systems
(Gifkins et al., 2005), and the lack of significant variation from primary values typical of the Macquarie Island glasses provides initial evidence to interpret their immobility. The behaviour of these potentially immobile elements is further discussed in Chapter 7.5;
x. Extremely elevated Ba concentrations occur in many altered basalts in the CQP facies, i.e., commonly > 500 ppm and — 3200 ppm average in CQP Group III. Although volcanic rocks on Macquarie Island are relatively enriched in Ba compared to other mid-ocean ridge basalts* (in addition to also containing significantly elevated levels of related elements such as K and Rb; Kamenetsky et al., 2000), their primary values are significantly less than the highly enriched concentrations in many samples from the CQP facies. The elevated Ba concentrations probably relate to the presence of
hydrothermal barite, which occurs as a minor late-stage alteration mineral infilling cavities in earlier formed quartz veins (Chapter 6.3). Limited Ba enrichment may also be associated with hydrothermally derived K-feldspar, although this is far less abundant than barite. Barite was not observed (petrographically) in the VQC and VPZ fades, and both of these assemblages have relatively lower Ba concentrations that are also similar to the least altered rocks; and
xi. The ICP-MS and fire assay analyses of ten CQP fades samples (comprising whole-rock separates with abundant veins of quartz + pyrite) did not detect any significantly anomalous trace element compositions. Most elements analysed by ICP-MS (Li, Mo, Ag, Cd, Sn, Sb, Te, Bi, Th, U, and Au) have concentrations 5_ 1 ppm (Table A-5.6). One sample (MCQ-028) contains slightly elevated Mo, Ag, and Pb (18 ppm, 2 ppm, and 10 ppm respectively), and several other samples also contain relatively modest levels for some of these metallic elements (mostly < 10 ppm). Li is commonly in the range of typical MORB values, and varies from — 3-8 ppm (Teagle and Alt, 2004). The highest concentration of Au was 13 ppb; most other Au analyses were S 1 ppb (Table A-5.6). In comparison, most MORB's contain — 1.3 ± 1.7 ppb Au (Hatnlyn et al., 1985). Based on the lack of significandy anomalous or highly enriched trace element compositions from this reconnaissance study, these relatively expensive analytical techniques were not applied for whole-rock samples from the VQC or VPZ facies.
7.4. Primary magmatic signatures and protolith compositions
Prior to quantifying element fluxes which occurred during alteration (Chapter 7.5), it is first necessary to define a magmatic protolith; essentially a rock that has been unaffected by hydrothermal element exchange*. This precursor igneous composition is used to compare the abundance of major and trace elements in the altered rocks, and thus determine the relative magnitude of respective enrichments or depletions. However, as previously discussed in Chapter 3.7, the primary composition of Macquarie Island's MORB magmatism is highly unusual and characterised by small scale (domainal) spatial heterogeneities. Major and trace element compositions range from N—MORB to E—MORB, but extend beyond typical E—MORB to primitive, highly enriched and silica undersaturated variants (ICamenetsky et al., 2000). Thus, significantly different magmatic compositions potentially characterise discrete crustal blocks on Macquarie Island, and this primary geochetnical diversity has important implications for estimating the protolith composition of each fault system, especially if there are no relatively unaltered (proximal) stratigraphic equivalents available.
The potential for igneous rock compositions to vary on a relatively small scale (e.g., from one regional lithologic block to another) was highlighted by Davidson et al. (2004). Using ratios of potentially immobile elements that are unaffected by igneous fractionation but sensitive to primary melt variations (such as Zr/Nb), Davidson et al. (2004) showed that discrete fault-bounded blocks in central Macquarie Island have distinctive magmatic affinities (Figure 7.2). These geochemical trends were used to interpret primary source relationships for different crustal domains, and also provided further evidence to classify and discriminate the volcanic rock associations proposed by Goscombe and Everard (2001) (Figure 7.2).
O Zone BIV regional domain
• Zone BVa regional domain
• Zone BV-6 regional domain • Zone BVI regional domain
IT
ii
I-
n
il
0 to 2 2 to 4 4 to 6 6 to 8 8 to 10 10 to 12 12 to 14 14 to 16 16 to 18 18 to 20 20
Zr / Nb ratio
Figure 7.2: Frequency histogram of Zr/Nb ratios for basalts from discrete regional domains in central and southern Macquarie Island (refer to Figure 3.4 for domain locations). According to Davidson et al. (2004), variations in Zr/Nb largely reflect magmatic source characteristics and clearly show that the basaltic domain west of the Sandell Bay Sheeted Dyke Swarm (Zone BVb) is genetically related to the southern crustal block (Zone By!). These basaltic domains are compositionally distinct from crustal blocks to the east of the Major Lake Fault, such as Zone BVa and Zone BIV, and provide good evidence for primary melt-related heterogeneities on Macquarie Island (data after Davidson et al., 2004, refer to Kamenetsky et al. 2004 for further details on primary melt variations).
• Sandell Bay Sheeted Dyke Swarm VQC alteration facies These rocks occur in the same regional lithologic block Based on their similar Tt/Zr and Nb/Y values, all rocks are interpreted to be derived from a similar primary magmatic source.
Fractionation trend - dominantly controlled to the crystallisation of plagioclase (and minor clinopyroxene)
•
•
•
•
re°•
•
A.
Alteration trend - related to variations in rock mass during interaction of hydrothermal fluids and basaltic wall rocks.
Major Lake Fault Zone
15o
Al205 (wt. %)
/.one BN/1 regional domain :QP alicranon fames These rocks occur in the same regional lithologic block.. Based on their similar Ti/Zr and Nb/Y ratios, all rocks are interpreted to be derived from a similar primary magrnaoc source.
Alteration trend - related to variations in rock mass during interaction of hydrothermal fluids and basaltic wall rocks.
Caroline Cove Fault Zone
•
B.
Fractionation trend - dominantly controlled by the crystallisation of plagioclase (and minor chnopyrosene).
25 AI,0, (wt. %)
aphanitic to densely porphyritic varieties (plagioclase-phyric). Clearly, many basaltic rocks represent mixed compositions (melt + crystals) that have undergone fractional crystallisation. These effects are likely to be widespread across Macquarie Island, and occur between different lithological domains and also within discrete crustal blocks.
MORB compositions from the SMARK area (22°30' to 22°50' N) on the mid-Atlantic Ridge.
Fractionation trend - dnven manly
by the crystallIsanon of plagioclase
• • •
The chrecoon and slope of this fractionanon trend are smaktr to trends Identtfied for the Sandell Bay Sheeted Dyke Swarm and the Zone BV1 VOICall1C rock dorrram on Macquane Island (this study).
ole - roc k grochenucal data sourced from Meurer et al. (20)1).
A1,0, (wt. %)
Figure 7.4: The slope and magnitude of the fractionation trend identified for mid-ocean ridge basalts from the SMARK area (mid-Atlantic Ridge) are broadly similar to the inter-element affinities shown by the Sandell Bay Sheeted Dyke Swarm and the Zone BVI basaltic domain on Macquarie Island (Figure 7.3). These comparable data provide evidence that fractional crystallisation has occurred in the host rock domains of the VQC and CQP facies, and indicate that these effects must be taken into account when selecting protolith compositions for the mass balance investigation.
The spectrum of primary source compositions and the potential influence of fractional
crystallisation required special consideration when determining location-specific protoliths. The major fault systems studied during this project are 5-8 km apart and occur in different lithologic
domains (Chapter 3 and 5); these significant spatial and host rock variations intuitively suggest the need for different precursor compositions. To fully assess and better understand potential
source variations, whole-rock immobile element ratios sensitive to primary melt heterogeneities
(e.g., Ti/Zr vs. Nb/Y) were plotted and compared for each fault zone assemblage and other
Macquarie Island rocks, using data obtained from Griffin (1982), Kamenetsky et al. (2000), and J. Everard (unpublished) (Figure 7.5). Most basaltic rocks from the Major Lake, Caroline Cove,
and Sellick Bay Fault areas overlap with this diverse dataset and appear compositionally similar
to other upper crustal rocks on Macquarie Island. In particular, the fault zone rocks are
characterised by relatively low Nb/Y (< 1) and moderate Ti/Zr (80-100), and respective values for their mean and median ratios are all within error (Table 7.4). These trace element ratios also
correspond with the wide compositional range of fractionated N—MORB glasses from the
Group II suite defined by Kamenetsky et al. (2000), although they are considerably different from the primitive and enriched Group I variants (Figure 7.5).
Given the relative similarity of trace element ratios for the Major Lake, Caroline Cove, and
Sellick Bay Faults, there is scant geochemical evidence to interpret significant primary source
variations (melt-related) between the separate fault zone assemblages. However, as shown in Figure 7.3, fractional crystallisation has clearly affected discrete volcanic rock domains, indicating
• VQC facies • SBSD regional domain • CQP facies
Zone BVI regional domain VPZ facies
• Zone Bill regional domain Primitive glasses • Fractionated glasses • Ungrouped volcanic rocks
Ungrouped sheeted dykes Field of fault zone alteration facies from the MalOf Lake, Caroline Cove, and Sellick Bay Fault Zones (most data). Primitive melt trend defined by
Kamenetsky et al. (200)).
Fractionation trend
•
•
•
••
•
• •
•
4 •
• • • • •
SIPS • •
110 120
Ti! Zr ratio
•
••
Ti/Zr ratio
mean =
median=
std. dev. =
std. ernr = range =
minimum =
maximum =
Nb/Y ratio
mean =
median =
std. dev. =
std. error =
range =
minimum =
maximum =
[image:16.556.93.537.42.449.2]criteria that I used to determine these precursor compositions prior to the mass balance investigation are outlined in. the following section.
Figure 7.5: Volcanic rocks, basaltic glasses, and sheeted dykes on Macquarie Island have diverse immobile element ratio compositions. However, most of the VQC, CQP, and VPZ facies basalts plot within a relatively well constrained compositional field typical of fractionated N-MORB's from Macquarie Island. These data are significantly different from the most primitive and enriched glass compositions identified by Kamenetsky et al. (2000). The data plotted here were obtained from this study, Griffin (1982), Kamenetsky et al. (2000), and J. Everard (unpublished).
Table 7.4: Summary statistics for trace element ratio data (Ti/Zr and Nb/Y) used to interpret primary melt-related source variations on Macquarie Island.
Major Lake Fault district SBSD and VQC facies (n = 26)
Caroline Cove district CQP facies (n = 26)
Sellick Bay district VPZ fades (n = 11)
91 86 84
93 84 83
11 9 15
52 50 72
56 79 44
108 129 116
0.55 0.47 0.54
0.41 0.40 0.58
0.35 0.33 0.23
0.07 0.07 0.05
1.48 1.83 0.77
0.17 0 17 0 18
Criteria for estimating protolith compositions
Using geochemical data for upper crustal rocks on Macquarie Island (obtained from this study and J. Everard, unpublished data), I derived major and trace element compositions (mean values) for basaltic protoliths from the Major Lake, Caroline Cove, and SeHick Bay districts (Table 7.5). Compatible—incompatible immobile element plots (such as those shown in Figure 7.3) clearly indicate that rocks from each regional domain represent a discrete group of fractionated basalts (N—MORB's). However, distinctive linear alteration trends for each fault zone assemblage (orthogonal to the fractionation line) intersect the fractionated series within a relatively limited compositional range, e.g., < 20 ppm Zr variation (Figure 7.3). These consistent relationships suggest that most strongly altered rocks in the focussed hydrothermal fades are derived from a similar segment of the primary fractionation group*. Thus, geologically valid protoliths can be established by selecting basalts from the main fractionation trend that coincide (within error) with the relatively restricted compositional range defined by the intersection of the fractionation and alteration series. In addition, the following selection criteria were also applied to the whole-rock geochemical data to ensure that the most appropriate regional basalts were used to derive the precursor compositions:
i. Only relatively unaltered basaltic rocks were considered, based on an upper limit of 2.5 wt LOT. Although these rocks are not pristine (i.e., variably affected by low grade regional alteration), their compositions are clearly most akin to those of the primary basaltic melts;
Spatial information for all of the least altered regional rocks was assessed, and only those samples hosted in the same lithologic domain as each fault zone were selected, e.g., only Zone BVI basalts (Hurd Point association) were used for estimating the protolith composition of the CQP facies at Caroline Cove. This procedure was undertaken for each fault zone and crustal block, and preference was given to regional samples occurring in relative proximity to each fault; and
Moderately to densely porphyritic rocks were excluded from consideration to minimise further compositional bias related to primary magmatic processes such as crystallisation.
By applying these criteria to the regional whole-rock data I was able to derive the most
geologically valid and locally specific (precursor) basaltic compositions for each fault zone (Table 7.5). Major and trace element concentrations of the three protoliths are consistent with the MORB spectrum, and also fall within the typical compositional range of least altered whole- rocks and basaltic glasses on Macquarie Island (Table 7.3).
Table 7.5: Major and trace element compositions of least-altered rocks used to estimate local protolidis for the Major Lake, Caroline Cove, and Senick Bay Faults.
Fault Sample Map Rock
Major Lake Fault Zone Caroline Cove Fault Zone SeHick Bay Fault Zone
LB 31 5 SD LB327 6 SD LB394 6 . SD LB434 5 SD MLFZ protolith mean std.
CC175 6 AP-MB CC182 6 AP-PB HP10 7 SP-PB
HP185 CCFZ protolith
6
SP-PB mean std.
MQ-303 4 SP-PB MCQ-271 4 SP-PB SBFZ protolith mean std. East 490890 490240 490300 488620 (n = 4) dev. 488910 486940 489030 487020 (n = 4) dev 488620 489185 (n = 2) dev. North 3938190 3936970 3936820 3940260 3933210 3933900 3930320 3933600 3946050 3945965
Si02 49.95 49.13 48.74 49.75 49.39 0.56 48.99 49.86 49.62 48.49 49.24 0.62 47.81 48.35 48.08 0.38 TiO2 1.27 1.24 1.28 1.26 1.26 0.02 1.60 1.71 1.51 1.60 1.61 0.08 (28 1.39 1.33 0.08
M203 14.30 15.57 15.88 16.47 15.56 0.92 15.35 14.49 14.83 16.24 15.22 0.76 17.45 18.41 17.93 0.68 Fe203 9.74 8.85 9.03 8.52 9.04 0.52 10.49 11.33 10.26 10.36 10.61 0.49 8.22 7.55 7.88 0.48
MnO 0.17 0.16 0.16 0.17 0.17 0.01 0.18 0.17 0.19 0.19 0.18 0.01 0.13 0.16 0.14 0.02 MgO 8.26 8.42 8.19 7.58 8.11 0.37 7.05 5.92 6.84 6.37 6.55 0.50 7.68 6.85 7.26 0.59
CaO 10.43 11.72 11.63 11.73 11.38 0.63 11.09 11.16 9.74 10.80 10.70 0.66 11.96 10.79 11.38 0.83
Na20 3.03 2.66 2.61 2.24 2.64 0.32 2.94 3.06 3.94 3.26 3.30 0.45 2.86 3.49 3.17 0.44
K20 0.22 0.20 0.13 0.22 0.19 0.04 0.16 0.19 0.34 0.28 0.24 0.08 0.20 0.25 0.22 0.03 P205 0.18 0.22 0.23 0.24 0.22 0.03 0.27 0.28 0.24 0.26 0.26 0.02 0.25 0.20 0.23 0.03
L.O.I 1.60 1.65 1.55 1.29 1.52 0.16 1.05 0.72 1.66 1.17 1.15 0.39 1.48 2.63 2.05 0.82
Total 99.15 99.82 99.43 99.47 99.47 0.28 99.16 98.87 99.18 99.02 99.06 0.14 99.97 100.05 100.01 0.06 S 0.07 0.11 0.07 0.08 0.08 0.02 0.09 0.13 0.12 0.09 0.11 0.02 0.09 0.01 0.05 0.06
Nb 9 13 14 20 14 5 15 15 10 10 13 3 16 17 16 1
Zr 87 90 92 96 91 4 100 115 105 105 106 6 89 105 97 11
Sr 185 150 155 155 161 16 150 145 210 140 161 33 175 249 212 52
Cr 61 175 260 380 219 135 115 135 145 170 141 23 280 177 228 73
Ba 46 47 49 41 46 3 82 98 81 71 83 11 74 99 87 18
Sc 45 36 33 35 37 5 41 42 37 ao ao 2 31 33 32 1
V 280 250 280 260 268 15 340 340 310 330 330 14 240 230 235 7
Y 29 29 29 29 29 0 32 36 35 37 35 2 26 28 27 1
Rb 3 3 3 3 3 o 5 6 14 14 10 5 6 3 s 2
Zn 44 71 57 83 64 17 97 96 100 97 98 2 69 61 65 6
Cu 55 68 61 83 67 12 58 63 60 55 59 3 52 66 59 10
Ni 69 89 125 130 103 29 75 43 82 83 71 19 140 76 108 45
Notes:
1. SD = sheeted dolerite dykes; AP-MB = aphyric massive basalt; AP-PB = aphyric pillow basalt; SP-PB = sparsely-phyric pillow basalt.
Z Most of these least-altered whole-rock compositions for Macquarie Island basalts and sheeted dolerite dykes were provided by John Everard at Mineral Resources Tasmania.
3. The average Major Lake Fault Zone (MLFZ) protolith composition was used for mass-balance calculations for the VQC fades and the SBSD domain. 4. The average Caroline Cove Fault Zone (CCFZ) protolith composition was used for mass-balance calculations for the CQP facies.
5. The average Sellick Bay Fault Zone (SBFZ) protolith composition was used for mass-balance calculations for the VPZ fades. 6. All of the mass balance calculations used Zr as the immobile reference element.
7.5. Quantifying major and trace element variations
Overview
Quantifying the transfer of elements (enrichments or depletions) during hydrothermal alteration
generates important information to better understand the processes and effects of fluid—rock interaction. Mass—transfer techniques are an established and valid tool for estimating total mass
(or volume) changes associated with hydrothermal activity (MacLean and Barrett, 1993). These
methods also eliminate analytical problems associated with the constant sum effect (closure),
which may otherwise mask significant variations in unprocessed concentration data (Stanley and Madeisky, 1996). In addition, quantified element changes are easily related to hydrothertnal
mineral assemblages, and may also provide important insights into physico-chemical fluid
conditions. Many previous studies of oceanic rocks affected by hydrothermal activity (including modern seafloor settings and ancient ophiolites) have successfully applied mass balance
techniques to quantify and interpret variations in element fluxes, e.g., Shriver and MacLean
(1993), Skirrow and Franklin (1994), Teagle and Alt (2004).
Several techniques have been used to evaluate mass transfer in hydrothertnal systems following
the initial graphical-based approach developed by Gresens (1967). These have included the isocon method modified from Gresens work, e.g., Grant (1986); Huston (1993), and Pearce
Element Ratio Analysis (Stanley and Madeisky, 1996). With reference to Gifkins et al. (2005), I chose to use the single precursor method of MacLean and Barrett (1993) to quantify element
fluxes associated with the VQC, CQP, and VPZ facies. This technique is relatively easy to apply
and consistently produces geologically valid results for oceanic rocks affected by submarine hydrothermal activity (W. Herrmann, 2003, pers. comm.). The MacLean and Barrett (1993)
method relies upon the identification of a suitable protolith composition (Chapter 7.4), and also
incorporates rigorous evaluation of element mobility as a standard procedure.
Mass—balance method
Having evaluated primary source rock variations and fractionation effects, and derived separate protolith compositions for each fault zone (Chapter 7.4), the next step in the MacLean and
Barrett (1993) technique involves testing for and selecting an immobile reference element. By definition, immobile elements neither gain nor lose mass during hydrothermal alteration (Barrett
and MacLean, 1994). Although the total proportion of immobile elements in an altered rock
may vary because of other (mobile) element variations, their primary inter-element ratios are
essentially fixed. Thus, a proportioning factor can be determined by normalising the immobile element concentration in the altered rock with its unaltered protolith concentration. This factor
can then be applied to the other elemental components of the rock, and the magnitude and
Previous studies of oceanic rocks altered by submarine hydrothermal activity have shown that Al, Ti, Zr, Nb, and some heavy rare-earth-elements (e.g., Lu, Yb) are commonly immobile, even in high temperature upflow zones at elevated water—rock ratios (Barrett and MacLean, 1994; MacLean and Kranidiotis, 1987). During this investigation the mobility of Al, Ti, Zr, Nb, Y, Sc, and V was rigorously tested (regression analysis) for the VQC, CQP, and VPZ fades, along with their least altered host rocks. Bivariate scatter diagrams (with axis origins intersecting at zero) were constructed for each element pair to identify correlated linear trends. Although there is typically minor data scatter, possibly arising from minor analytical errors and slight
heterogeneities, linear correlation coefficients (r) for immobile element pairs should exceed 0.85 (Barrett and MacLean, 1994).
Detailed statistical appraisal of the regression analyses indicated that Zr and Ti were consistently immobile in each facies, with r values commonly > 0.95*. However, incompatibility of Ti during crystallisation of tholeiitic basalts produces a positive slope on the primary fractionation trend (Ti—Zr covariation plots), which is potentially very similar to the expected alteration trend. Thus, it is difficult to distinguish alteration from fractionation, and many researchers suggest that Zr—Al plots are most suitable for defining clear alteration trends in basalts (MacLean and Barrett, 1993). As previously discussed (Chapter 7.4), the Al—Zr plots clearly discriminated between alteration and fractionation effects in the VQC and CQP fades, and Zr was accordingly selected as the immobile reference element for their respective mass balance investigations (Figure 7.6). However, the corresponding bivariate element plot for the VPZ fades (Sellick Bay Fault Zone) contrasts significantly with the other fault zone assemblages. Basalts from the regional VPZ domains (Zone BIII and BVa) plot along an interpreted fractionation trend, and the least altered rocks from the SBFZ also plot within this group. However, the most intensely altered rocks of the VPZ fades do not define a typical linear alteration trend, i.e., they do not originate from the least altered compositional field and extend towards the origin of the inter-element plot. Instead, most are characterised by relatively increased concentrations of Al and lower Zr, and appear to represent a broad extension of the primary fractionation trend (Figure 7.7). The atypical distribution of these strongly altered samples is interpreted to result from their high proportions of hydrothermally derived components. Many (so-called) VPZ fades 'whole-rock' samples consist predominantly of massive- and vein-phase alteration minerals such as prehnite and zeolites, and actually contain very little material which could be considered as 'altered' basalt. The significantly greater amounts of Al (and less Zr) in these samples (relative to the primary basalts) may imply limited element mobility on a small-scale (perhaps only a few centimetres from wall rocks to veins), or that Al was mostly added from an unrelated source. Whatever the scenario, given the highly anomalous nature of these inter-element relationships and their
12 16 20
4)4b.
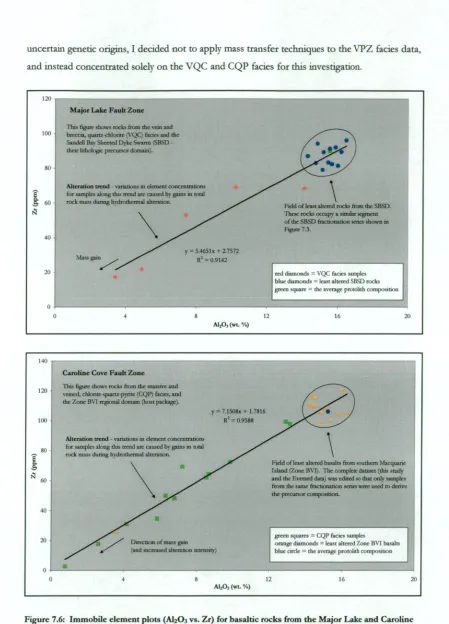
Field of least altered rocks from the SI3SD. These rocks occupy a similar segment of the SBSD fractionation series shown in Figure 7.3.
Major Lake Fault Zone
This figure shows rocks from the vein and breccia, quartz-chlorite (.1, QC) lanes and the Sandell Bay Sheeted Dyke Swarm (SBSD - their lithologic precursor domain).
Alteration trend - variations m element concentrations
for samples along this trend are caused by gams in total rock mass during hydrothermal alteration.
y = 5.4651x + 2.7572 = 0.9142 Mass gim
12
Al203 (wt- "/s)
21
60
red li13111.11dS N facie, ,amples blue than-14,11,1s least altered SIN ) r■,ck,
green square the average protollth "up
Caroline Cove Fault Zone
This figure shows rocks from the massive and veined, chlorite-quartz-pyrite (CQP) facies, and the Zone B31 regional domain (host package).
y = 7-15081 + 1.7816
112 = 0.9588
Alteration trend - variations in element concentrations
for samples along this trend are caused by gains in total rock mass during hydrothermal alteration.
Field of least altered basalts from southern Macquarie Island (Zone BV1). The complete dataset (this study and the Everard data) was edited so that only samples from the same fractionation series were used to derive the precursor composition.
• 7 Direction of mass gam (and increased alteration intensity)
grvvn squares = CQP facies samples
tailyr diamonds = least altered Zone BVI basalts
him t-thic the average protolidi composition
•
Al201 (vrt.
[image:21.562.66.515.25.649.2]uncertain genetic origins, I decided not to apply mass transfer techniques to the VPZ fades data, and instead concentrated solely on the VQC and CQP facies for this investigation.
Schick Bay Fault Zone
Fractionation trend - least
altered basaltic rocks m the -xi host package for the VW facies in the Sellick Bay Fault Zone.
Field of massive and vein-rich samples with abundant hydrotherrnally derived inmerals such as prehnite, zeohtes, and Fe-oxyhydroxides.
20 A1105 (wt. -0)
25
200
alteration tames
- Zone Bill and Bra &anal',
Expected alteration trend related to mass gam from least altered basalts, but devoid of VPZ fades samples.
Figure 7.7: The Al—Zr bivariate diagram for the VPZ facies in the Sellick Bay Fault Zone (SBFZ) contrasts significantly with similar plots for the VQC and CQP facies (Figure 7.6). Although a typical fractionation affinity group exists, no sample compositions plot along the expected alteration trend. Instead, the hydrothermally derived samples from the SBFZ define a relatively broad field with elevated levels of Al and low Zr at the lower end of the fractionation trend. The inter-element relationships shown here indicate that samples dominated by hydrothermal components such as prehnite and zeolites were not derived by simple mass gains related to the alteration of local basaltic protoliths. The anomalous nature of this plot cautioned against the use of the MacLean and Barrett (1993) mass transfer method for altered rocks from the Sellick Bay Fault Zone.
With protolith compositions and immobile reference elements selected for the VQC and CQP facies (Table 7.5), the absolute mass change for each elemental component can be calculated
using the 'reconstructed composition' equation given by MacLean and Barrett (1993):
a= [Zo / Z. x Cal - Co
Where:
= the absolute mass change (expressed in grams per 100 grams for major elements and grams per 1 x 10⁶ grams for trace elements);
Z6 = the proportion of the selected immobile element (Zr) in the precursor rock;
Z. = the proportion of the selected immobile element (Zr) in the altered rock sample;
C. = the proportion of the quantified elemental component in the altered rock sample; and
Co = the proportion of the quantified elemental component in the precursor rock.
Mass—balance results
Mass—balance calculations were undertaken using the major and trace element compositions of
selected samples from the VQC facies (seven whole-rock samples) and CQP facies (nineteen whole-rock samples). These calculations were restricted to samples derived from the same
Net mass change mean = median = std. dev. =
n = n = 5 n
+ 129 g/ 100g + 110 g/ 100g + 420 100g +690g/ 100g +35g/ 100g +9g/ 100g + 4g/ 100g + 112g/ 100g + 170 g / 100 g + 175 g / 100g + 99g/ 100g + 1367 g / 100 g
(Table 7.5 and Figure 7.6). A summary of the mass change characteristics for the VQC facies (combined data for Site 2A and Site 2B) and the three CQP facies subgroups are presented in Table 7.6, highlighting the relative magnitude of major and trace element variations (enrichments and depletions) and the net mass change. Graphical representations of these composite results (mean values) are shown in Figure 7.8-7.11. The results of individual mass change calculations for each whole-rock sample (total of twenty-eight samples) are given in Appendix 5 (Table A-5.12 and A-5.13), along with summary statistics for the major and trace element variations in each fades subgroup (Table A-5.14 to A-5.17). Appendix 5 also contains mass change graphs compiled for each whole-rock sample from the VQC (Figure A-5.1) and the CQP fades (Figure A-5.2).
Table 7.6: Mass change summary for major and trace elements in the VQC and CQP facies.
VQC fades CQP — Group I CQP — Group II CQP — Group III Site 2A and 2B <48 wt. % Si02 48-55 wt. % Si02 >55 wt. % Si02
Moderate to strong
enrichment Si Si, Fe
Zn, Cu, (Ba, Cr) (Ba), Zn, Cr, Ni
Si, Fe, S (> 30 % relative
change)
Zn, (Ba), Cr, Ni Cu, Zn, (Ba, V, Cr, Ni, Sr)
Slight to moderate
enrichment Fe, LOI S, LOT, Mg LOT, Mg
Si, LOT, Fe, S
(5-30 % relative V, Rb (Cu)
change)
No significant mass variation
Ti, Al, Mn, Mg, Na, K, P, S Nb, Sc
Ti, Al, Mn, Na, K, P Nb, Sc, Y
Ti, Al, Mn, Mg, Na, P Nb, Sc, Y
Ti, Al, Mn, Na, K, P Nb, Sc, Rb
Slight to moderate
depletion Ca Ca Ca
Ca
(5-30% relative Rb Rb, (Cu
change)
Moderate to strong depletion (> 30 % relative change)
Sr (Sr, V) (Sr, V)
Notes:
1. Element mass changes were calculated using the single precursor method of MacLean and Barrett (1993), with Zr selected as the immobile reference element Graphical representations are shown in Figure 7.8 and 7.9.
2. The behaviour of each element shown here is based on the mean variation data. Major and trace elements are grouped separately, and the element list is ordered to reflect relative variations in magnitude.
loo
na 7i
I I
25
VQC facies (Site 2A and 2B) Ermr 110.1 (red) - S. and Net
Ilmn- Ns 2 nellnn, ither rknients
Si Ti Al Fe MII M2 N K P LOI S Net
MAjor elements
Si Ti Al Fe Mn Mg Ca Na K P WI S Net
CQP facies - I
(<48 wt. % Si02)
Frrm hot (red) -Net
Error her 2 - elements
Major elements I in
Figure 7.8: Mass change plots (mean data) for major and trace elements in the N"QC. facies - Major Lake Fault Zone (standard error values shown for all elements on error bars).
CQP facies — II (48-55 wt. % Si0 2)
I
575
linorter -A element. except 6S (-2214 tad Net PM
111
1JIL
CI ,II 1
,—
Si Ti M Fe Mn Mg ir Na IC P WI S Net
Major elements
Mass
c
ha
ng
e (g
/
100
g
)
150
125
100
75
it)
Trace elements
Masa
c
hang
e
(g
I
1 x
1 g
)
11111
94
400
BS)
200
,
71
1114)
Nb Sr el Be
100
Sc V Y ltb Zat ,
Bs (-11700), Zs (-470) sod Co 5(75%) Ernst bar - demean exccist
[image:25.829.9.820.66.489.2]143
1Figure 7.10: Mass change plots (mean data) for major and trace elements in Group II of the CQP fades - Caroline Cove Fault Zone (standard error values shown on error bars.
CQP fades - III (>55 wt. % Si02)
Discussion of mass—balance results
Consistent enrichment and depletion trends are evident for the major and trace element suite (composite data) of both the VQC and CQP fades. The strong correlation between intensely altered rocks (hand-sample and thin-section petrographic observations) and the most significant levels of mass change provides clear evidence that the major trends are directly related to
hydrothermal processes. Although minor variability exists from sample-to-sample because of the heterogeneous nature of subseafloor alteration, most fades groups have multiple major and trace elements that have undergone significant mass change. Confirming the initial qualitative assessment, these element variations are directly related to the major suite of alteration minerals that characterise the VQC and CQP fades. In particular, moderate to strong enrichments in Si, Fe, and S (commonly > 30 g/100 g) directly reflect their respective quartz + chlorite + pyrite-dominated mineral assemblages (Figure 7.12).
The main geochemical effects related to alteration in the Major Lake and Caroline Cove Faults are broadly similar to those previously documented from modem (seafloor) hydrothermal systems, e.g., the Galapagos Fossil Hydrothermal Field between 85° 49' W and 85° 55' W on the Galapagos Rift (Embley et al., 1988; Ridley et al., 1994), and the Bent Hill Massive Sulfide Deposit (Middle Valley) on the Juan de Fuca Ridge (Teagle and Alt, 2004). Mass balance studies on altered basalts from these hydrothermal upflow zones showed relative enrichments in LOT, S, and many metallic elements (e.g., Fe, Cu, Mo, and V), coupled with strong depletions in alkali element concentrations, e.g., Ca and K (Humphris et al., 1998). Commonly, the levels of Si enrichment or depletion are highly variable (from site-to-site and for individual samples) and depend largely on the magnitude and intensity of quartz or amorphous silica alteration. For example, Zierenberg et al. (1995) discussed extreme silica enrichment and extensive cation depletion in altered basaltic fault talus at the Sea Cliff hydrothermal field on the Gorda Ridge (north-eastern Pacific Ocean). In each case, and similar to the results of investigation, the main geochemical variations (especially the major elements) are readily related to the dominant suite of alteration minerals.
In summary, the main trends and interpretations arising from the results of the mass balance study are:
i. Loss-on-ignition (LOT) is consistently enriched in most samples from the VQC (— 5 %) and CQP (commonly 20 %) fades, reflecting the abundance of volatile components in their main hydrothermal minerals (as previously discussed). Thus, LOI represents a
•
A small degree of error probably affects the mass-change results of some samples. These errors are inherent in the methodFe-rich silicate field, e.g., Fe-chlorite
S
• VQC alteranon lanes
• CQP alteration fines
• Sandell Bay Sheeted Dyke Swarm
S
(g
/
10
0
g
)
40 60 80
A Fe203 (g / 100 g)
100 12
I : 1 Fe to S addition line
Pyrite dominated field
.LT7
major (and readily quantifiable) component of these focussed assemblages, and is a distinctive compositional feature of the altered fault zone rocks;
Figure 7.12: Intensely altered basalts of the CQP facies (and to a lesser extent the VQC facies) are characterised by significant mass gains in total Fe and S. This bivariate mass change plot shows a strong correlation between Fe and S enrichment, although most Fe-rich rocks in the CQP facies have gained relatively more Fe than S. This ratio implies Fe addition occurs in excess of the total amount required to form pyrite, with excess Fe probably incorporated into silicate minerals such as chlorite and epidote. The strong enrichment in Fe is unrelated to igneous fractionation, as all mass balance
calculations were undertaken on rocks from a similar segment of the regional fractionation series. The quantified addition of significant amounts of Fe in these fault hosted alteration facies provides further geochemical evidence to support the petrographic observations (note that total Fe addition is shown here as Fe203).
Significant variations in the magnitude and direction of elemental change for some individual samples (relative to the average facies trends of Table 7.6) are mainly caused by the diverse abundance and non-uniform distribution of the main hydrothermal minerals. Alteration heterogeneity is an intrinsic feature of the VQC and CQP assemblages and is commonly manifested as compositional disparity; this occurs between different outcrop sites, within separate sections of each alteration zone, and from sample to sample. Variable mineral abundances have significant implications for the element mass changes calculated for each sample, and are particularly critical for major components such as Si and Fe. For example, whole-rock samples in the VQC and CQP facies that contain widespread quartz alteration (vein networks and massive enclaves) have gained significant quantities of Si02, such as MCQ-146 and MCQ-184 which both have > 100 % Si enrichment (Table A-5.13). In contrast, groundmass-dominated samples in the CQP facies, which mostly lack free quartz, have commonly lost minor amounts of silica (— 2-3 % depletion for MCQ-051 and MCQ-054 in the CQP facies). Removal of Si from these samples is interpreted to mainly result from extensive chloritisation of primary igneous components in the basaltic groundmass, such as volcanic glass and plagioclase. Some of the silica mobilised into hydrothermal fluids by this process may be re-precipitated during later quartz-forming stages,
potentially providing an important local source of Si02 within these alteration zones (in addition to the Si-dominated discharge fluids derived from deeper in the crust);
iv. Many altered basalts in the CQP facies have gained significant amounts of S; average group additions are — 20 %, with sample MCQ-027 enriched by 185 % (Table 7.6 and Table A-5.13, Figure 7.9-7.11). Despite the widely observed association of quartz + pyrite alteration in the CQP facies, S addition is a fundamental process for most Group I (relatively low silica rocks), Group II (intermediate Si), and Group III (abundant quartz alteration) rocks. Extensive S enrichment in all subgroups indicates that sulfide minerals are abundant throughout the CQP facies, and that they occur commonly in both the groundmass- and quartz-dominated (altered) rocks. Minor barite (sulfate-bearing phase) also occurs in many quartz-rich rocks in the CQP facies, and locally contributes to enriched sulfur compositions in some samples. In contrast, the magnitude of S enrichment in the VQC facies is significantly less, with mean S enrichments < 2 °A) (maximum — 5 %). Distinct variations in S enrichment trends support the hand-sample and thin-section observations of relative pyrite concentrations (Chapter 5 and 6), and provide geochemical evidence that sulfide minerals are abundant (and fundamental) components of the CQP facies;
maximum of 10 g / 100 g (Table A-5.13). Three VQC facies samples have also gained — 2 % MgO, although most are slightly depleted (< 5 % mass loss). Recognising whole-rock Mg addition in the focussed alteration zones (however modest the levels of enrichment) provides important evidence to help interpret the origins of their parent fluids. The high temperature and chemically evolved hydrothermal fluids (discharge- style) which are typically associated with focussed upflow zones contain negligible concentrations of Mg, e.g., < 1 um/kg (Scott, 1997). This results primarily from earlier fluid—rock reactions in the oceanic crust (e.g., during hydrothermal recharge), when aqueous Mg (originally derived from seawater) is fixed in low temperature alteration minerals such as smectite (Alt, 1995). Thus, although discharge-style hydrothermal fluids are implicated in the formation of the CQP fades (based on their distinctive geological characteristics and mineral assemblages as previously discussed), it is highly unlikely that they contained sufficient Mg to contribute to its net mass addition in the host rock package of the Caroline Cove Fault.
There are several processes which may account for the quantified addition of Mg in the CQP facies, including mixing between compositionally disparate fluids (rich and Mg-poor) and the local remobilisation (and reprecipitation) of whole-rock Mg from nearby stratigraphic levels. Seawater entrainment in the uppermost sections (near seafloor) of structurally focussed oceanic conduits, and subsequent mixing with high temperature discharge fluids (Mg-poor), has been proposed as an important genetic process for many mid-ocean ridge hydrothermal systems, such as the TAG mound (Honnorez et al., 1998; Humphris et al., 1998; Humphris and Tivey, 2000). Unmodified seawater is relatively enriched in Mg (52.7 mmol/kg; Scott, 1997), which suggests that widespread fluid mixing plays an important role in forming Mg-bearing alteration minerals at these shallow crustal levels. Thus, the enriched whole-rock Mg concentrations in many altered CQP facies basalts may indicate that unmodified seawater was involved in the formation of the Caroline Cove Fault Zone. Alternatively, significant quantities of Mg may have been leached from proximal basaltic wall rocks in the host domain (Zone BVI) and transported a relatively short distance before precipitating as new bearing minerals (e.g., Mg-chlorite) in the CQP fades zone. The merits of these models are further explored in the Caroline Cove discussion section, when all of the integrated geological and geochemical evidence is considered (Chapter 9);
vi. There are relatively few major or trace elements which were mobilised during hydrothermal alteration and subsequently depleted in the fault zone rocks. The main exception is Ca, which is consistently depleted in many basaltic rocks by — 10 g / 100 g in the VQC facies and — 8 g / 100 g in the CQP fades. These Ca losses are mirrored by corresponding levels of Sr depletion, with average Sr loss — 100 g / 106g (VQC) and