Three Student Tasks in a Study of Distribution in a “Best Practice”
Statistics Classroom
Anthony Bill University of Tasmania
<afbill@utas.edu.au>
Jane Watson University of Tasmania
<jane.watson@utas.edu.au>
Three selected student tasks from a 2-week study of the statistical concept of distribution in Year 9 class are examined. The tasks considered the exclusion of outliers, analysis of data using a semi-formal framework (GICS) developed for this study, and comparing two distributions. The pedagogy was modelled on current statistics education research best practice, with an emphasis on the cultivation of classroom dialogue where students explain and justify their positions. Fathom™ software was used by the students in a computer laboratory, and as a teaching aid in the classroom to support learning.
Distribution is a statistical concept that considers a data set as entire aggregate, with its own characteristics of measures of centre, such as mean and median; of measures of spread, such a density; and the shape of the distribution such as that known, for example, as a normal distribution. This comprehensive conceptual entity requires simultaneous consideration and integration of all aspects of the data set. This is a demanding task for students. Sophisticated statistical tools such as standard deviation, taught normally at senior high school, might support analysis, but at the expense of developing more intuitive notions of the data set. Current education research considers whether the use of semi-formal analysis in middle school might provide the essential intuitive foundation for semi-formal statistical analysis that students will encounter in the senior school years.
Three tasks from a two-week study program are presented. The “Students’ height” task provided an opportunity for a structured discussion of a data set using formal and informal measures; the “Weighing a small mass” task examined students’ understanding of data outliers; and the “Reaction time” task extended these two tasks to compare two distributions. The theoretical background, the results, and the discussion are based on the three tasks presented sequentially. The theoretical background begins with a discussion of what current statistical education research considers as best practice teaching, as this best practice teaching philosophy provides the foundation for the teaching unit used in the research. Examples of students’ work are included for discussion. Worksheets were evaluated using the SOLO taxonomy.
Theoretical Background
Current statistics education “best-practice” teaching differs from traditional
and median, giving scant regard to variability and, by implication, distribution (Shaughnessy, 2006). Mathematics teaching generally encouraged a quick response to a problem rather than a reflective and thoughtful analysis (Shaughnessy, 2006). Traditional assessment focused on the correct application of formulas, and the accuracy of computations and of graphs, but this provided only limited information on the students’ statistical reasoning (Garfield 2003).
Contemporary statistics education research is remarkably consistent in relation to recommended pedagogy. Five key features of best teaching practice are identified:
1. Engage students with data and concepts – the “big ideas” of statistics – such as variation and distribution (Ben-Zvi, 2000; Franklin & Garfield, 2006).
2. Provide active learning opportunities (Franklin & Garfield, 2006) and authentic data analysis (Groth, 2006) with real or “messy” data sets and meaningful tasks in a context that students can understand and value.
3. Develop a culture and habits of enquiry and statistical process (Franklin & Garfield, 2006); use whole class discussion where students must construct arguments and justify their positions (Groth, 2006). Chance (2002) argued that the mental habits and problem solving skills needed to think statistically should be deliberately taught as it should not be assumed that students would naturally develop these habits through the statistics course. A significant barrier to the enculturation process is that students may lack the vocabulary to express statistical opinions confidently. Teachers should provide students with a working – not necessarily formal – statistical vocabulary. Bakker and Gravemeijer (2004) recommended that students be allowed to use statistical terms loosely, or encouraged to use informal terms, such as “spread out,” or “clumped,” to describe distributions. Statistical terms would be used with greater precision as students’ statistical sense developed. 4. Utilise technology tools that allow students to visualise and explore data by providing different representations of the same data set (Ben-Zvi, 2000; Franklin & Garfield, 2006) and to move back-and-forth between the various representations of the data (Bakker & Gravemeijer, 2004). Fathom™ offers these, and other features. 5. Use assessment that genuinely measures student learning and development
(Chance, delMas, & Garfield, 2004) and that accurately conveys to the student what is important (Garfield, 1995).
Students’ interpretation of data sets was supported in the current study by the GICS
simple framework that is transferable, and the acronym GICS is easily remembered. The iterative nature of this process is designed to reduce the cognitive load on the students.
Students’ understanding and use of outliers is not well represented in the current
statistics education research literature. Groth (2006) and Ben-Zvi (2000) consider outliers in the relation to context of a statistical problem, and how placing the data set in context was a feature that distinguishes statistics from mathematics. Konold and Pollatsek (2002) argued that to exclude outliers requires an implicit model of the data aggregate; to develop an implicit model implies students must also develop a critical or intuitive sense of the data aggregate. This is consistent with research recommendations that students use authentic data sets (Watson, 2006). In this study outliers are considered to be questionable, rather then extreme, values.
Students’ understanding and use of measures of centre to compare two distributions
has been examined in the literature (e.g., Watson & Moritz, 1999). Konold and Pollatsek (2002) introduced the concept of average as signal within a “noisy” data set. Gal (cited in Watson & Moritz) demonstrated that students at Year 9 level were familiar with both the concept and the algorithmic processes to calculate the mean. All three studies reported surprise that the mean was not widely used to compare data sets. Watson and Moritz suggested this may have been a direct consequence of traditional statistics teaching’s emphasis on the algorithm to calculate mean, rather than on the development of a deep understanding of the concept of mean.
Method
The sample was a Year 9 class in a metropolitan co-educational high school in Hobart.
The classroom component of the research study was taught by the first author as a two-week teaching unit using “best practice” principles identified by statistics education research. These principles emphasise the development of statistical habits of mind through active learning, whole-class discussion and appropriate technology that allows students to explore data sets. The software, Fathom™, a product of Key Curriculum Press (Finzer, 2005), was introduced and used throughout the program.
The group was defined as an extended mathematics class, but the colleague teacher believed the group was of mixed ability as students had self-selected to enrol in the course. Of the 29 students enrolled, 8 were female and 21 were male, and the students averaged 14 years old. Not all students completed all the tasks presented here. Students were assigned an identification code based on their birth-date and their initials. Of the 15 tasks examining the statistical concept of distribution assigned to the students, three are presented here.
Task 1: Students’ heights –Introduction to the GICS framework
height of 170 cm…” the observation was recorded under the appropriate heading; in this instance, as a Measure of Centre.
( )
count = 26
student_height
155 160 165 170 175 180 185 190 195
student_height Dot Plot
[image:4.595.88.495.108.275.2]
Figure 1. Students’ heights
Task 2: Weighing a small mass – Students’ understanding of outliers
This task was taken from the Statistical Reasoning Assessment (SRA) (Garfield, 2003). Students are asked to consider whether to include, or exclude, an outlier when calculating the mean. The SRA was designed for undergraduate students, but this item is suitable for high school students. The task was given as part of a pre-test and consequently represents students’ understanding of outliers before the teaching unit conducted as part of the research study.
A small object was weighed on the same scale separately by nine students. The mass (in grams) recorded by each student is shown below:
3.2, 3.0, 3.0, 8.3, 3.1, 3.3, 3.2, 3.15, 3.2
The students want to determine as accurately as they can the actual mass of this object. Of the following methods what would you recommend they use?
a. use the most common number, which is 3.2 grams b. use 3.15 because it is the most accurate weighing c. add up all the numbers and divide by 9
d. throw out the 8.3 , add up the other 8 numbers and divide by 8
Task 3: Reaction times – Comparing two distributions
The third, and culminating, task assessed students’ development in the use of the GICS framework (Task 1) and an awareness of outliers (Task 2) to compare two distributions. Students compared two distributions to determine whether male or female students had faster reaction times. Students’ reaction times were measured by the time taken to respond – by clicking a computer mouse – to the sudden appearance of an image on a computer screen. The data were obtained from the CensusAtSchool program web-site (Australian Bureau of Statistics, 2006). The students were familiar with both the data and the method of collection as they had performed the Reaction time test several weeks prior to the research study. Scaffolding for the task was provided by a Fathom™ file containing a dot plot of the data and a set of prompting questions. The task was conducted under traditional examination conditions in a computer laboratory using Fathom™.
effectively; thirdly, students examined the two distributions using the GICS framework; and finally students compared the two distributions using a variety of informal, and formal, statistical measures. The use of the GICS framework provided a structure for the analysis. Shifting the emphasis from analysis to decision making was designed to demonstrate an application beyond the statistics classroom.
The evaluation of students’ responses was informed by the SOLO taxonomy (Biggs &
Collis, 1982) and the statistical appropriateness of the response. The SOLO taxonomy has been used extensively in the statistics education literature (e.g., Watson & Moritz 1999) as a means of evaluating students’ responses in statistics education by examining how the elements of a task are used and integrated. In this study a simplified three-tiered structure – unistructural, multistructural and relational – was used to code students’ responses. A unistructural response employs only one element in the task and does not identify any contradictions; a multistructural response uses at least two elements, often in sequence and identifies but does not resolve any contradictions; and a relational response is distinguished by the effective integration of many elements and resolution of any contradictions to complete the task (Watson, 2006).
Results
Task 1: Students’ heights –Introduction to the GICS framework
[image:5.595.85.528.503.628.2]In the context of this task with a high degree of scaffolding it was expected that students would describe several features of the data set as shown in Figure 1. Unistructural responses allowed for several specific and unrelated comments to be made. Multistructural responses added a sequential aspect whereas relational responses were considered to integrate the information and draw out implications not specifically represented in the graph.
Table 1
SOLO Evaluation of Students’ responses to Task 1
SOLO level No. of students % Criteria
U 4 20% Provides a limited and incomplete description; does not demonstrate a deep understanding of statistical measures used. M 10 50% Uses a variety of statistical measures within the GICS framework
to describe the data, but the description is incomplete or repetitive.
R 6 30% Comprehensively describes the data by selecting and combining all relevant statistical measures within the GICS framework.
Total 20 100%
Student G2203A provided a unistructural response presenting the information as a series of disconnected facts, as shown by the description of mean and median. The student neglected to provide a global view of the data, and only used the range to describe the spread of the distribution. The student recognised the value of graphical representation. Statistics are quoted to an inappropriate three decimal places.
Student K2504B’s multistructural response considers the maximum and minimum values, and the range. Two measures of spread are used, but the student does not explicitly consider the spread in relation to a measure of centre such as the mean.
The tallest height in our class is 189 cm and the shortest is 160 cm. this means that the range of heights is 29 cm. For the measure of centre there is the median : which is 172.5 cm (and) mean: which is 172.308. There is 22 people between 165-180 and there is 12 people between 170-175.
Student Y2206D provided a relational response. The student clearly grasped the essence of the data set by including the student’s own height in relation to the data aggregate, gave a global view, considered the extreme values in relation to the main body of the data, and used measures of centre and spread appropriately. The standard of written expression was also very good.
This graph shows the height of our Maths class. In our class the range is 160 cm (the shortest person) – 189 cm (the tallest). My height is 175 cm and the average height is 172.3 cm. So I am over the average height. The mean is 172.5 cm and if we were to go 5 cm either side of that there would be 16 students heights, mine included. Therefore 88% of the class is 5cm above or below the mean. Only 4 students are shorter than 165 cm or taller than 180 cm.
Task 2: Weighing a small mass – Students’ understanding of outliers
Of the 25 students responding to this task 14 preferred to include the outlier (response (c)) when calculating the mean. Two students selected the mode (response (a)), and 9 selected the preferred solution of excluding the outlier (Task 2, response (d)).
The belief that all data should be included in calculation was fiercely defended by several students in a lively whole-class discussion reviewing the test question. As one student said:
But if you don’t use all the values you can get the answer you want; it’s a bit like cheating.
Task 3: Reaction times – Comparing two distributions
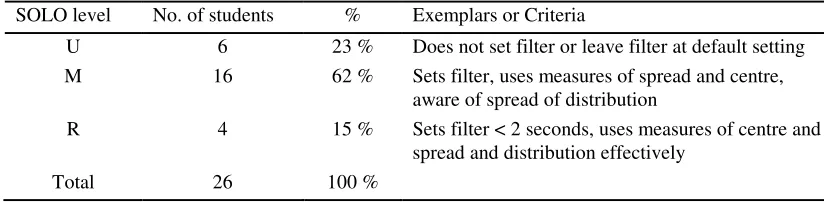
[image:6.595.81.493.625.726.2]Setting the filter was a critical step in the students’ task in comparing two distributions. The actual physical test suggested an appropriate filter setting of approximately one second. Students’ responses were categorised into fully confident exclusion of outliers, partial exclusion of outliers, or no exclusion of outliers (Table 2). Students who did not set the filter or left the filter at the default setting were considered to give a unistructural response. None of the students explicitly used their own personal experience of the Reaction time test as a method of determining a legitimate reaction time.
Table 2
SOLO Evaluation Reaction Times
SOLO level No. of students % Exemplars or Criteria
U 6 23 % Does not set filter or leave filter at default setting M 16 62 % Sets filter, uses measures of spread and centre,
aware of spread of distribution
R 4 15 % Sets filter < 2 seconds, uses measures of centre and spread and distribution effectively
Student L2103S provided a unistructural response in Figure 2. The filter was left at the default value of 20 seconds “…because there were no (higher) results…” suggesting the student did not have either a sense of the data or an understanding of the purpose of using the filter. Using the unfiltered data to calculate the mean, the student concluded that females were faster. Statistics were quoted to the default, and inappropriate, six decimal places. The graph scale was adjusted to a finer scale, but all data were displayed.
Reaction_time_Right_Hand Gender, ="male"
( )
mean = 0.716444
Gender="male"
( )
count = 45
F
em
al
e
M
al
e
0 2 4 6 8 10 12 14 16
Reaction_tim e_Right_Hand
CensusAtSchool Dot Plot
[image:7.595.90.523.167.355.2]Reaction_time_Right_Hand<20
Figure 2. Student L2103S reaction Times
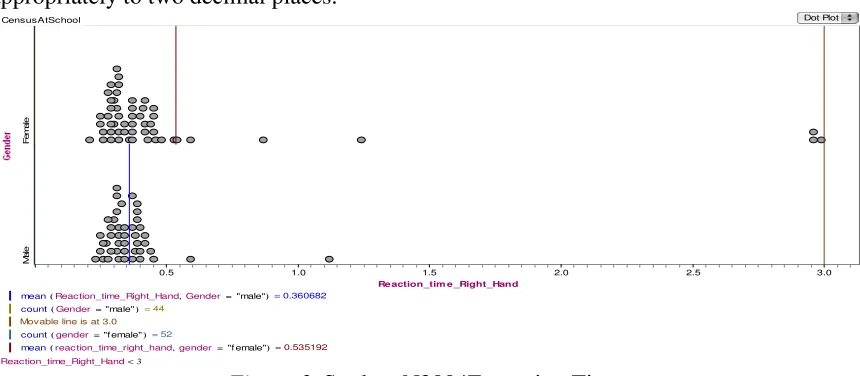
Student N2004E provided a multistructural response in Figure 3. The filter and the range on the graphs were both set at 3 seconds. The filter was set on the basis that only one data point was excluded. The student examined both the mean and the range, and noted that the male reaction times were more consistent than the females. Statistics were quoted appropriately to two decimal places.
Reaction_time_Right_Hand Gender, ="male"
( )
mean = 0.360682
Gender="male"
( )
count = 44
Movable line is at 3.0 gender="female"
( )
count = 52
reaction_time_right_hand gender, ="f emale"
( )
mean = 0.535192
Fe
m
al
e
M
al
e
0.5 1.0 1.5 2.0 2.5 3.0
Reaction_tim e_Right_Hand
CensusAtSchool Dot Plot
Reaction_time_Right_Hand<3
Figure 3. Student N2004E reaction Times
[image:7.595.90.520.450.638.2]Of particular interest was the student’s awareness of sample size, and the subtle observation that the female distribution had two modes. The information was used appropriately to reach the conclusion “…males are faster, but the times are close…”
Reaction_time_Right_Hand Gender, ="male"
( )
mean = 0.343023
Gender="male"
( )
count = 43
reaction_time_right_hand Gender, ="female"
( )
mean = 0.35766
gender="female"
( )
count = 47
F
em
al
e
M
al
e
0.2 0.3 0.4 0.5 0.6
Reaction_time_Right_Hand
CensusAtSchool Dot Plot
[image:8.595.76.507.142.310.2]Reaction_time_Right_Hand<0.7
Figure 4. Student R2808N reaction times
Discussion
The teaching unit that was the foundation of the research study was designed to provide, or refresh, the skills required to complete the complex task of comparing the two distributions. Two of the 15 preliminary tasks in the teaching unit are presented here. These tasks were selected as pre-requites for students to complete the culminating “Reaction time” task; and the three tasks presented here collectively allowed researchers to evaluate individual student’s understanding and development. Consistent with statistical education “best practice” described in the theoretical background, the tasks were not designed to evaluate students’ computational skills or procedural competence, but to assess students’ understanding of the statistical concepts under examination.
Use of the GICS framework
Students used GICS extensively in the first, highly supported task. Students had little difficulty categorising features of the graph as global, individual, measures of centre or measures of spread. As a research instrument the value of this task lay in identifying what students selected for inclusion in their written analysis when all the information had been discussed, and notes taken, in the classroom.
Despite prompting, the GICS framework was less well utilised in the final task. There was a sense within the student group that the true objective of the task was the final conclusion, rather than articulating the process of analysis. This could be addressed by providing students with an assessment rubric that emphasised the value of interpretation of the data sets. It could also be argued that students’ desire to reach a conclusion is also, to a degree, a product of their experiences of traditional teaching with its emphasis on a “correct” answer rather thoughtful analysis.
effectively to display the data; for example, failure to spread out the two sets made visual comparison of the two data sets difficult.
Students’ understanding of outliers
Students’ development of understanding of outliers may be observed by comparing students’ responses to the “Weighing a small mass,” conducted as part of the pre-test, and responses to the “Reaction times” task, conducted as the final assessment task. Of the 24 students who completed both Tasks 2 and 3, 38% eliminated the outlier in Task 2, whereas 68% did so in Task 3.
Setting the filter, to exclude outliers and include only legitimate data, was a critical step in the analysis of the “Reaction time” data set. None of the students explicitly stated the use of their own personal experiences of the Reaction time test as a means of identifying a legitimate reaction time. Students’ interpretation of outliers lay on a continuum of not excluding any data points, excluding only one, or a few, to setting a filter appropriately at a time of one second. To a degree this reflected a student’s own confidence. Many students considered an outlier as one, or a few data points, rather than considering what data should legitimately be included in the analysis. In an earlier classroom discussion students were generally reluctant to exclude any data, on the basis that information could be manipulated to achieve any desired result. Two students noted eliminating outliers affected the mean. Several students confused changing the scale with using a filter to remove outliers.
“Messy” data with outliers encourage students to examine critically the raw data. This should not be seen exclusively as a preliminary step, but as an integral part of the analysis process. If students, according to Gal (cited in Watson & Moritz, 1999), must develop an intuitive model of the data aggregate before excluding outliers, it could be argued that failure to do so may indicate that the student has not cultivated that intuitive sense.
Comparing two distributions
Students’ use of mean and median to compare two distributions in this study was significantly more extensive than that found by Gal (cited in Watson & Moritz, 1999). Two significant differences exist between the two studies: Gal worked with Year 7 students – two years junior to this study group – and in this study the mean was provided Fathom™ so students did not need to consider both the effort and the value of calculating the statistic.
The responses conveyed a sense that students felt they were expected to give a definitive answer. Students concluded there was a difference in the male and female reaction time, but such a conclusion could not be justified by more rigorous statistical analysis. Students’ tendency to provide a definitive response may also be a product of traditional statistics teaching.
Conclusion
All three tasks were designed to encourage “sense-making” and the development of intuitions. Scenarios – such as the “Students’ height” and “Weighing a small mass” – and the use of Fathom™ to assist in the calculation of statistics, potentially encourage “sense-making” as students are largely freed of the mechanics of data processing. The tasks collectively provided opportunities to demonstrate all five recommendations of “best-practice” identified in the theoretical background. The GICS framework and the consideration of whether to include, or exclude, particular values (outliers) may also encourage sense-making. When comparing two distributions, calculating the difference as a percentage of the means – a task within the ability of Year 9 students – may provide a foundation for the development of the concept of standard deviation.
Acknowledgement. This research was conducted by the first author as part of a
Bachelor of Teaching (Honours) program under the supervision of the second author.
References
Australian Bureau of Statistics. (2006). Sample reaction times: Australian CensusAtSchool data set. Retrieved June 12, 2006, from http://www.abs.gov.au/websitedbs/cashome.nsf/home/data%20samples Bakker, A., & Gravemeijer, K.P.E. (2004). Learning to reason about distribution. In D. Ben-Zvi & J. Garfield
(Eds.), The challenge of developing statistical literacy, reasoning and thinkin, (pp.146-168). Dordrecht, The Netherlands: Kluwer.
Ben-Zvi, D. (2000). Towards understanding the role of technological tools in statistical learning.
Mathematical Thinking and Learning, 2(1&2), 127-155.
Biggs, J. B., & Collis, K. F. (1982). Evaluating the quality of learning. The SOLO taxonomy (Structure of the
Observed Learning Outcome). New York: Academic Press.
Chance, B. L. (2002). Components of statistical thinking and implications for instruction and assessment.
Journal of Statistics Education, 10(3). Retrieved June 10, 2006, from
http://www.amstat.org/publications/jse/v10n3/chance.html
Chance, B., delMas, R., & Garfield, J. (2004). Reasoning about sampling distributions. In D. Ben-Zvi & J. Garfield (Eds.), The challenge of developing statistical literacy, reasoning and thinking (pp. 295-324). Dordrecht, The Netherlands: Kluwer.
Finzer, W. (2005). Fathom™: Dynamic data software. Emeryville, CA: Key Curriculum Press.
Franklin, C. A., & Garfield, J. B. (2006). The Gaise project – Developing statistics education guidelines for grades pre-K-12 and college courses. In G. F. Burrill & P. C. Elliott (Eds.), Thinking and reasoning with
data and chance: Sixty-eighth yearbook (pp. 345-376). Reston, VA: NCTM.
Garfield, J., & Ben-Zvi, D. (2004). Research on statistical literacy, reasoning, and thinking: issues, challenges, and implications. In D. Ben-Zvi & J. Garfield (Eds.), The challenge of developing statistical
literacy, reasoning and thinking (pp. 397-410). Dordrecht, The Netherlands: Kluwer.
Garfield, J. (1995). How students learn statistics. International Statistical Review, 63(1), 25-34.
Garfield, J. (2003). Assessing statistical reasoning. Statistics Education Research Journal, 2(1), 22-38, Retrieved June 12, 2006, from http://fehps.une.edu.au/serj
Groth R. E. (2006). Engaging students in authentic data analysis. In G. F. Burrill & P. C. Elliott (Eds.),
Thinking and reasoning with data chance: Sixty-eighth yearbook (pp. 41-48). Reston, VA: NCTM.
Konold, C., & Pollatsek, A. (2002). Data analysis as the search for signals in noisy processes. Journal for
Research in Mathematics Education, 33, 259-289.
Mokros, J., & Russell, S.J. (1995). Children’s concept of average and representativeness. Journal for
Research in Mathematics Education, 26, 20-39.
Shaughnessy, J.M. (2006). Research on students’ understanding of some big concepts in statistics. In G. F. Burrill & P. C. Elliott (Eds.), Thinking and reasoning with data and chance: Sixty-eighth yearbook (pp. 77-98). Reston, VA: NCTM.
Watson, J. M. (2006). Statistical literacy at school: growth and goals. Mahwah, NJ: Lawrence Erlbaum. Watson, J. M., & Moritz, J. B. (1999). The beginning of statistical inference: Comparing two data sets.