Hierarchical Task Analysis: Developments, Applications and Extensions.
Neville A. Stanton BITlab
Human Factors Integration Defence Technology Centre School of Engineering and Design
Brunel University Uxbridge Middlesex
UB8 3PH UK
Hierarchical Task Analysis (HTA) is a core ergonomics approach with pedigree of over thirty years continuous use. At its heart, HTA is based upon a theory of performance and has only three governing principles. Originally developed as a means of determining training requirements, there was no way the initial pioneers of HTA could have foreseen the extent of its success. HTA has endured as a way of representing a system sub-goal hierarchy for extended analysis. It has been used for a range of applications, including interface design and evaluation, allocation of function, job aid design, error prediction, and workload assessment. Ergonomists are still developing new ways of using HTA which has assured the continued use of the approach for the foreseeable future.
Keywords: tasks analysis, goals, hierarchy, HTA
1. Origins of Task Analysis
According to Kirwan & Ainsworth (1992), HTA is the "best known task analysis technique" (page 396). As such, it is probably a special case in the ergonomics repertoire of methods. Since the first paper written on the specification for the method in 1967 by Annett and Duncan, the past 37 years have seen many developments in ergonomics research and methods. Despite this, HTA has
The origins of all modern task analysis techniques can be traced back to the scientific management movement in the early 1900s (Annett & Stanton, 1998, 2000). The three figures that stand out from this time are Frank and Lillian Gilbreth and Frederick Taylor. The Gilbreths sought to discover more efficient ways to perform tasks. By the- way of a famous example of their work, Frank and Lillian Gilbreth observed that bricklayers tended to use different methods of working. With the aim of seeking the best way to perform the task, they developed innovative tools, job aids and work procedures. These innovations included: scaffolding that permitted quick adjustment, shelves for bricks and mortar, and methods for getting the bricks and mortar to the bricklayers by lower paid labourers. The net effect of these changes to the work meant that the laying of a brick had been reduced dramatically from approximately 18 movements by the bricklayer down to some 4 movements. The task was therefore performed much more efficiently. The principle underlying this work was to break down and study the individual elements of a task. The
individual elements (called Therbligs - a reversal of Gilbreth - such as 'grasp' and 'assemble') were recorded against time, hence the phase 'time-and-motion' study (Gilbreth, 1911). Annett (2000) notes that whilst most of the therbligs refer to physical movement, there were some 'cognitive' therbligs, such as 'search, 'select', and 'find'. The scientific management community, with which Frederick Taylor's name is inextricably linked, sought to apply the rigour of scientific method in the analysis of work. At the heart of this approach was serious analytical critique of the details of methods for working: How was the work performed? What was needed to perform the work? Why was the work performed in this way? How could the working methods be improved? Modern task analysis methods have retained this general approach to task critique. Annett (1996) has certainly argued that HTA encourages the analyst to consider not only what should happen, but what does actually happen and how this can go wrong. He suggests that these questions will arise naturally as the analyst seeks to discover the indicators for success and failure of each of the sub-goals.
influenced by Lillian Gilbreth's profession as a psychologist. This latter approach is much closer to the heart of modern ergonomics. In the century that has passed since these original pioneers of task analysis, several important changes have taken place. Annett (2000 - CTA book) cites several influences that have contributed to early thinking in HTA. In the 1950s, Ergonomics was emerging as a distinct discipline, but drawing on contemporary trends in psychology and engineering. A few of these advances which have influenced the early development of HTA were identified by Annett (2000). The 1950s gave rise to new theories of human performance in systems and new ways of assessing human activities in system design. Whilst it is difficult to pinpoint all of the possible factors that could have led to the development of HTA, some of the main influences are likely to include: the break down of tasks into their elements, the questioning of human performance in systems, a need to understand both physical and cognitive activity, a desire to represent the analysis in a graphical manner, and a need for an underpinning theory of human behaviour. One of the most influential ideas for HTA was the identification of error variance in system performance from systems theory (Chapanis, 1951). Annett (2004) states that the top-down systems approach taken by HTA enables the analyst “to identify and deal first with factors generating the largest error variance.” (p. 68-69). The error variance could be generated by either humans or machines, or an interaction between human and machines.
Annett (2004) points out that the initial development effort in hierarchical task analysis was in response to the need for greater understanding of cognitive tasks. With greater degrees of automation in industrial work practices, the nature of
worker tasks were changing in the 1960s. Annett argued that as these tasks involved significant cognitive components (such as monitoring, anticipating, predicting and decision making), a method of analysing and representing this form of work was required. Existing approaches tended to focus on observable aspects of
performance, whereas hierarchical tasks analysis sought to represent system goals and plans. At the time of the late 1960s this was a radical departure from
contemporary approaches. The 'cognitive' revolution had yet to happen in
mainstream psychology and the 'behaviouristic' paradigm was dominant. At that time it was considered 'unscientific' to infer cognitive processes, and academic
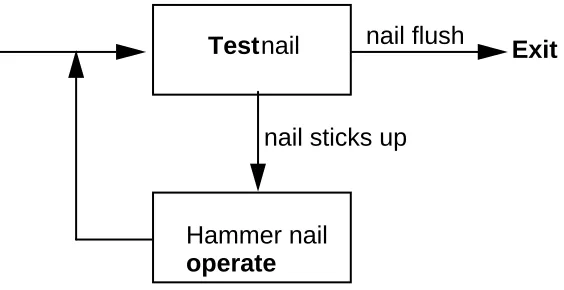
The influence of control theory of human behaviour as proposed by Miller et al (1960) can clearly be seen in HTA. Central to this theory are the twin ideas of a TOTE (Test – Operate – Test – Exit) unit and hierarchical levels of analysis. The classic example of a TOTE unit is the explanation of hammering a nail flush with a piece of wood. This is illustrated in figure one.
Test nail Exit
nail sticks up nail flush
[image:4.595.160.442.180.325.2]Hammer nail operate
Figure one. A TOTE unit for making a nail flush with the surface.
The three units of analysis are a TEST (where the goal is to see if the nail is flush with the surface of the wood), if the nail is not flush then an OPERATION is performed (i.e., striking the nail with the hammer), then the TEST is performed again. If the nail is flush, then the operator can EXIT this activity. We can imagine a situation where the nail is already flush, so the analysis would comprise just the TEST and EXIT components, or other situations where multiple TESTS and
Test nail
Operate Lift hammer
Operate Strike nail
Test hammer Test hammer
Exit nail sticks up
Exit
Exit
hammer down
hammer up
hammer up
hammer down nail flush
nail sticks up
[image:5.595.124.474.71.368.2]HAMMER NAIL
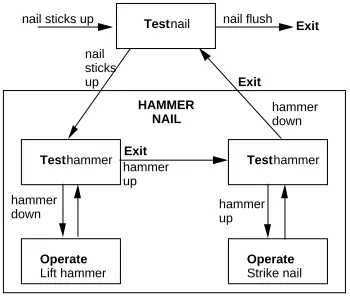
Figure two. The hierarchical plan with 'hammer nail' re-described.
Miller et al (1960) point out that the hammering of a nail only serves as an example and one might not attempt to analyse all tasks down to this level of detail. The analysis does show how it is possible to develop a more detailed system view of the control structures within a hierarchical analysis. Any system could, potentially, comprise of hierarchically arranged TOTE units. As Miller et al put it:
"Thus the compound of TOTE units unravels itself simply enough into a co-ordinated sequence of tests and actions, although the underlying structure that organises and co-ordinates the behaviour is itself hierarchical, not sequential." (Miller et al, 1960, p. 34)
Test nail
Lift hammer Strike nail Test hammer
Is nail flush?
Is hammer
up?
Make nail flush 0.
1.
1 yes exit
2
Hammer nail 2.
Plan 0.
2.1 yes
exit 2.2
Plan 2.
no
no
2.3
[image:6.595.88.509.85.562.2]2.1 2.2 2.3
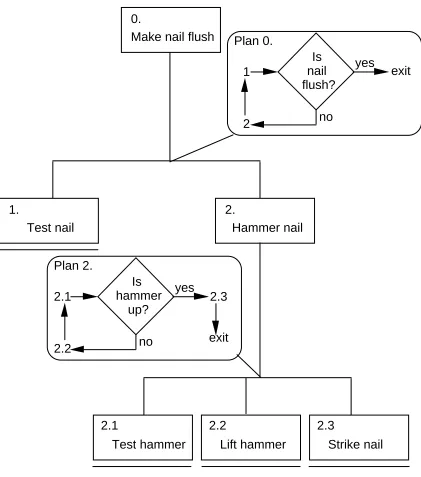
Figure three. HTA for goal of 'Make nail flush'.
In one of the earliest papers leading up to the specification for HTA, Annett &
Duncan (1967) show their concern with the adequacy of the description. The idea of a hierarchical description comprising subordinate operations is proposed with rules governing the level that this is taken to. They argued that some aspects of a task might be taken down several levels of re-description, whereas others will not. The decision to re-describe the task will depend upon estimates that the task can be performed adequately at that level of description. The authors proposed that this estimate was likely to include decisions about cost-critical aspects of the
performance and difficulty of the task.
2. Development of Hierarchical Task Analysis
In the original paper laying out the approach for conducting HTA, Annett et al (1971) make it clear that the methodology is based upon a theory of human
performance. They proposed three questions as a test for any task analysis method, namely: does it lead to any positive recommendations, does it apply to more than a limited range of tasks, and does it have any theoretical justifications? Perhaps part of the answer for the longevity of HTA is that the answer to each of these questions is positive. More modern methods might well fail some of these criteria. To
paraphrase Annett et al's words, the theory is based on goal-directed behaviour comprising a sub-goal hierarchy linked by plans. Thus performance toward a goal can be described at multiple levels of analysis. The plans determine the conditions under which any sub-goals are triggered. The three main principles governing the analysis were stated as follows:
"1. At the highest level we choose to consider a task as consisting of an operation and the operation is defined in terms of its goal. The goal implies the objective of the system in some real terms of production units, quality or other criteria.
2. The operation can be broken down into sub-operations each defined by a sub-goal again measured in real terms by its contribution to overall system output or goal, and therefore measurable in terms of performance standards and criteria.
It is important to fully digest these three principles, which have remained unwavering throughout the past 32 years of HTA. In the first principle, HTA proposed as a means of describing a system in terms of its goals. Goals are
expressed in terms of some objective criteria. The two important points here is that HTA is a goal-based analysis of a system and that a system analysis is presented in HTA. These points can escape analysts who think that they are only describing tasks carried out by people, whereas HTA is quite capable of producing a systems
analysis. Therefore HTA can be used to describe both team work and non-human tasks performed by the system. HTA describes goals for tasks, such that each task is described in terms of its goals. 'Hierarchical Sub-Goal Analysis of Tasks' might be a better description of what HTA actually does.
In the second principle, HTA is proposed as a means of breaking down
sub-operations in a hierarchy. The sub-sub-operations are described in terms of sub-goals. This re-iterates the point above, that HTA is a description of a sub-goal hierarchy. Again the sub-goals are described in terms of measurable performance criteria. The final principle states that there is a hierarchical relationship between the goals and sub-goals and there are rules to guide the sequence that the sub-goals are attained. This means that in order to satisfy the goal in the hierarchy its immediate sub-goals have to be satisfied, and so on. The sequence with which each sub-goal is attained is guided by the rules that govern the relationship between the immediate super-ordinate goal and its sub-super-ordinates.
In their original paper, Annett et al (1971) present some industrial examples of HTA. The procedure described in the worked examples shows how the analyst works in a process of continual reiteration and refinement. To start with the goals are described in rough terms to produce an outline of the hierarchy. This allows further
The stopping rule is simple enough in its conception: if the probability of failure (P) times (x) the cost of failure (C) is acceptable then stop the task analysis. If P x C is unacceptable, then the analysis should continue. Under most situations, the
probabilities and costs are not known and the analyst has to apply an approximation of this rule, although it may not be clear what they are basing this judgement on. Stammers & Astley (1987) point out that the stopping rule has remained a problem area for HTA. The P x C rule attempts provides an economy of description. The is no need to re-describe every sub-goal down to the most basic, elemental, level if failure to perform that sub-goal is inconsequential. Exactly when to stop the analysis has remained a problem for HTA (Stammers & Astley, 1987). Piso (1981) notes that the P x C criterion is complicated and time-consuming. His proposed solution to this problem is to continue the analysis until the sub-goal is clear to both the analyst and subject matter expert(s). Annett (2004 – personal communication) has pointed out that “it is important to think of the P x C criterion as a statement of principle rather than an exact calculation.” The role of the P x C rule seems to be to save the analyst time in analysing tasks where the ‘error variance’ would be inconsequential, and to guide more exploration where the ‘error variance’ would be intolerable.
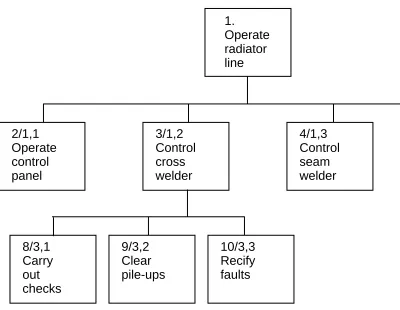
The original hierarchical number scheme for HTA required that every sub-goal was uniquely numbered with an integer in numerical sequence. Each sub-goal was further identified by stating its super-ordinate goal and its position under that sub-goal. This arrangement is illustrated in figure four. The overall goal of 'Operate radiator line' is numbered '1' as the super-ordinate goal. The immediate subordinate goals are numbered 2 to 7 (only 2 to 4 are shown in figure four). The sub-goal
1. Operate radiator line
2/1,1 Operate control panel
3/1,2 Control cross welder
4/1,3 Control seam welder
8/3,1 Carry out checks
9/3,2 Clear pile-ups
[image:10.595.97.497.66.376.2]10/3,3 Recify faults
Figure four. Numerical hierarchy system specified for HTA.
As well as the hierarchical diagram, Annett et al (1971) specified the production of a table for representing task relevant information as illustrated in table one. The numbers in the left-hand column identify the goals in the hierarchical diagram (although this is a different task being analysed to that in figure four). The next column (Description of Operation and Training Notes) contains the goal name, an 'R' if it is to be re-described elsewhere in the table, and notes relevant to training
performance, methods and constraints (as HTA was original devised to address training specification). The column titled 'I or F' would contain an 'X' if there were any Input or Feedback difficulties found in performance of the task. Similarly, the column titled 'A' would contain an 'X' if there were any Action difficulties found in performance of the task.
Table one. Part of the original tabular format
No. Description of Operation and Training Notes (R = re-description)
I or F
A
1
2 . 1,1
3 . 1,2
Operate acid purification plant. R
Instructions when to start-up or shutdown the whole process given by supervisor.
Start-up plant. R Must memorise order of units, i.e., C10, R2, C12
Run plant. R Log keeping and sampling tests for contamination at intervals fixed by
supervisor. Alarm signal dynamic failure.
---
---
--- X
X
X
2 to 4
5 to 7
8 to 10
Annett et al (1971) intended the 'I or F' and 'A' columns as memory aids for the analyst. They suggest that they analyst should ask of every task if there were any difficulties with the input-action-feedback cycle of behaviour. The order of the sub-goals were governed by a rule determining their exact sequence. In the original specification of HTA three types of rule were identified: procedure or chain,
selection, and time-sharing. The procedure or chain rule required that the sub-goals were performed in a fixed sequence. The selection rule indicated that the sub-goals were selected depending upon the outcome of another sub-goal. The time-sharing rule required some sub-goals to be performed in tandem. Annett et al (1971) argued that if the HTA is conducted properly it could be applied immediately to training design.
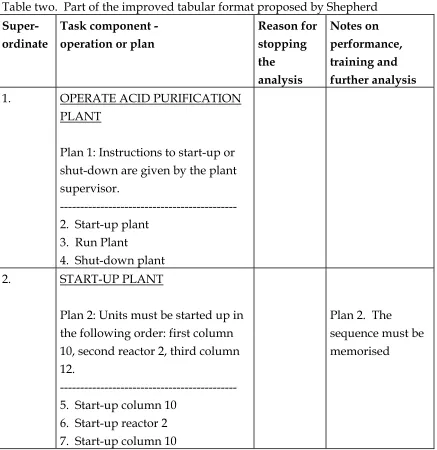
Some criticisms of the original specification of HTA were brought forward by Shepherd (1976), who proposed enhancements to the tabular format. Shepherd applauded the use of the tabular format to supplement the hierarchical diagram, but identified some potential weaknesses with the original table layout. His objections were: the remoteness of plans; combining information on operations, plans and training notes into one column; and, the usefulness of the two columns for sensory information/perceptual feedback (I/F) and motor action (A). Shepherd argued that close proximity of plans to the operations to which they refer would reduce
Table two. Part of the improved tabular format proposed by Shepherd Super-
ordinate
Task component - operation or plan
Reason for stopping the analysis
Notes on performance, training and further analysis
1. OPERATE ACID PURIFICATION
PLANT
Plan 1: Instructions to start-up or shut-down are given by the plant supervisor.
--- 2. Start-up plant
3. Run Plant
4. Shut-down plant
2. START-UP PLANT
Plan 2: Units must be started up in the following order: first column 10, second reactor 2, third column 12.
--- 5. Start-up column 10
6. Start-up reactor 2 7. Start-up column 10
Plan 2. The sequence must be memorised
Further changes and simplifications have been proposed over the years. For example, a HTA training manual by Patrick et al (1986) has proposed only three columns. They proposed that the notes column should be used for suggestions on how the analyst can improve the sub-goals. A variety of formats for doing this have emerged over the years, such as separate columns for job design, job aids, training, and procedures (Kirwan and Ainsworth, 1992).
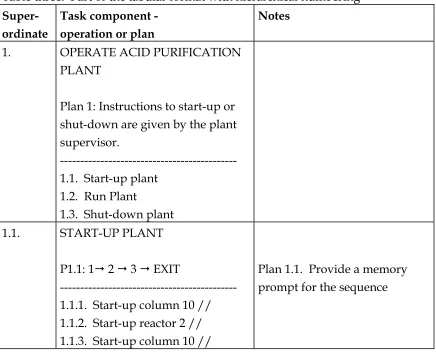
super-ordinate goal expressed underneath. Thus goal 2 in table two was the first sub-division of super-ordinate goal 1, so was denoted 2/1,1., whereas sub-goal 3 was the second sub-goal of super-ordinate goal 1, so was denoted 3/1,2. The first number refers to the unique number of the sub-goal , the next number refers to the super-ordinate goal and the last number refers to the position under the super-super-ordinate goal. Under the decimal system these sub-goals would be referred to as 1.1 and 1.2 respectively, to show that they were the first and second sub-goals of super-ordinate goal 1. The advantages of this newer system is that it makes it far easier to trace the family tree of any sub-goal. Imagine trying to find the genealogy of sub-goal
1.3.2.4.6 under the original system in the tabular format. An illustration of how the newer system of hierarchical decimal numbering represents the sub-goal is
[image:13.595.70.506.320.673.2]illustrated in table three.
Table three. Part of the tabular format with hierarchical numbering Super-
ordinate
Task component - operation or plan
Notes
1. OPERATE ACID PURIFICATION
PLANT
Plan 1: Instructions to start-up or shut-down are given by the plant supervisor.
--- 1.1. Start-up plant
1.2. Run Plant
1.3. Shut-down plant
1.1. START-UP PLANT
P1.1: 1 2 3 EXIT
--- 1.1.1. Start-up column 10 // 1.1.2. Start-up reactor 2 // 1.1.3. Start-up column 10 //
Plan 1.1. Provide a memory prompt for the sequence
presented in table four, these are training design, interface design, and job design. Potentially, at each stage in the sub-goal re-description, all of these questions could have been asked - depending upon the problem domain.
Table four. Questions for sub-goals. Training Design Piso (1981) Interface Design Hodgkinson & Crawshaw (1985) Job Design
Bruseberg & Shepherd (1997)
What is the goal of the task?
What information is used for the decision to act? When and under what conditions does the person (system) decide to take action?
What are the sequence of operations that are carried out?
What are the
consequences of action and what feedback is provided?
How often are tasks carried out?
Who carries the tasks out? What kinds of problems can occur?
What are the sensory inputs?
How can the display of information be
improved?
What are the information processing demands? What kind of responses are required?
How can the control inputs be improved? What kind of feedback is given?
How can the feedback be improved?
How can the environmental characteristics be improved?
How does information flow in the task? When must tasks be done?
What is the temporal relation of tasks? What are the physical constraints on tasks? Where can and cannot error and delay be tolerated?
Where is workload unacceptable? Where is working knowledge common to more than one task element?
Where do different tasks share the same or similar skills?
The questions in the training and job design studies were devised from the four-stage control loop model of performance (Piso, 1981): perception decision action evaluation. This general model can be used to describe all tasks and is probably implicit in all HTA, as it would be rather cumbersome to ask each of the questions explicitly at every single sub-goal.
used to describe each new generation of technological system. Second, it can be used for many ends: from person specification, to training requirements, to error prediction, to team performance assessment, and to system design. Again, Astley & Stammers (1987) point out that although HTA was originally used to develop an understanding of training requirements, it has subsequently been used for a variety of applications. Despite the popularity and enduring use of hierarchical task
analysis, and the fact that the analysis is governed by only a few rules, it is something of a craft-skill to apply effectively. Whilst the basic approach can be trained in a few hours, it is generally acknowledged that sensitive use of the method will take some months of practice under expert guidance (Stanton & Young, 1999).
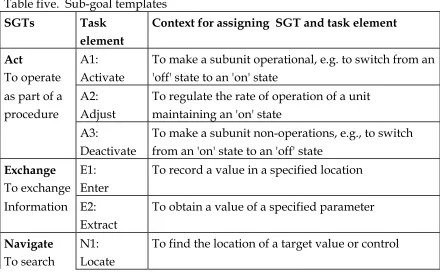
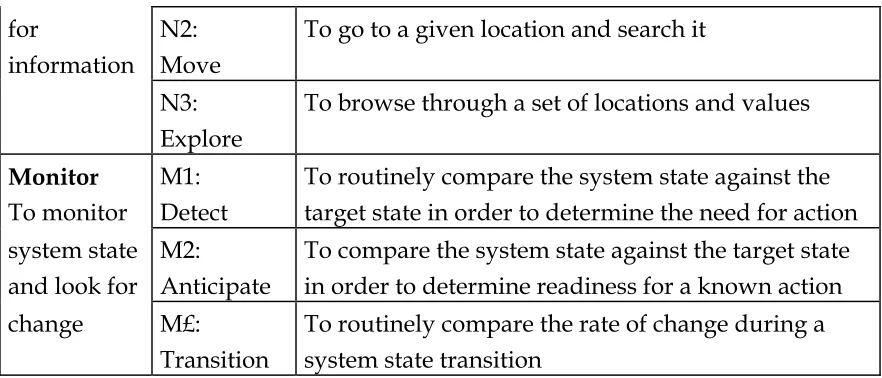
[image:15.595.68.508.475.750.2]A more recent innovation in HTA has been the proposal for a sub-goal template, to help formalise the process and help guide the novice analyst. Omerod & Shepherd (2004) propose the adoption of sub-goal and plan templates to assist in the process of re-description in HTA. They argue that these two tools could help make the process of HTA less daunting and reduce the inevitable learning curve associated with acquiring a new analytical technique. The sub-goal templates comprise action templates (e.g., activation, adjustment, and deactivation), exchange templates (e.g., entering and extracting data), navigation templates (e.g., locating, moving, and exploring), and monitoring templates (e.g., detecting, anticipating, and observing). A fuller description of the sub-goal templates is provided in table five.
Table five. Sub-goal templates SGTs Task
element
Context for assigning SGT and task element
Act
To operate
A1: Activate
To make a subunit operational, e.g. to switch from an 'off' state to an 'on' state
as part of a procedure
A2: Adjust
To regulate the rate of operation of a unit maintaining an 'on' state
A3: Deactivate
To make a subunit non-operations, e.g., to switch from an 'on' state to an 'off' state
Exchange To exchange
E1: Enter
To record a value in a specified location
Information E2: Extract
To obtain a value of a specified parameter
Navigate To search
N1: Locate
for
information N2: Move
To go to a given location and search it
N3: Explore
To browse through a set of locations and values
Monitor To monitor
M1: Detect
To routinely compare the system state against the target state in order to determine the need for action system state
and look for M2:
Anticipate
To compare the system state against the target state in order to determine readiness for a known action change M£:
Transition
To routinely compare the rate of change during a system state transition
Although the SGTs were developed with process control operations in mind, they can be applied more widely. As people start to use the SGTs in other domains, new SGT might become necessary. Within each of the sub-goal templates, the analyst may choose a plan template to help determine the sequence of the sub-goals.
[image:16.595.68.509.69.258.2]Omerod & Shepherd (2004) proposed four plan templates, as illustrated in table six.
Table six. Plan templates
Code Plan Type Syntax
S1 Fixed sequence Do X, Y, Z
S2 Contingent sequence If (c) then do X If not (c) then do Y S3 Parallel sequence Do together X, Y, Z
S4 Free sequence In any order do X, Y, Z
Omerod, Richardson & Shepherd (1988, 2000) report studies evaluating the effectiveness of novice analysts performing HTA with the SGT tools. They show that the SGT tools can help novice analysts, particularly with mastery of more difficult analyses. Computerisation of the SGT tools led to even better performance, as measured by fewer errors and quicker solutions, over the paper-based
counterparts.
requirements. Their research points to some shortcomings of HTA, such as the lack of representation of physical objects, propagation effects, causal understanding, and social-organisational knowledge. These criticisms might have been withdrawn if they had used some of the extensions of HTA (as described in section five). Miller & Vicente argued that HTA is a useful addition to the Abstraction Hierarchy. Some of their comments on the level and type of the analysis show that they are using HTA in a very constrained way. For example, they note that HTA focuses on human action whereas the abstraction hierarchy focuses on the whole system. Annett and others have argued that HTA can provide sub-goal hierarchies at many levels within a system. The analyst can choose to focus on the human agents, machine agents or the entire system. Thus one is drawn to the conclusion that some of the critique could be due to an incomplete understanding of HTA or the way it has been portrayed in some of the materials they have cited.
In a comparison of different task analysis representations, Stanton (2004) identified five forms that encompassed most methods: list, narratives, flow diagrams,
hierarchical diagrams, and tables. In a comparison of 22 methods, only three had three different forms of representation. Most methods relied upon only one form of representation. It seems fair to suggest that HTA benefits from multiple forms of representation, and this is indicative of the flexibility of the approach.
3. A Framework for conducting Hierarchical Task Analysis
Notwithstanding the problems with HTA, is has proved to be a popular and enduring method. As previously stated, this longevity is probably due to the versatility of the analysis. Despite this popularity, or perhaps because of it, there does seem to be many different conventions for expressing HTA that have
developed from peoples’ own adaptation and mutations. It is difficult, therefore, to propose that there is one right way of doing this, although some have tried
(Shepherd, 1989; 2001; Annett 2004). Rather, this section will follow the examples of Stammers (1996) and Shepherd (1998; 2000) to propose a framework within which HTA can be conducted, allowing for personal adaptation for the purpose at hand.
The number of guidelines for conducting HTA are surprisingly few. Annett (1996) has pointed out that the methodology is based on some broad principles (as detailed in section 2), rather than a rigidly prescribed technique. This fits well with
in the analysis, as described in section 1. That said, the basic heuristics for conducting a HTA are as follows.
(i) Define the purpose of the analysis
Although the case has been made that HTA can be all things to all people, the level or re-description and the associated information collected might vary depending upon the purpose. Examples of different purposes for HTA would include system design, interface design, operating procedures design, developing person
specifications, analysis of workload and manning levels, and training design. The name(s), contact details, and brief biography of the analyst(s) should also be recorded. This will enable future analysts to check with the HTA originator(s) if they plan to re-use or adapt the HTA.
(ii) Define the boundaries of the system description
Depending upon the purpose, the system boundaries may vary. If the purpose was to develop a person specification then the system boundary might be drawn around the tasks performed by that individual. If the purpose of the analysis is to analyse co-ordination and communication in team work, then the entire set of tasks of a team of people would be analysed. If the purpose of the analysis is to determine
allocation of system function to human and computers, then the whole system will need to be analysed. Both Shepherd (2001) and Annett (2004) emphasise the need to perform the analysis appropriate to the intended purpose to which it is to be put.
(iii) Try to access a variety of sources of information about the system to be analysed.
All task analysis guides stress the importance of multiple sources of information to guide, check and validate the accuracy of the HTA (Patrick et al, 1986; Kirwan & Ainsworth, 1992; Shepherd, 2001; Annett, 2004). Sources such as observation, subject matter experts, interviews, operating manuals, walkthoughs, and simulations can all be used as a means of checking the reliability and validity of the analysis. Careful documentation and recording of the sources of data needs to be archived, so that the analyst or others may refer back and check if they need to. Annett (2004) points out that cross-checking the data between sources is the best guarantee that the
information is accurate.
(iv) Describe the system goals and sub-goals
identified. As originally specified, it is not the operations that are being described, but their sub-goals (Annett et al, 1971). All of the lower level sub-goals are a logical expansion of the higher ones (Patrick et al, 1986). A formal specification for the statement of each of the sub-goals can be derived, although most analyses do not go such lengths. Patrick et al (1986) describe the three components of these statements, as indicated in table seven. Obviously this is a trivial task, but it does show how the task statement can be composed and its relationship with the goal (by referring back to figure three).
Table seven. The elements of task statements.
Task statement element Questions Example Activity Verb Is it clearly defined?
Is it differentiated?
Does it state the objective of the behaviour?
To make the nail flush
Performance standards Is the quantity or quality of the performance specified (e.g., speed, accuracy, errors, etc.)?
...without damaging the surface of a piece of wood...
Conditions Are the conditions under which the task is to be performed described (e.g., environment, tools, materials, etc.)?
....using a hammer.
As table seven shows, the goal is presented in the activity verb. The performance standards and the conditions could be expressed in the notes section of the tabular format.
(v) Try to keep the number of immediate sub-goals under any super-ordinate goal to a small number (i.e, between 3 and 10).
check to see if any of the sub-goals can be grouped together under another super-ordinate. It is generally good practice to continually review the sub-goal groupings, to check if they are logical. HTA does not permit single subordinate goals.
(vi) Link goals to sub-goals, and describe the conditions under which sub-goals are triggered.
Plans are the control structures that enable the analyst to capture the conditions which trigger the sub-goals under any super-ordinate goal. Plans are read from the top of the hierarchy down to the sub-goals that are triggered and back up the
hierarchy again as the exit conditions are met. Shepherd (2001) identified six basic types of plan: fixed sequences, contingent sequences, choices, optional completion, concurrent operations and cycles. These different types of plans take the variety of different sub-goal triggers into account. He states that complex tasks will require combinations of these different sorts of plans. As each of the sub-goals, and the plans that trigger them, are contained within higher goals (and higher plans)
considerable complexity of tasks within systems can be analysed and described. The plans contain the context under which particular sub-goals are triggered. This
context might include time, environmental conditions, completion of other sub-goals, system state, receipt of information, and so on. For each goal, the analyst has to question how each of its immediate subordinates is triggered. Omerod &
Shepherd (2004) have proposed some basic plan templates to guide this process (see table seven). As well as identifying the sub-goal trigger conditions, it is also
important to identify the exit condition for the plan that will enable the analyst to trace their way back up the sub-goal hierarchy. Otherwise, the analysis could be stuck in a control loop with no obvious means of exiting.
(vii) Stop re-describing the sub-goals when you judge the analysis is fit-for-purpose.
When to stop the analysis has been identified as one of the more conceptually
hierarchical list and tabular format. This communicates to the reader that the sub-goal is not re-described further elsewhere in the document.
(viii) Try to verify the analysis with subject-matter experts.
Annett (2004) makes the point that it is important to check the HTA with subject matter experts. This can help both with verification of the completeness of the analysis and help the experts develop a sense of ownership of the analysis.
(ix) Be prepared to revise the analysis.
HTA requires a flexible approach to achieve the final sub-goal hierarchy with plans and notes. The first pass analysis is never going to be sufficiently well developed to be acceptable, no matter what the purpose. The number of revisions will depend on the time available and the extent of the analysis, but simple analyses (such as the analysis of the goals of extracting cash from an automatic teller machine) may require at least three interactions, where as more complex analyses (such as the analysis of the emergency services responding to a hazardous chemical incident) might require at least ten iterations. It is useful to think of the analysis as a working document that only exists in the latest state of revision. Careful documentation of the analysis will mean that it can be modified and re-used by other analysts as required.
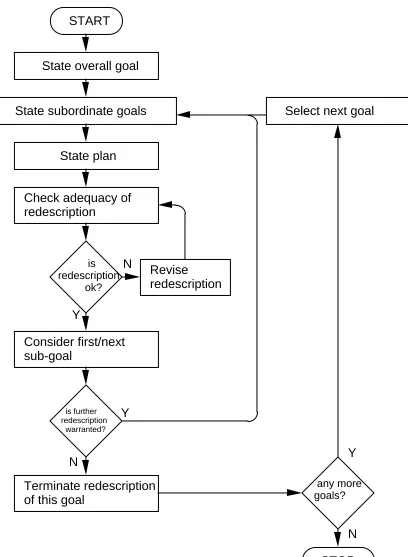
A procedure for development of the sub-goal hierarchy with the plans is presented
in figure five. This procedure only describes the steps (iv) to (vii) in the
START
State overall goal
State subordinate goals
State plan
Check adequacy of redescription
is redescription ok?
Y
Consider first/next sub-goal
is further redescription warranted?
Terminate redescription of this goal
N
any more goals? Select next goal
Y
N
STOP N Revise
redescription
[image:22.595.95.503.67.624.2]Y
Figure five. Procedure for breaking down the sub-goal hierarchy.
Table eight. Notation used in HTA.
TEXT SYMBOLS
then >
and + &
or /
any of :
decide ? if condition X then X ? >
The notation in table eight is used in the plans to indicate the sequence, and trigger condition, for the sub-goals. Six different forms of plans with three different
notation conventions are shown in table nine. A more detailed description of the forms that plans can take may be found in Shepherd (2001), who devotes an entire chapter to plans in his book.
Table nine. Different plan types with three notation conventions.
Type of Plan Types of Notation
Linear 1 > 2 > 3 > 4
sequential plan 1 then 2 then 3 then 4 Do in order
Non-linear 1/2/3/4
non-sequential plan N/A
Do in any order
Simultaneous 1 + 2 + 3 + 4
concurrent plan 1 and 2 and 3 and 4
Do at the same time Branching X? Y > 2 N > 3
choice plan if X present then 2 else 3
Do when required Cyclical 1 > 2 > 3 > 4 > 1...
repetitious plan 1 then 2 then 3 then 4 then repeat from 1 until Repeat the following until
Selection 1:2:3:4
exclusive plan 1 or 2 or 3 or 4
[image:23.595.69.508.381.741.2]Some plans may use one of these basic types whereas others may be a hybrid combining two or more of these types. The three different representations of HTA are hierarchical diagrams, hierarchical lists and the tabular format. Each of these is illustrated with a team work task presented by Baber et al (2004). These examples show the compatibility of the three different representations. The HTA was based upon the analysis of the emergency services responses to a hazardous chemical incident. In the scenario analysed, some youths had broken into a farm and disturbed some chemicals in sacking. One of the youths had been taken to the hospital with respiratory problems, whilst the others were still at the scene. The police were sent to investigate the break-in at the farm. They called in the fire
service to identify the chemical and clean up the spillage. The overall analysis shows four main sub-goals: receive notification of an incident, gather information about the incident, deal with the chemical incident, and resolve incident. Only part of the analysis is presented in figures six and seven, to illustrate HTA.
In figure seven, the overall goal is shown at the top of the hierarchy with the main goals underneath. Plan 0 shows the conditions under which each of the sub-goals are triggered. As sub-goal 1 is not re-described, it has been underlined. Sub-goal 2 is re-described, and has 8 sub-Sub-goals of its own. Plan 2 refers to the conditions under which the sub-goals of super-ordinate goal 2 will be triggered. As none of the sub-goals under super-ordinate goal 2 are re-described further they have been
underlined.
0. Deal with chemical incident 1. [Police Control] receive notice from public about incident 2. [Police Control] gather information about incident 4. [Fire Control] deal with chemical incident 2.2.1. [Police Control] send Police Office to scene of incident
2.1.
[Hospital] inform police control of casualty with respiratory problems
2.2.2.
[Police Officer] arrive at scene of incident 2.3.2. [Police Officer] capture suspects 2.3.3. [Police Officer] gather information from suspects 2.3.4. [Police Officer] inform police control of nature of incident Plan 0.
Wait until 1 then 2 then 3 If [hazard] then 4 then 5 then exit
Else exit
Plan 2.
Do 2.1 at any time Do 2.2 then 2.3 Then exit
2.2.3.
[Police Officer] search scene of incident 2.3.1. [Police Officer] identify possible hazard 3.
[Police Control] make decison about nature of incident
2.2.
[Police Control] get a Police Officer to search scene of incident
2.3.
[Police Control] get a Police Officer to report nature of incident
Plan 2.3
If hazards] then 2.3.1 If [suspects] then 2.3.2 then 2.3.3
[image:25.595.78.505.61.701.2]Then 2.3.4 then exit Else exit Plan 2.2. Do 2.2.1 Then 2.2.2. Then 2.2.3 Until [suspects] or [hazards] Then exit
Figure six. Part of the hierarchical diagram for the goal of "Deal with chemical incident"
larger scale analyses, the hierarchical diagram can become cumbersome and unwieldy. For these analyses a hierarchical list approach might be more useful. The same analysis in figure six is presented as a hierarchical list in figure seven for comparison.
0. Deal with chemical incident
Plan 0: Wait until 1 then do 2 then 3 - If [hazard] then 4 then 5 then exit - Else exit
1. [Police control] receive notice from public about incident // 2. [Police Control] gather information about incident
Plan 2: Do 2.1 at any time if appropriate Do 2.2 then 2.3
Then exit
2.1. [Hospital] inform police control of casualty with respiratory problems//
2.2. [Police Control] get a Police Officer to search scene of incident
Plan 2.2: Do 2.1.1 then 2.2.2 then 2.2.3 Until [suspects] or [hazards] then exit
2.2.1. [Police Control] send Police Officer to scene of incident// 2.2.2. [Police Officer] arrive at scene of incident//
2.2.3. [Police Officer] search scene of incident//
2.3. [Police Control] get Police Officer to report nature of incident
Plan 2.3: If [suspects] then 2.3.1 If[suspects] then 2.3.2. then 2.3.3 Then 2.3.4. then exit
2.3.1. [Police Officer] identify possible hazard//
2.3.2. [Police Officer] capture suspects// 2.3.3. [Police Officer] gather information from suspects//
2.3.4. [Police Officer] inform police control of nature of incident//
3. [Police Control] make decision about nature of incident// 4. [Fire Control] clean up chemical spillage
[image:27.595.68.507.56.374.2]etc... 5. etc...
Figure seven. Part of the hierarchical list for the goal of "Deal with chemical incident"
The hierarchical diagram and hierarchical list present exactly the same information on the sub-goal hierarchy in two different forms. The advantage of the diagram is that it represents the groups of sub-goals in a spatial manner which is useful for gaining a quick overview of the HTA. The hierarchical lists show the same
information in a more condensed format, which is useful for very large analyses. It is possible to annotate the sub-goal hierarchy with the tabular format, as illustrated in table ten.
Table ten. Part of the tabular format with hierarchical numbering for the goal of "Deal with chemical incident"
Super- ordinate
Task component - operation or plan
0 Deal with chemical incident
Plan: Wait until 1 then do 2 - If [hazard] then 3 then 4 then exit - else exit
--- 1. [Police control] receive notice from public about incident // 2. [Police Control] gather information about incident
3. [Fire Control] clean up chemical spillage
This is a multi-agency task involving the police and fire service as well as the hospital with a possible casualty
The response to the incident is initiated by a phone call
The re-description is missing, to shorten the example
2 [Police Control] gather information about incident
Plan 2: Do 2.1 at any time if appropriate
Do 2.2 then 2.3 Then exit
--- 2.1. [Hospital] inform police
control of casualty with respiratory problems//
2.2. [Police Control] get a Police Officer to search scene of incident
2.3. [Police Control] get Police Officer to report nature of incident
2.2. [Police Control] get a Police
Officer to search scene of incident
Plan 2.2: Do 2.1.1 then 2.2.2 then 2.2.3
Until [suspects] or [hazards] then exit
--- 2.2.1. [Police Control]
send Police Officer to scene of incident// 2.2.2. [Police Officer] arrive at scene of incident//
2.2.3. [Police Officer] search scene of incident//
The police officer may have to find a remote location based on sketchy information
The police officer has to search for signs of a break-in and hazards
2.3. [Police Control] get Police Officer to report nature of incident
Plan 2.3: If [suspects] then 2.3.1 If[suspects] then 2.3.2. then 2.3.3 Then 2.3.4. then exit
Else exit
--- 2.3.1. [Police Officer]
identify possible hazard//
2.3.2. [Police Officer] capture suspects// 2.3.3. [Police Officer] gather information from suspects//
2.3.4. [Police Officer] inform police control of nature of incident//
Any potential hazard needs to be identified, including the chemical ID number
Any suspects on the scene need to be identified
Suspects need to be questioned about the incident
The tabular format permits more detail of how the emergency services deal with the incident. The analysis is not exhaustive, nor is it complete. Rather it is presented to serve as an illustration of how the three different representations of HTA present information on the same sub-goal hierarchy. HTA serves as a springboard for a variety of other techniques. Once the sub-goal hierarchy has been broken down, many other forms of analysis may be carried out on it. This is the subject of the following section.
4. Some applications of Hierarchical Task Analysis
One of the reasons for the enduring success of HTA is that it has the flexibility to be applied to many tasks. Most, if not all, application areas in Ergonomics require some form of task representation. Kirwan & Ainsworth (1992) claim that HTA may "be used in almost every circumstance" (page 29). They cite that this offers a major cost saving in a system design programme, rather than continually re-analysing the task for every different type of application. Annett (2004 - personal communication) has made the point that the form of the HTA could vary depending upon the
application, so that the first or subsequent drafts of HTA might not serve all purposes, and some modifications might have to be made. This view sits comfortably with Shepherd's proposal of HTA as a framework. Most applied
ergonomists will be familiar with the notion of HTA as a living documentation of the sub-goal hierarchy that only exists in the latest state of revision.
In the large-scale design and development of a new nuclear reactor, Staples (1993) describes how HTA was used as the basis for virtually all of the ergonomics studies. The sub-goal hierarchy was produced through reviews of contemporary operating procedures, discussions with subject matter experts, and interviews with operating personnel from another reactor. Both the hierarchical diagram and the tabular format versions of HTA were produced. The resultant HTA was used to examine potential errors and their consequences, the interface design verification,
identification of training procedures, development and verification of operating procedures, workload assessment and communication analysis. Staples argued that HTA is of major benefit in system design as it makes a detailed and systematic
general conclusion that the broad application of HTA can make it a very cost-effective approach to system design.
Most books containing descriptions of HTA also contain examples of application areas that it can be, and has been, applied. This serves to demonstrate that HTA has been applied in areas far wider that the training applications for which it was
originally devised. Annett (2000) has pointed out the HTA is a general problem solving approach, and performing the analysis helps the analyst understand the nature of both the problem and the domain. An indication of some of the
[image:31.595.68.541.276.612.2]application areas is illustrated in table eleven.
Table eleven. Application of HTA from ergonomics texts Application Kirwan &
Ainsworth (1992)
Wilson & Corlett (1995)
Stanton (1996)
Annett & Stanton (2000)
Shepherd (2001)
Interface evaluation Training
Allocation of function Job description Interface design Work organisation Manuals design Job aid design Error analysis Error prediction Team task analysis Workload assessment Procedure design
As table eleven shows, there are at least twelve additional applications to which HTA has been put. This list is not intended to be exhaustive, rather it illustrates that HTA as a means-to-an-end, rather than an end in itself (Stanton, 2004). The reader is referred to the appropriate texts for examples of the applications. Duncan (1972) has argued that a task description should not be biased in terms of any particular
structure did not indicate which was a better interface. Rather the analysis just showed that the sub-goal structures were different for the two machines. To
determine which was a better interface required an extension of the analysis, such as an examination of the error potential or task time when interacting with the device. With the HTA completed first, the subsequent analyses are possible. Many method and techniques either depend upon output of HTA or are made easier when HTA is performed first.
Ainsworth & Marshall (1988, 2000) describe a survey of reports on task analysis methods, including HTA, conducted in the armed services and nuclear industries. The results of their survey showed that "HTA is perhaps the nearest thing to a universal task analysis technique." (Ainsworth & Marshall, 2000: p.83). The areas that HTA was used in the armed services and nclear power are presented in table thirteen, together with the methods of data collection that were used and the number of reports
[image:32.595.69.530.401.727.2]analysed. In nuclear power there were three other areas covered: allocation of function (16 reports), human error identification (29 reports), and systems assessment (55 reports).
Table twelve. Areas of application of HTA in the armed services and nuclear power.
Area Data collection methods Armed
Services reports
Nuclear Power Reports Systems
procurement
Technical expert interviews,
informal discussions, and scenario modelling
2 (8%) 0 (0%)
Manpower analysis and personnel requirements
Walkthoughs, interviews, and discussions with experts
7 (28%) 31 (15%)
Operability Walkthoughs and discussions with experts
5 (20%) 53 (26%)
Interface design Walkthoughs, interviews, and discussions with experts
9 (36%) 95 (46%)
Training Direct observation, discussions with experts, and questionnaires
2 (8%) 27 (13%)
As with table eleven, table twelve shows that HTA was put to many uses across a wide spectrum of activities. Table thirteen also shows that discussions and
interviews with experts were a core source of data. This method was supplemented by walkthoughs, direct observation, questionnaires, and scenario modelling,
depending upon what was possible in the area of application. Ainsworth &
Marshall (1988, 2000) were critical about the quality of reporting in the task analysis reports. They state that the purpose of the analysis was not always clear and the sources of the data were poorly documented. They also note that some of the analyses were very superficial and showed poor insight into the problem under investigation. Many of these problems may have been overcome if the analyst had been properly trained in HTA and had followed the guiding principles laid out in section three of this paper.
5. Some Extensions of Hierarchical Task Analysis
As illustrated in tables eleven and twelve, HTA has been put to many different uses. In fact, the whole point of conducting HTA is the analyse tasks, this means that the HTA representation is the starting point for the analysis, rather than the end point. The tabular format has enabled a mechanism for extending the analysis beyond the system description provided in the sub-goal hierarchy and plans. It is perhaps ironic that, whilst initial developments in HTA sought to simplify the tabular format, latter developments have sought to extend it. These extensions in HTA have enabled the analyst to: investigate design decisions, analyse human-machine interaction, predict error, allocate function, design jobs, analyse team work, and assess interface design. It is impossible to cover all of the extensions to HTA (for that, the reader is referred back to source books - some of which are indicated in table eleven), rather the aim of this section is to indicate some of the variety of the extensions to HTA.
cultural compliance. Table thirteen shows part of the analysis presented by Shepherd, to illustrate the task taxonomy. In Shepherd's work he argues that the contextual constraints and conditions interact with the design decisions in a safety critical task.
Table thirteen. An analysis of the contextual constraints and conditions for a safety critical task
Context and constraints
1. Deal with emergencies Plan 1: Do 1, then 2 or 3 as appropriate
1.1. Assess situation to establish the extent of the emergency
1.2. Deal with local isolation
1.3. Deal with emergency evaluations
1.2 Deal with local isolation Plan 1.2. Do 1 then 2
1.2.1. Assess extent of problem
1.2.2. Isolate affected area
1.2 Deal with emergency evaluations etc....
TASK ANALYSIS Comments
N
Y
Y
N
Y
hi lo lo lo hi lo hi hi hi
hi lo lo lo hi lo hi hi hi
This entails having a good understanding of systems to enable flexible operations. Analytical skills needed and intelligent planning aid may help
'Stop analysis?' column). Shepherd notes that these estimates may be based on data or informed comment from subject matter experts. These contextual analyses can help guide the analyst to consider what aspects of the task need to be improved and the form that those improvements could take. The design hypotheses are presented in the 'Comments' section of the table. In the first pass analysis, all relevant design hypotheses should be included, for screening at a later point in time.
Stammers & Astley (1987) have shown how HTA can be extended to help determine the information requirements for human-computer interface design. Their method extends the tabular format to include three additional sections on information flow (i.e., the information flow to and from the interface), information assumed (i.e., information that is a prerequisite for the performance of the task), and task
classification (i.e., a taxonomy of operations that will be performed). The analysis of information flow can detail the information necessary to perform each part of the task. The taxonomy developed by Stammers & Astley was based on process control operations and comprised eight distinct types of task, namely:
• monitoring (watching developments in the process); • procedure (following a set sequence of tasks);
• fault diagnosis (determining the cause of a fault or alarm); • fault detection (detecting that a fault or alarm has occurred); • decision making (choosing between alternate courses of action); • problem solving (finding a solution to a problem);
• operation (conducting manual control).
[image:35.595.70.563.647.705.2]An example of the output of analysis for the coal preparation plant operator’s task (Astley & Stammers, 1987) is shown in table fourteen, where the information flow to the human operator(s) from the technical system is shown by a right pointing arrow () and information flow to the technical system from the human operator(s) is shown by a left pointing arrow (). The plans are a hybrid of symbols and text.
Table fourteen. Analysis of human-computer interaction Super-
ordinate
Plan Operations Information
flow across interface
Information assumed
Task classifica- Tion
0.
Operate coal preparation plant
1 2 & 3 until 4. Do 5 as appropriate and 6 at end of shift.
1. Start-up plant
2. Run plant normally
3. Carry out fault detection and fault diagnosis
4. Shut down plant
5. Operate telephone and tannoy
6. Make daily reports initiate start plant items selected plant operation & monitoring control information fault data initiate shut down --- plant data for log
start up procedure knowledge of plant flows and operational procedures some understand -ing of faults shut down procedures operational knowledge reporting procedure Procedure operation fault detection fault diagnosis procedure operation procedure
Astley & Stammers propose that an extended tabular format can be used for underlying assumptions about the operators’ knowledge and skills, allocation of function issues, operator characteristics and training issues. The tabular format allows for scrutiny of the sub-goals and the format is easily adaptable to many different types of analysis.
observations and interviews with chemists. They argued that HTA helped uncover the complexities of the task. Then they identified error potential for each sub-goal, also using observation and interviews. This time the HTA served as a frame for the observational studies and interviews, through which potential errors could be assessed. As well as observing errors, HTA can be used as a basis for predicting errors. Systematic Human Error Reduction and Prediction Approach (SHERPA) for example, uses an error taxonomy to predict potential errors from the HTA sub-goal hierarchy (Stanton & Young, 1999). The idea is that each task can be classified into one of five basic types. Each of these task types links with an error taxonomy to identify credible errors associated with a sequence of human activity. In essence the SHERPA technique works by indicating which error modes are credible for each task step in turn. This indication is based upon the judgement of the analyst, and
requires subject matters experts. The process begins HTA. For the application of SHERPA, each task step from the bottom level of the sub-goal hierarchy is taken in turn. First each task step is classified into a type from the taxonomy, into one of the following types:
• Action (e.g. pressing a button, pulling a switch, opening a door) • Retrieval (e.g. getting information from a screen or manual) • Checking (e.g. conducting a procedural check)
• Information communication (e.g. talking to another party) • Selection (e.g. choosing one alternative over another)
Table fifteen. Error modes and their description Error Mode Error Description
Action A1 A2 A3 A4 A5 A6 A7 A8 A9 A10
Operation too long/short Operation mistimed
Operation in wrong direction Operation too much/little Misalign
Right operation on wrong object Wrong operation on right object Operation omitted
Operation incomplete
Wrong operation on wrong object Information
Retrieval R1
R2 R3
Information not obtained Wrong information obtained Information retrieval incomplete
Checking C1
C2 C3 C4 C5 C6
Check omitted Check incomplete
Right check on wrong object Wrong check on right object Check mistimed
Wrong check on wrong object Information
Communication I1
I2 I3
Information not communicated Wrong information communicated Information communication incomplete Selection
S1 S2
Selection omitted Wrong selection made
SHERPA approach. For each sub-goal that is analysed, credible error modes (i.e. those judged by a subject matter expert to be possible) are identified and labelled using the codes from table fifteen. A description of the form that the error would take is also given. The consequence of the error on the system is determined in the next column, as this has implications for the criticality of the error. The last four steps consider the possibility for error recovery, the ordinal probability of the error (high, medium of low), its criticality (high, medium or low) and potential remedies. Again, all of these analyses are shown in table sixteen.
Table sixteen. The SHERPA table Sub-goal Error
Mode
Error Description
Consequence Recovery P C Remedial Strategy
1. Prepare VCR
N/A N/A N/A N/A N/A
1.1 Switch VCR on
A8 Fail to switch VCR on Cannot proceed
Immediate L L Press of any button to switch VCR on 1.2 Check
clock time
C1
C2
Omit to check clock
Incomplete check
VCR Clock time may be incorrect
None L H Automatic clock setting and adjust via radio transmitter 1.3 Insert
cassette
A3
A8
Insert cassette wrong way around
Fail to insert cassette
Damage to VCR Cannot record Immediate Task 3 L L H H Strengthen mechanism On-screen prompt 2 Pull down
front cover
A8 Fail to pull down front cover
Cannot proceed
Immediate L L Remove cover to programming 3. Prepare to
programme
N/A N/A N/A N/A N/A
3.1 Set timer selector to program
S1 Fail move timer selector Cannot proceed
Immediate L L Separate timer selector from programming function 3.2 Press
'Program'
A8 Fail to press PROGRAM Cannot proceed
Immediate L L Remove this task step from sequence 3.3 Press 'On'
button
A8 Fail to press ON button Cannot proceed
Immediate L L Label button START TIME
4. Enter Program details
4.1. Select channel
N/A N/A N/A N/A N/A
4.1.1 Press 'Channel up' button
A8 Fail to press UP button Wrong channel selected
None M H Enter channel number directly from keypad
4.1.2 Press 'Channel down' button
A8 Fail to press DOWN button
Wrong channel selected
None M H Enter channel number directly from keypad
4.2 Press 'Day' button
A8 Fail to press DAY button
Wrong day selected
None M H Present day via a calendar
4.3 Set start time
I1
I2
No time entered
Wrong time entered
No programme recorded Wrong programme recorded None None L L H H
Dial time in via analogue clock
Dial time in via analogue clock
4.4 Wait for 5 seconds
A1 Fail to wait Start time not set
Task 4.5 L L Remove need to wait
4.5 Press 'Off' button
A8 Fail to press OFF button Cannot set finish time
L L Label button FINISH TIME
4.6 Set finish time
I1
I2
No time entered
Wrong time entered
No programme recorded Wrong programme recorded None None L L H H
Dial time in via analogue clock
Dial time in via analogue clock
4.7 Set timer A8 Fail to set timer No
programme recorded
None L H Separate timer selector from programming function 4.8 Press
'Timer record' button
A8 Fail to press TIME RECORD button
No
programme recorded
None L H Remove this task step from sequence
5 Lift up front cover
A8 Fail to lift up front cover Cover left down
As table seventeen shows there are six basic error types associated with the activities of programming a VCR. These are:
A. Failing to check that the VCR clock is correct. B. Failing to insert a cassette.
C. Failing to select the programme number. D. Failing to wait.
E. Failing to enter programming information correctly. F. Failing to press the confirmation buttons.
The purpose of SHERPA is not only to identify potential errors with the current design, but to guide future design considerations. The structured nature of the analysis can help to focus the design remedies on solving problems, as shown in the remedial strategies column. As this analysis shows, quite a lot of improvements could be made. It is important to note however, that the improvements are constrained by the analysis. This does not address radically different design solutions that may remove the need to programme at all.
Marsden & Kirby (2004) describe the application of HTA to function allocation. Allocation of system function has been a problem that has challenged ergonomics researchers and practitioners for the past fifty years. Numerous methods have arisen, but all depend upon an adequate description of the system within which functions are to be allocated to humans or machines. Marsden & Kirby argue that the most suitable system description is that provided by the sub-goal hierarchy in HTA, because it focuses attention on the purposes (i.e., goals and sub-goals) of the system in question. They suggest that many of the function allocation problems can be circumvented by getting the 'stakeholders' to agree upon the description of the purpose of the system. As with Duncan's (1972) comments about the neutrality of HTA, Marsden & Kirby propose that the analysis should present the sub-goals of what should be done by the system, rather than how it should be done. The former will enable impartial function allocation whereas the latter may bias function
allocation. They also suggest that the stopping rule should be replaced with a no-solution heuristic, i.e., the sub-goal decomposition stops at a point just before an allocation of function solution would become apparent. This is to prevent
Table seventeen. Using HTA in function allocation.
Super-ordinate goal Subordinate goal
Human or Computer?
1.1 Forecast demand H
1.1.1 Review regular sales H 1.1.2 Review demand from
pub chains
H
1.1.3 Review potential
demand from one-off events
H
1.2 Produce provisional resource plan H-C
1.2.1 Calculate expected
demand for each type of beer
H-C
1.2.2 Make adjustment for production minima and maxima
C
1.3 Check feasibility of plan H-C
1.3.1 Do materials explosion of
ingredients
H-C
1.3.2 Do materials explosion of
casks and other packaging
C
1.3.3 Check material stocks H-C
1.3.4 Calculate materials
required
C
1.3.5 Negotiate with suppliers H
1.3.6 Check staff availability H
1.3.7 Check ability to deliver beer to customers
H
1.4 Review potential impact H
1.4.1 Review impact of plan on
cash flow
H
1.4.2 Review impact of plan on
staff
H
1.4.3 Review impact on
customer relations
H
1.4.4 Review impact on supplier relations
Marsden & Kirby (2004) outline a number of criteria to be considered when allocating system functions to humans or computers, some of which are
contradictory. This means that there is considerable discretion on the part of the analyst to resolve "keeping the job as simple as possible" and "having a challenging job to do". The function allocation in table seventeen has been coded for human only (H), human and computer with the human in control (H-C), computer and human with the computer in control (C-H), and computer only (C). After the initial
functional allocation, Marsden & Kirby recommend a review of the potential impact of the allocations to consider the likely impact on job satisfaction, human error, attention, workload, productivity, and cost-effectiveness. An overall analysis of the proposed allocation may also reveal any potential conflicts or incompatibilities in the allocations. When the allocations have been confirmed, more detailed analyses may be undertaken to propose how the sub-goals may be achieved with the proposed resources.
[image:43.595.73.577.534.743.2]Kirwan & Ainsworth (1992) report on how HTA may be used to assess the adequacy of interface design. The example is based on a study of tasks in emergency shut-down procedures on an off-shore oil and gas rig in the North Sea (Pennington, 1992). The analyses suggest that good communications between the production and the drilling teams play an important part in maintaining safety. An extract of this analysis is presented in table eighteen. The analysis sought to investigate the adequacy of the input, action and feedback cycle in the tasks. This analysis harks back to the original formulation of HTA proposed by Annett et al (1971) some twenty years earlier.
Table eighteen. Analysis of two sub-goals in emergency shut-down procedures. Sub-goals Control Purpose Method Feedback Adequacy