1
Lateral scale calibration for focus variation microscopy
Anas Alburayt1, Wahyudin P. Syam1* and Richard Leach1
1Manufacturing Metrology Team, University of Nottingham, NG8 1BB, UK
*Corresponding author: [email protected]
Abstract.
Areal surface texture measuring instruments can be calibrated by determining a set of metrological characteristics currently in the final stages of standardisation. In this paper, amplification, linearity and perpendicularity characteristics have been determined to calibrate the lateral performance of a focus variation microscope. The paper presents a novel and low-cost material measure and procedures that are used to determine the characteristics. The material measure is made of stainless steel with a cross-grating grid of hemispherical grooves. The design, manufacturing and calibration of the material measure are discussed. The (20 × 20) mm grid is measured with and without image stitching. The results show that the proposed material measure and procedures can be used to determine the error of the amplification, linearity and perpendicularity characteristics. In addition, the lateral stage error can be significantly reduced by measurement with image stitching.1. Introduction
Areal surface topography measuring instruments are used to characterise functional surfaces with both stochastic and deterministic features [1]. Calibration of the instruments is important to maintain the traceability of their measurement results. The draft international standard ISO/DIS 25178 part 600 [2,3] recommends the determination of a series of defined metrological characteristics (MCs) to calibrate surface topography instruments. These MCs can be used for calibration of all types of surface topography instruments that use the areal topography configuration defined in ISO 25178 part 6 [4]. By using the defined MCs, different surface topography instruments can be quantitatively compared [3] and specified. Methods for determining the MCs were developed in ISO Technical Committee 213 Working Group 16 and early work was published by the National Physical Laboratory [5,6,7] for contact stylus instruments, imaging confocal microscopy and coherence scanning interferometry. MCs are defined in ISO/DIS 25178 part 600 as ‘characteristics of measuring equipment which may influence the results of the measurement’. This definition highlights the importance of MCs, which can contribute immediately to the measurement uncertainty [2,8]. The MCs for areal surface topography instruments include: measurement noise, flatness deviation, amplification coefficient, linearity deviation, x-y
2 directly, including focus variation microscopy (FVM), but not those that measure statistical parameters of a surface (i.e. use the area-integrating method) [1].
FVM is an areal measuring technique [1,9] that operates using optical microscope optics with a limited depth of focus objective lens. FVM reconstructs a surface by detecting the height at each position along the surface based on the sharpness of a surface image from an image-stack captured during a scan through focus in z-direction. The sharpness at a pixel is calculated with respect to their pre-defined neighbour pixels. However, FVM has difficulty when measuring surfaces that are highly reflective and have a lack of texture (approximately with Ra less than 10 nm but this value is objective dependent) or other contrast-producing phenomena [10,11,12]. With such surfaces, it is difficult to calculate the sharpness (contrast) for each pixel, corresponding to a specific spatial location on a measured surface, with respect to its neighbouring pixels. The calculated sharpness value will be too small to determine the height position with the largest sharpness value within the image stack. A replica method is commonly used with smooth and texture-lacking surfaces with FVM [10,13], where the replica effectively provides the contrast mechanism.
The MCs are determined using material measures and procedures which are currently still under debate in the ISO working group [14]. According to the default procedures under development, each MC is determined using specified material measures, such as using an optical flat for measurement noise and flatness deviation, and a cross-grating for the amplification, linearity and x-y perpendicularity [3]. However, there is still a lack of suitable material measures that can be used to determine the MCs for FVM, because most commercial material measures have smooth surfaces. Hence, new material measures for FVM need to be designed, manufactured and calibrated.
3 2. Material measure and procedures
2.1 Material measure
The determination of the lateral amplification, linearity and perpendicularity characteristics requires a calibrated material measure in the form of a two-dimensional (2D) cross-grating [4]. The cross-grating can be used to establish the scales of the 𝑥- and 𝑦-axes. FVM cannot measure commonly available cross-gratings that are smooth. Therefore, a new cross-grating artefact that can be measured with FVM needs to be designed and manufactured to calibrate the lateral performance.
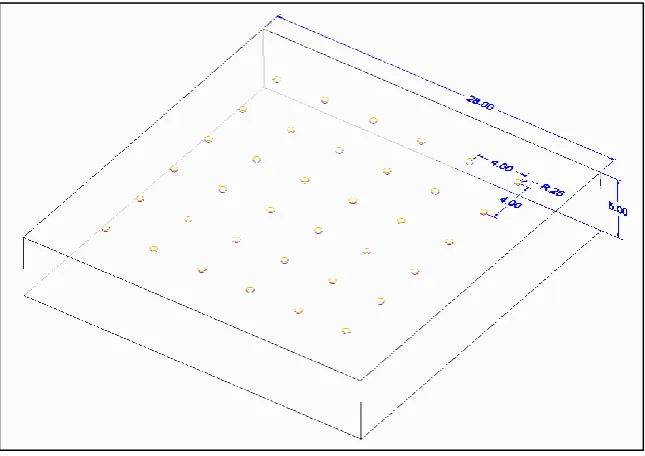
The proposed cross-grating artefact has hemispherical groove features (called “calottes” from now onwards) produced by a Kern Evo high-precision micro-milling machine from a block of stainless steel (grade 303). The artefact design is a square block of size of 28 mm with 5 mm thickness, and contains thirty-six calottes with nominal diameters of 0.5 mm. The nominal distance between two calottes is 4 mm. The artefact is designed to capture the scale error of the 𝑥𝑦-stage for measurements both with and without stitching, and is presented in Figure 1, which shows the nominal length and thickness of the artefact. The thirty-six calottes are in the form of a 6 × 6 grid. The total area of the grid is (24×24) mm. This selection is based on common multiple image-field measurements that are usually within an area from (3×3) mm to (15×15) mm.
4 Figure 1: The artefact design.
Figure 2:The manufactured artefact.
2.2 Calibration of the material measures
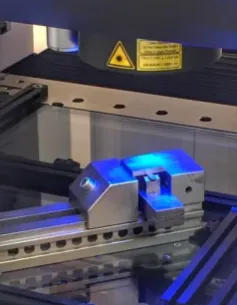
[image:4.595.232.380.371.514.2]5 strategy (ISO/TS 15530-2) [16], the volumetric error of the CMM is taken into account as a contributor for the combined standard uncertainty estimation of the artefact’s measurement results. Figure 3 shows the artefact calibration with the CMM, where one of the four artefact calibration positions is shown. The artefact position is not parallel to the CMM’s x- and y-axes (skewed position) so that the CMM will move both the x- and y-axes to reach each calotte. By moving both axes, the errors from both axes are taken into account as influence factors in the uncertainty estimation of the calottes’ centre measurements. The callotes’ centre measurements were carried out by the CMM optical-head with a 2D vision system. For the traceability, the measurement of a calibrated gauge block was carried out by using the tactile sensor of the CMM.
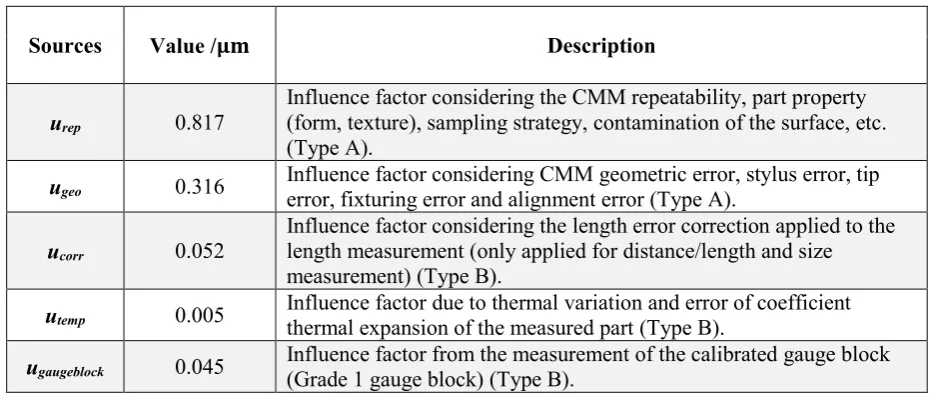
[image:5.595.64.530.553.752.2]The location of the centre of each calotte was measured and the centre distances between pairs of calottes were calculated. The centre locations are obtained by an image processing algorithm that extracts the points of the detected circle of callotes and associates a circle geometry to the extracted points to obtain the centre location of the callotes. Table 1 shows details of the uncertainty estimation for the centre distance and maximum combined uncertainty of a distance between two calottes on the artefact. In Table 1, all influence factors are detailed. The factors consider the CMM repeatability, CMM geometric error, temperature variation and uncertainty for the length measurement of a Grade 1 gauge block. The measurement uncertainty of the length (the centre distance between two calottes) was estimated according to ISO/DTS 15530-2 for calibration with a CMM [16]. Traceability of the calibration results is established with a substitution measurement of the gauge block, with the tactile sensor of the CMM, with nominal length 4 mm (equal to the nominal length being calibrated).
Table 1: All influence factors of the calibration process. The calculation for the largest uncertainty among all the centre distances is shown.
Sources Value /𝛍𝐦 Description
urep 0.817
Influence factor considering the CMM repeatability, part property (form, texture), sampling strategy, contamination of the surface, etc. (Type A).
ugeo 0.316 Influence factor considering CMM geometric error, stylus error, tip error, fixturing error and alignment error (Type A).
ucorr 0.052
Influence factor considering the length error correction applied to the length measurement (only applied for distance/length and size measurement) (Type B).
utemp 0.005 Influence factor due to thermal variation and error of coefficient thermal expansion of the measured part (Type B).
6
[image:6.595.238.357.159.312.2]utotal 0.88 Combined standard uncertainty
Figure 3: The artefact calibration with the CMM.
2.3 Experimental design
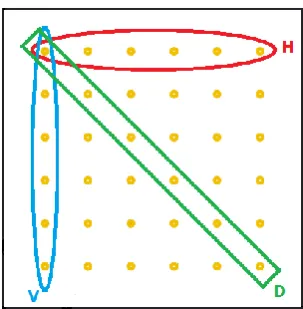
7 Figure 4: Horizontal (H), vertical (V) and diagonal (D) directions of the measurements.
3. Lateral scale calibration results
3.1 Amplification and linearity deviation
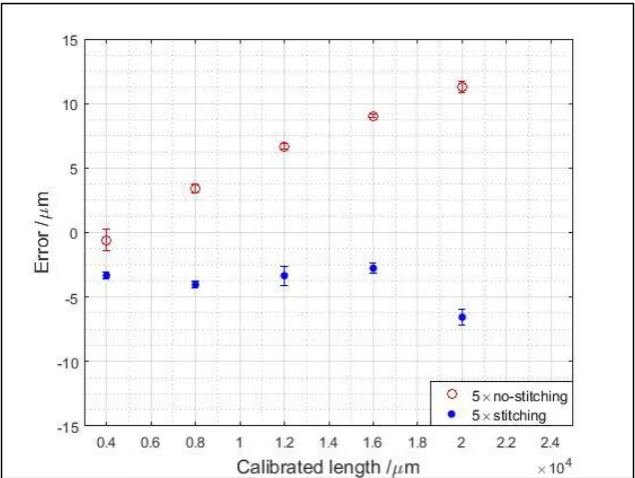
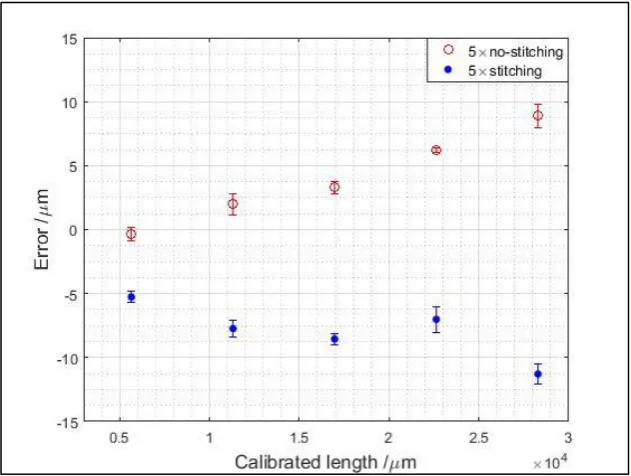
The amplification and linearity of the xy-stage are determined by calculating the errors between two calottes’ centres from measurements in the x-, y- and diagonal directions. The callote centres are calculated as the centre of a sphere associated to the 3D point cloud of the callottes. An error is defined as the difference between a calibrated length (measured by CMM) and a length measured by FVM. The length is the distance between two calottes’ centres. The results show different errors for the measurements carried out in different measuring directions with both the objectives 5× and 10× and with and without stitching. In addition, the results show that the choice of the different objective lenses does not significantly affect the error, but the use of stitching does have a significant effect
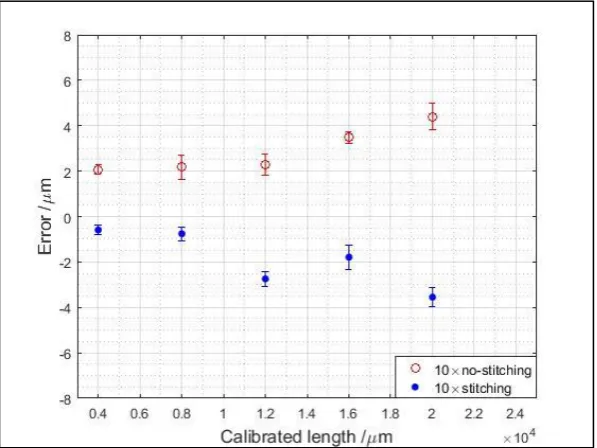
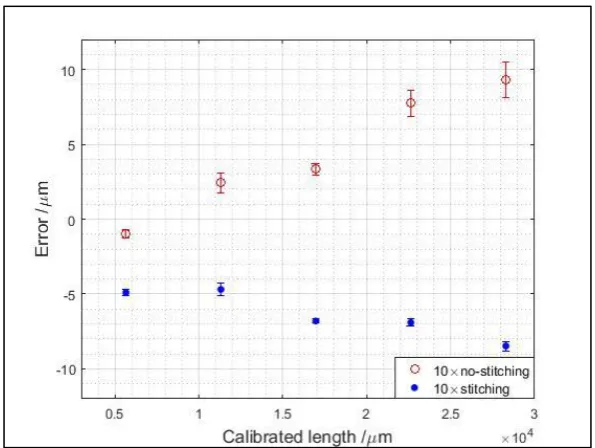
8 From the non-stitching measurements with both the 5× and 10× objective lenses, the results show that the lateral error of the stage is the largest in the 𝑥-direction. Since the non-stitching strategy measures each calotte separately to calculate their centre positions, their errors cannot be numerically compensated. Numerical compensations are applied by stitching overlapping surfaces when the calottes are measured. The measurement results obtained by the 10× objective lens with the stitching method have lower errors than the measurements obtained by the 5× objective lens. Lager numbers of images for stitching are obtained to reconstruct the measured surfaces with the 10× objective lens due to a smaller field of view. Subsequently, with larger numbers of images for stitching, compensation of the stage’s error can be improved so that the measurement error is reduced. The higher error of the non-stitching method may due to the backlash of the xy-stage screw thread. The errors from non-stitching measurement increase linearly proportional to the measured length, which is typical for the backlash of a linear stage [17].
[image:8.595.139.457.487.726.2]The measurement uncertainty of length errors considers several influence factors: the standard error from measurement repetitions, the uncertainty of the length calibration, the error due to the material expansion and the error in the estimation of the coefficient of the material’s thermal expansion coefficient. Table 2 shows the influence factors that contribute to the measurement uncertainty. In Table 2, the largest uncertainty estimation corresponding to a 20 mm length measurement is shown. The combined standard uncertainty for the 20 mm length measurement is 1.48 μm.
9 Figure 6: Results of the error calculation for the 5× objective in the vertical direction.
[image:9.595.140.456.398.636.2]10 Figure 8: Results of the error calculation for the10х objective in the horizontal direction.
[image:10.595.149.448.377.601.2]11 Figure 10: Results of the error calculation for the 10х objective in the diagonal direction.
Table 2: Measurement uncertainty estimation and its influence factors. The shown estimated combined uncertainty is the largest uncertainty estimation among the errors measured with the 5× and
10× objective lenses corresponding to a 20 mm length measurement. Uncertainty
contributor
Value / 𝛍𝐦 Description
urep 1.17 Standard error from multiple measurements (Type A).
utemp 0.23 Uncertainty due to stainless steel coefficient of thermal expansion
(CTE) 11.7 × 10⁻⁶ K−1 and ΔT =1 °C) (Type B).
uCTE 0.023 Uncertainty due to error in the CTE estimation (10 % CTE) (Type B).
utrace 0.88 Uncertainty of calibration of the length (Type B).
utotal 1.48 Combined uncertainty
According to the results of an analysis of variance (ANOVA), the length measurement errors obtained with the 5× and 10× objectives are statistically similar for all the measurements in x-, y- and diagonal
[image:11.595.72.526.422.547.2]12 In summary, the results of the amplification coefficient (𝛼) and linearity deviation (l), following their definition in ISO/DIS 25178 [2], are numerically presented in Table 3. From Table 3, the calculated amplification coefficients show that the measurements with stitching tend to decrease the measured distance and the measurements without stitching tend to increase the measured distance between the centres of two callottes. The amplification coefficients calculated from the measurements with stitching have value less than one unity, meaning the measured distances are shorter than the calibrated distance. In contrast, the coefficients calculated from measurements without stitching have values more than unity, meaning the measured distances are longer than the calibrated distances. From the calculated linearity deviation shown in Table 3, the results show that, even though the measurements with stitching decrease the stage errors, they also increase the non-linearity. It is worth noting that the stage error and linearity deviation are different. The stage errors show the difference between a measured and calibrated distance between two callottes’ centres, while linearity deviations show the maximum difference between the measured data and the line from which the amplification coefficient is derived [2].
Table 3: The calculated values of amplification coefficient and linearity deviation.
5× 10×
Amplification coefficeint (α) stitching non-stitching stitching non-stitching
αx 0.99987 1.0007 0.99992 1.00069
αy 0.99971 1.00016 0.99982 1.00015
αdiagonal 0.9998 1.0004 0.99983 1.00045
Linearity deviation (l) stitching non-stitching stitching non-stitching
lx/µm 1.24 0.51 0.41 0.21
ly /µm 0.84 0.60 0.61 0.42
ldiagonal /µm 1.47 0.51 0.51 0.73
3.2 Perpendicularity deviation
The perpendicularity deviation is obtained by calculating the differences of the angles between the
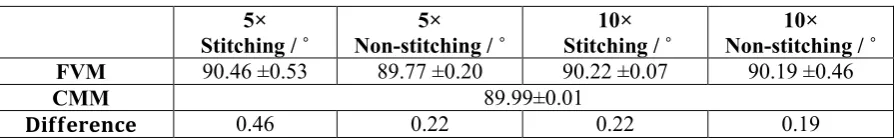
13 results of all perpendicularity deviations. From Table 4, the maximum differences for the perpendicularity deviation for both stitching and non-stitching measuring strategies, and both the objective lenses are around ± 0.2˚. Giusca et al. [6] also found a similar perpendicularity deviation of 0.3˚ with a coherence scanning interferometer.
Table 4: Results of perpendicularity deviation (± standard deviation of the mean). 5×
Stitching / ˚
5× Non-stitching / ˚
10×
Stitching / ˚ 10× Non-stitching / ˚
FVM 90.46 ±0.53 89.77 ±0.20 90.22 ±0.07 90.19 ±0.46
CMM 89.99±0.01
𝐃𝐢𝐟𝐟𝐞𝐫𝐞𝐧𝐜𝐞 0.46 0.22 0.22 0.19
3.3 Amplification and linearity errors in 2D
The amplification and linearity deviation in 𝑥𝑦-directions are presented as 2D error maps. The 2D error maps for measurements with the 5× and 10× objectives lenses are shown in Figure 11 and Figure 12 respectively. For all the measurements, stitching is employed and the measurements cover the whole surface of the artefact. All the calottes’ centre locations are calculated from the average of three repeated measurements. The coordinates of the calculated centres are mathematically aligned, by least-squares fitting a line to the callottes’ central position, calculating the angle of the fitted line with respect to the
14 Figure 11: 2D error map for the measurement obtained with the 5× objective lens (the FVM data is
[image:14.595.164.433.397.618.2]red and the CMM is blue).
Figure 12: 2D error map for the measurement obtained with the 10× objective lens (the FVM data is red and the CMM is blue).
15 4. Conclusion and future work
This paper presents the calibration of the lateral scale for FVM by determining its amplification, linearity and perpendicularity characteristics. A novel and low-cost calibrated cross-grating artefact, consisting of a grid of calottes, and procedures for the determination of linearity, amplification and perpendicularity characteristics have been proposed. As part of this study for determining the characteristics, two objective lenses of 5× and 10× were used to measure the proposed cross-grating artefact with both stitching and non-stitching strategies. Measurements in the horizontal, vertical and diagonal directions, along with measurements of the entire grid of calottes, were carried out. The results from the measurements of the proposed cross-grating artefact indicate that:
1. Measurements with stitching can reduce errors in the 𝑥- and 𝑦-directions, but not in the diagonal direction.
2. Measurements in 2D direction has 15 % larger errors than measurements in only one direction. 3. Measurements with stitching can significantly reduce lateral stage error, but increase the
non-linearity of the error.
16 Acknowledgements
This work was supported by the Engineering and Physical Sciences Research Council [grant number EP/M008983/1] and King Abdulaziz City for Science and Technology (KACST) of the Saudi Government.
References
[1] Leach R K 2011 Optical Measurement of Surface Topography (Berlin: Springer)
[2] ISO/DIS 25178: 600 2017 Geometrical product specifications (GPS) — Surface texture: Areal — Part 600: Metrological characteristics for areal-topography measuring methods
[3] Leach R K, Giusca, C L, Haitjema H, Evans C, Jiang X 2015 Calibration and verification of areal surface texture measuring instruments Ann. CIRP 64 797-813
[4] ISO25178-6 2010 Geometrical product specifications (GPS) — Surface texture: Areal — Part 6: Classification of methods for measuring surface texture
[5] Giusca C L, Leach R K, Helary F, Gutauskas T, Nimishakavi L 2012 Calibration of the scales of areal surface topography-measuring instruments: part 1. Measurement noise and residual flatness Meas. Sci. Technol. 23 035008
[6] Giusca C L, Leach R K, Helery F 2012 Calibration of the scales of areal surface topography measuring instruments: part 2. Amplification, linearity and squareness Meas. Sci. Technol. 23 065005
[7] Giusca C, Leach R K 2013 Calibration of the scales of areal surface topography measuring instruments: part 3. Resolution.Meas. Sci. Technol. 24 105010
[8] Leach R K 2014 Fundamental Principles of Engineering Nanometrology 2nd ed. (UK: Elsevier) [9] Hiersemenzel F, Petzing J, Leach R K, Helmli F, Singh J 2012 Areal texture and angle measurements of tilted surfaces using focus variation methods. In: Proc. 3rd Int. Conf. Surf. Metrol., Annecy, France, March 21-23
[10] Danzl R, Helmli F, Scherer S 2009 Focus variation–a new technology for high resolution optical 3D surface metrology Proc. 10th Int. Conf. Slovenian Society for Non-Destructive Testing “Application of Contemporary Non-Destructive Testing in Engineering”, Ljubljana, Slovenia, September 1-3, 481-491
17 [12] Moroni G, Syam WP, Petrò S 2018 A simulation method to estimate task-specific uncertainty
in 3D microscopy Measurement in press. doi: https://doi.org/10.1016/j.measurement.2018.01.026
[13] Macdonald D 2014 The application of focus variation microscopy for lithic use-wear quantification J. Archaeol. Sci. 48 26-33
[14] ISO/DIS 25178: 700 2016 Geometrical product specifications (GPS) — Surface texture: Areal — Part 700: Calibration and verification of areal topography measuring instruments (International Organization for Standardisation: Geneva)
[15] Giusca C L, Claverley J, Sun W, Leach R K, Helmli F, Chavigner M 2014 Practical estimation of measurement noise and flatness deviation on focus variation microscopes Ann. CIRP 63 545-548
[16] ISO/DTS 15530-2 2007 Geometrical product specifications (GPS) — Coordinate measuring machines (CMM): Technique for determining the uncertainty of measurement — Part 2: Use of multiple measurement strategies (International Organization for Standardisation: Geneva) [17] Smith S T 2018 Precision machine principles and elements. In: Leach R K, Smith S T Basics
of precison engineering (CRC Press)
[18] Daemi B, Ekberg P, Mattsson 2017 Lateral performance evaluation of laser micromachining by high precision optical metrology and image analysis Precis. Eng. 50 8-19