in focus
INDUSTRY, TRADE
AND SERVICES
THEME 4 22/2000 ,
C o n t e n t s
Revision of the weights during
the summer of 2000 1
Role of weights in European and activity aggregations 2
Why revise the weights? 2
The extent of changes 3
Revision of the w e i g h t s
system for STS data
Gunter Schäfer
A number of monthly indices are provided regularly by the Member States within the context of the Shortterm Statistics Regulation (no. 1165/98). During mid2000 Eurostat carried out a revision of the weights system that is employed in the creation of the shortterm statistics database, EBT (European Business Trends).
The work started with the index of production, a leading business cycle indicator, where the weights are based on value added at factor cost. The revision of these weights is used as an example in this document as at the time of writing, the weights were being revised for the other indices, as well as being checked by the Member States^
Revision of the weights during the summer of 2000
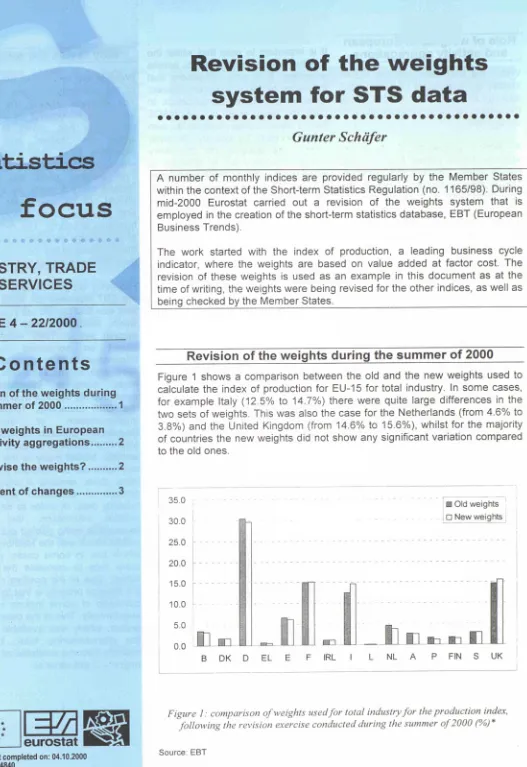
Figure 1 shows a comparison between the old and the new weights used to calculate the index of production for EU15 for total industry. In some cases, for example Italy (12.5% to 14.7%) there were quite large differences in the two sets of weights. This was also the case for the Netherlands (from 4.6% to 3.8%) and the United Kingdom (from 14.6% to 15.6%), whilst for the majority of countries the new weights did not show any significant variation compared to the old ones.
■ Old weights D New weights
Manuscript completed on: 04.10.2000
ISSN 1561-4840
Catalogue number: CANPOO022ENC
Price in Luxembourg per single copy
(excl.VAT):EUR6
© European Communities, 2000
Figure 1: comparison of weights used for total industry for the production index, following the revision exercise conducted during the summer of '2000 (%) *
Source: EBT
[image:1.595.60.587.18.785.2] [image:1.595.219.580.503.691.2]Role of weights in European
and activity aggregations
Within the EBT database the EU15 indices are calculated as a weighted average of the national indices, using the shares of each Member State in the EU total.
A similar procedure exists when aggregating to higher levels of the NACE Rev. 1 activity classification. NACE Rev. 1 Groups have to be consistent with the information on Classes, Divisions should likewise be derived from the information on Groups. These procedures continue by aggregating Divisions to Sub sections and finally Sections. The MIGS (Main Industrial Groupings) are regroupings created from activities corresponding to the 3digit level of NACE 1.
Each index requires its own set of unique weights based on a relevant indicator. For the index of production, Eurostat uses gross value added at factor costs to calculate the weights.
Other indices, such as the
employment index are based on their own specific indicator (in this case, the number of persons employed). In the majority of cases, the information is derived from the structural business statistics database, SBS.
The definition of the MIGs was voted at the Statistical Programme Committee in November 2000. This summary classification comprises five categories: energy, intermediate goods, capital goods, consumer durables and consumer non-durables.
It is important to note that whilst the weights need to sum to 100% across countries, it is also necessary that they sum to 100% between different levels of the activity classification. In addition, each level of the NACE Rev. 1 classification requires its own set of weights by country. In other words, the weights for the dairy products industry will be different to those used in the alcoholic beverages industry. The basic formula used in the calculation of aggregates is as follows:
QA,,=
JVA
K0xQ
KtΣ
ν
Αο
b=lwith 0 the base year, VA value added, Q the production index, A the level of aggregation to calculate, and B the sub-levels used for the aggregation (countries or NACE Rev. 1 activities).
Why revise the weights?
Weights are revised as the structure of the economy changes over time. For example, during the last five years the importance of information technology has grown in Europe, whilst the textiles and clothing industries have seen their relative share of economic activity decline. The weights used are generally revised every 5 years. As such there should not be any major structural shift in the composition of the business economy. The recalculation of the weights normally coincides with the rebasing of the indices, with base year values being set to 100.
However, weights already existed in the EBT database for 1995 as this task was first carried out in early 1999 when switching base year. The original set of 1995 weights were
based on somewhat incomplete
information, with many missing data filled with estimates. Given that far
more complete information has
subsequently become available within the SBS database, following the
implementation of the SBS
Regulation, Eurostat decided that it would be beneficial to revise the 1995 weights. Whilst many of the previous estimates can be replaced with official data, there remains a considerable amount of estimation work to fill missing data. In order to have more reliable information, the revision exercise is being carried out in close collaboration with the Member States, which are, in some cases, providing extra data to complete the weights tables. One of the positive results of the revision process is that the activity coverage of some indices will grow substantially. This is the case for new orders, which was available for just the manufacturing total, but has recently become available across the majority of industrial activities.
Statistics in focus — Theme 4 — 22/2000 ■
m
The extent of changes
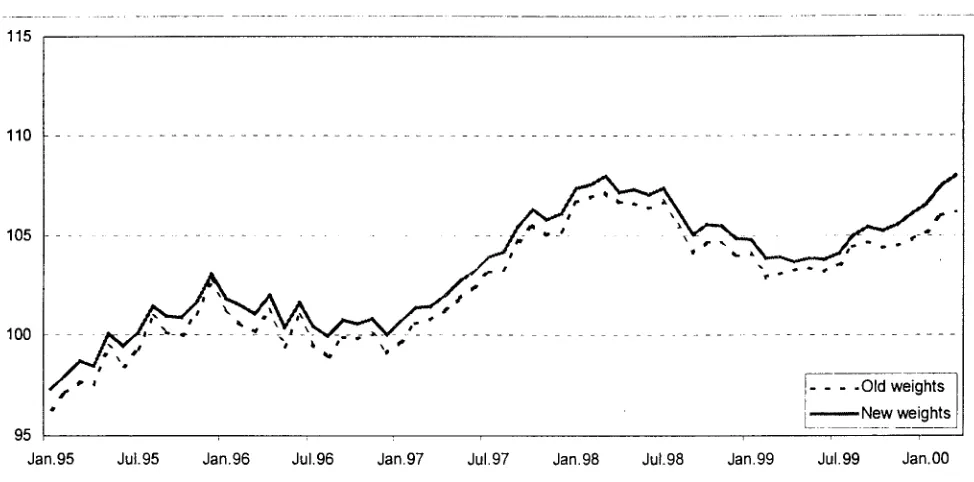
The major benefit of revising the weights should be seen at lower levels of aggregation, when more detailed NACE Rev. 1 activities are being studied. This is mainly due to the greater availability of structural data used to produce the weights, as well as the cooperation of the Member States in revising the estimates for missing structural data. Figures 2 and 3 show plots of the production index before and after the revision of the weights for total industry and the manufacture of rubber and plastic products (a 2digit NACE Rev. 1 activity). As one can see, the differences recorded for the total industry aggregate are small in size, whilst at lower levels of NACE there may be larger changes observed in the levels of the respective indices.
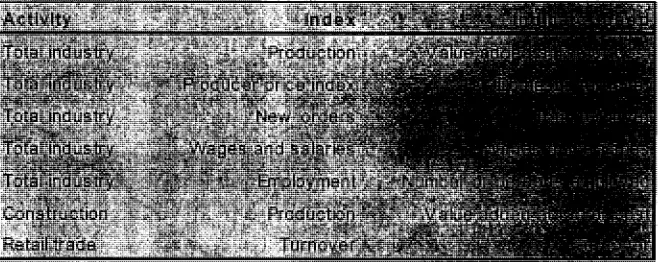
Activity
[image:3.595.224.553.82.213.2]Total industry
Total ír||us¿ny ';
..-•<¡'t '•:.«'.V-t:·'1 · ■"
Tptelarid$s'tíjr:.?
* ■ »
Tpfal.íind.ustry.
Total industry
Construction Retail trade
index J ■ . ' „■«&;inöfe
i..' P r o d u c t i o n ' : . ' > ^ * ^ ^ Ι ^ ^ Μ Κ ^ §
.NV.Wagé&'and'salariét^aHE&i'^aöPla^S
;■;;.' ν * ^Ploynfienn^i^jíiíiiTO^^^^Or^ Production ' Value addfalÏP*1
•V ·.■'·■·■ ■". •'•'■■"''^'^trawraMŒi
Turnover * ' , , * " ?
Æox /: indicators used to derive the weights in the STS database
Source: EBT
115
110
105
100
95
Old weights »New weights Jan.95 Jul.95 Jan.96 Jul.96 Jan.97 Jul.97 Jan.98 Jul.98 Jan.99 Jul.99 Jan.00
Figure 2: production index for total industry, EU-15 (1995=100)
Source: EBT
115
110
105
100
95
J^y^^
' s ' ' - - - -Old weights
* ι New weights
, , , . , , , , , 1
[image:4.595.55.542.57.298.2]Jan.95 Jul.95 Jan.96 Jul.96 Jan.97 Jul.97 Jan.98 Jul.98 Jan.99 Jul.99 Jan.00
Figure 3: production index for the manufacture of rubber and plastic products, EU-15 (1995=100)
Source: EBT
Table 1 shows a summary of the differences observed in the value added weights at different levels of
the activity classification. The
absolute value of the difference between the new weights and the old weights was calculated for total industry (first column) and for each NACE Rev. 1 heading at the most
detailed level of the activity
breakdown available (second
column)2.
There is a clear difference in the scale of the revisions across different levels of the activity classification. Italy, the Netherlands and the United Kingdom reported some of the largest changes in terms of the weights for total industry. At more detailed levels of the NACE Rev. 1 classification there were also substantial revisions of the respective weights for Germany
and France. Changes in the weights of Spain, Ireland and Portugal may in part be explained by a structural shift in production away from the larger EU economies towards these Member States.
C o u n t r y Β DK D EL E F
IRL
I L NL A Ρ FIN
s
UK
T o t a l i n d u s t r y
0.36 0.09 0.75 0.06 0.36 0.05 0.02
2.22
0.01 0.77 0.11
0.44
0.20
0.04 0.94
[image:4.595.234.560.455.643.2]D e t a i l e d N A C E b r e a k d o w n 2 . 2 3 0.73 5.19 0.50 2.11 3.81 1.35 7.61 0.25 3.14 2.28 1.73 0.76 0.69 3.64
Table 1: average absolute differences observed between the new weights and the old weights (%) *
Source: EBT
* // is important to note that whilst the relative differences in the weights of smaller countries
2 Usuallv 3- or 4-disit NACE Rev I may not vary much, the absolute changes could be considerable, headings.
Statistics in f o c u s — Theme 4 — 22/2000 ■
35.0
30.0
25.0
20.0
15.0
10.0
5.0
0.0
lu
■ Old weights
D New we i g hts
Β DK D EL E F IRL I L NL Α Ρ FIN S UK
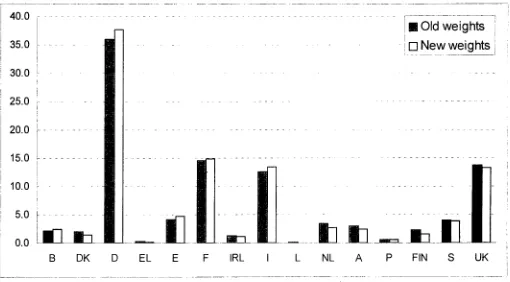
Figure 4: comparison of weights used for intermediate goods for the production index, following the revision exercise conducted during the summer of 2000 (%) *
M
Old weights
D New weights
Β DK D EL E F IRL I L NL A Ρ FIN S UK
FigureS : comparison of weights used for capital goods for the production index, following the revision exercise conducted during the summer of 2000 (%) *
* It is important to note that whilst the relative differences in the weights of smaller countries may not vary much, the absolute changes could be considerable.
\m
eurostat
[image:5.595.43.553.388.670.2]■ Old weights
□ New weights
[image:6.595.48.560.43.320.2]Β DK D EL E F IRL I L NL A Ρ FIN S UK
Figure 6: comparison of weights used for durable consumer goods for the production index, following the revision exercise conducted during the summer of 2000 (%) *
30.0
25.0 \
20.0
15.0
10.0
5.0 0.0
■ Old weights
D New weights
Β DK D EL E F IRL L NL A Ρ FIN S UK
Figure 7: comparison of weights used for non-durable consumer goods for the production index, following the revision exercise conducted during the summer of 2000 (%) *
* It is important to note that whilst the relative differences in the weights of smaller countries may not vary much, the absolute changes could be considerable.
S t a t i s t i c s in f o c u s — Theme 4 — 22/2000 ■
m
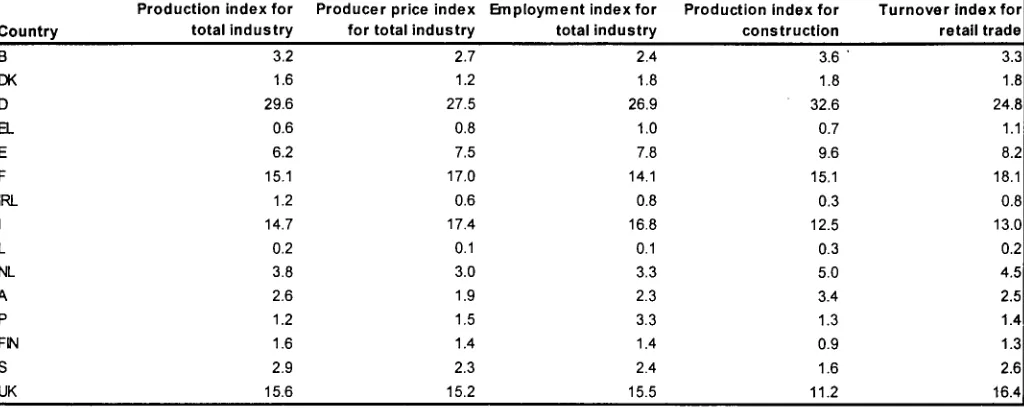
[image:6.595.47.560.388.670.2]Country Β DK D a E F IRL I L NL A Ρ FIN S UK Production total index for industry 3.2 1.6 29.6 0.6 6.2 15.1 1.2 14.7 0.2 3.8 2.6 1.2 1.6 2.9 15.6
Producer price for total ind
index ustry 2.7 1.2 27.5 0.8 7.5 17.0 0.6 17.4 0.1 3.0 1.9 1.5 1.4 2.3 15.2 Employment total nde ind xfor ustry 2.4 1.8 26.9 1.0 7.8 14.1 0.8 16.8 0.1 3.3 2.3 3.3 1.4 2.4 15.5
Production index for construction 3.6 ' 1.8 32.6 0.7 9.6 15.1 0.3 12.5 0.3 5.0 3.4 1.3 0.9 1.6 11.2
[image:7.595.43.555.64.268.2]Turnover Index for retail trade 3.3 1.8 24.8 1.1 8.2 18.1 0.8 13.0 0.2 4.5 2.5 1.4 1.3 2.6 16.4
Table 2: new weights for leading indicators within the EBT database, as implemented during the summer and autumn of 2000 (%)
Source: EBT
> ESSENTIAL INFORMATION - METHODOLOGICAL NOTES
Some important methodological
issues are linked with the production and publication of the weights. To calculate activity and geographical aggregates it is necessary to have a complete set of weights available. Some of the structural data involved in the calculation of these weights is confidential. This is especially the
case for smaller countries or
detailed NACE Rev. 1 activities. The publication of these weights could
make it possible to disclose
confidential information and for this
reason only the indices are
published and not the weights
themselves. The verification of
weights used in the EBT database has been carried out with each Member State separately.
A second type of problem is linked
to monetary conversions. The
structural data used to calculate the weights is usually expressed in ECU terms. The data was originally converted using the average 1995 exchange rates. Before the parities with the euro were fixed, some of these exchange rates were subject to relatively high variability. This was particularly the case for Italy and the United Kingdom. To "correct" the exchange rates, an adjustment was
made by dividing the 1995 average exchange rates by the average for the period 1993-1997 and applying this correction coefficient to the whole series.
There were some common
problems across countries that were
faced when estimating missing
structural data to complete the set of weights. Typical problems included:
1. Data missing for 1995 but available for 1996 or 1997. In
these cases the internal
structure of a given activity such as, for example, shares of
4-digit activities in 3-digit
aggregates was derived from the more recent years and applied to the available 1995 data.
2. In some cases, where data for a
particular activity was not
available, the shares were
calculated on a different country under the hypothesis of a similar economic structure.
3. Some data was only available for enterprises with 20 or more
persons employed. This
problem appeared for 1995, and it was generally possible to find alternative structural data from more recent years, 1996 or 1997, covering enterprises of all size classes.
4. The variable used to calculate the weights was sometimes not available. In some cases it was possible, in agreement with the Member States, to use a proxy variable, for example value added at basic prices instead of value added at factor cost. Generally a ratio was calculated between the two variables from other countries that provided data and this ratio was applied as a correction coefficient to the original series.
In general the exercise proved useful as it improved co-operation with the Member States and led to
increased transparency in the
calculation of the short-term indices, whilst also resulting in higher quality and more standardised data.
im
eurostat
Further information:
Reference publications
Title Monthly Panorama of European Business Annual subscription Catalogue No KSAMOOOOOENC Price EUR 162
Databases
New Cronos Theme 4
Domain EBT (European Business Trends) To obtain information or to order publications, databases and special sets of data, please contact the Data Shop network:
B E L G I Q U B B E L G I Ë D A N M A R K D E U T S C H L A N D E S P A N A F R A N C E I T A L I A R o m a
Eurostat D i t a Shop Bruxelles/Brusse! Pianista! Belgique Rue du Commerce 124 Handelsstraat 124
B1000 BRUXELLES / BRUSSEL Tel. 1322) 234 67 50
Fax (3221234 67 51 Emal [email protected]
DANMARKS STATISTIK Bibliotek og Information Eura stat Data Shop Sejrøgade 11 DK2100 KØBENHAVN 0 TO. (45) 39 17 30 30 Fax (45) 39 17 30 03 Email: [email protected]
STATISTISCHES BUNDESAMT Eurostat Data Shop Berlin OttoBraunStraße 7072 (Eingang: KarlMarxAllee) D10178 BERLIN Tel. (49)1888 644 94 27/28 Fax (49) 1888644 94 30 EMail: datashop@statistJkbund.de
INE Eurostat Data Shop Paseo de la Castellana, 183 Oficina 009
Entrada por Estébanez Calderón E28046 MADRID Tel. (34) 91 583 91 67 Fax (34) 91 579 71 20 Email: [email protected]
INSEE Info Service Eurostat Data Shop 195. rue de Bercy Tour Gamma A F75582 PARIS CEDEX 12 Tél. ( 3 3 ) 1 5 3 1 7 88 44 Fax (33) 153 17 88 22 Email: [email protected]
ISTAT
Centro di Informazione Statistica Sede di Roma, Eurostat Data Shop Vìa Cesare Balbo, 11a 100184 ROMA Tel. (39) 06 46 73 31 02/06 Fax (39) 06 46 73 31 01/07 Email: [email protected]
I T A L I A M i l a n o L U X E M B O U R G N E D E R L A N D N O R G E P O R T U G A L S C H W E I Z / S U I S S E / S V I Z Z E R A
ISTAT
Ufficio Regionale per la Lombardia Eurostat Data Shop
Vìa Fieno 3 120123 MILANO Tel. (39) 02 80 61 32 460 Fax (39) 02 80 61 32 304 Email: mileuro@ùn it
Eurostat Data Shop Luxembourg BP453
L2014 LUXEMBOURG 4, rue Alphonse Weicker L2721 LUXEMBOURG Tel. (352) 43 352251 Fax (352) 43 3522221 Email: [email protected]
STATISTICS NETHERLANDS Eurostat Data ShopVoorfaurg Postbus 4000
2270 JM VOORBURG Nederland Tel. (3170) 337 49 00 Fax (3170) 337 59 84 Email: [email protected]
Statistics Norway Library and Information Centre Eurostat Data Shop Kongens gate 6 Boks 8131 Dep. N0033 OSLO Tel. (47| 22 86 46 43 Fax (47) 22 86 45 04 Εmai! Datastxx>;2sst> no
Eurostat Data Shop Lisboa INE/Serviço de Difusão Av. Antonio José de Almeida, 2 P1000043 LISBOA Tel (351)21842 6100 Fax (351) 21 842 63 64 Email: [email protected]
Statistisches Amt des Kantons Zürich, Eurostat Data Shop Bleicherweg 5
CH8090 Zürich Tel. (411)2251212 Fax (411) 225 12 99 Email: [email protected] Inlernet http://www.zh.ch/statisDk
S U O M I / F I N L A N D S V E R I G E U N I T E D K I N G D O M U N I T E D K I N G D O M U N I T E D S T A T E S O F A M E R I C A
STATISTICS FINLAND Eurostat Data Shop Helsinki Tilütokin'asto
PL2B
FIN00022 Tilastokeskus Tyõpajakatu 13 Β. 2 Kairos, Helsinki Ρ (3589) 17 34 22 21 F, (3589)17 34 22 79
Sähköposti:
datashop tilaslokeskus@UaslokBsku5 fi URL:
http//AW* nlastokeskus MWkWaatashop him
STATISTICS SWEDEN Information service Eurostat Data Shop Kartavägen 100Box 24 300 S104 51 STOCKHOLM Tfn (468) 50 69 48 01 Fax (468) 50 69 48 99 Epost [email protected] lnternethttp://www.scb.se/info/datasho p/eudatashop.asp
Eurostat Data Shop Enquiries & advice and publications
Office for National Statistics Customers & Electronic Services Unit 1 Drummond GateB1/05 LONDONSW1V2QQ United Kingdom Tel. (4420) 75 33 56 76 Fax (441633) 81 27 62 Email: [email protected]
Eurostat Data Shop Electronic Data Extractions, Enquiries & advice R.CADE 1L Mountjoy Research Centre University of Durham DURHAM DH1 3SW United Kingdom Tel:(44191) 37473 50 Fax: (44191)384 49 71 Email: rcadeiõdj ac uh Internet httpi/favwrcadedur ac uk
HAVER ANALYTICS Eurostat Data Shop 60 East 42nd Street Suite 3310 NEW YORK. NY 10165 USA
Tel. (1-212) 986 93 00
Fax (1212) 986 69 81 Email: [email protected]
Media Support Eurostat (for professional journalists only).
Bech Building Office A3/48 · L2920 Luxembourg · Tel. (352) 4301 33408 · Fax (352) 4301 32649 · email: eurostatmediasupport@cec eu int
For information on methodology
GUNTER SCHÄFER, Eurostat/D3, L 2920 Luxembourg, tel: (352) 430133566; fax: (352) 430134359; email: qunter.schaeferg)cec.eu.int
ORIGINAL: English
Please visit our web site at www.europa.eu.int/comm/eurostat/ for further information '
A list of worldwide sales outlets is available at the Office for Official Publications of the European Communities.
BELGIOUE/BELGIE DANMARK DEUTSCHLAND GREECE/ELLADA ESPANA FRANCE IRELAND ITALIA LUXEMBOURG NEDERLAND OSTERREICH PORTUGAL SUOMI/FINLAND SVERIGE UNITED KINGDOM ISLAND NORGE SCHWEIZ/SUISSE/SVIZZERA BALGARIJA CESKÄ REPUBLIKA CYPRUS EESTI HRVATSKA MAGYARORSZÁG MALTA POLSKA ROMANIA RUSSIA SLOVAKIA SLOVENIA TÜRKIYE AUSTRALIA CANADA EGYPT INDIA ISRAEL JAPAN MALAYSIA PHILIPPINES SOUTH KOREA THAILAND UNITED STATES OF AMERICA
_ %«£. .
Q Please send me a free copy of 'Eurostat MiniGuide' (catalogue containing a selection of Eurostat products and services) Language required: Π DE D EN D FR
2 rue Mercier L2985 Luxembourg Tel. (352) 2929 42118 Fax (352) 2929 42709 Internet Address http://europ.eu.int/frfgeneral/sad.htrn email: [email protected]
Order form
I would like to subscribe to Statistics in focus (from 1.1.2000 to 31.12.2000): (for the Data Shop and sales office addresses see above)
CÜ Formula 1 : All 9 themes (approximately 140 issues) Π Paper: EUR 360
Π PDF: EUR 264 Π Paper + PDF: EUR 432 ·
Language required: Π DE □ EN Π FR □ Formula 2: One or more of the following seven themes:
□ Theme 1 'General statistics'
Π Paper: EUR 42 G PDF: EUR 30 Π Combined: EUR 54 □ Theme 2 'Economy and finance'
Π Theme 3 'Population and social conditions' Π Theme 4'Industry, trade and services O Theme 5 'Agriculture and fisheries' Π Theme 6 'External trade'
□ Theme 8 'Environment and energy
Π Paper: EUR 84 Π PDF: EUR 60 Π Combined: EUR 114 Language required: Π DE D EN □ FR
□ I would like a free subscription to 'Statistical References', the information letter on Eurostat products and services
Language required: Π DE Π EN Π FR Π Mr □ Mrs Π Ms
(Please use block capitals)
Surname: Company: Function: _ Address: Post code: Country: Tel.: Email: Forename: Department: Town: Fax:
Payment on receipt of invoice, preferably by: □ Bank transfer
Π Visa □ Eurocard
Card No: Expires on:
Please confirm your intraCommunity VAT number:
If no number is entered, VAT will be automatically applied. Subsequent reimbursement will not be possible.