Statistics
in focus
INDUSTRY, TRADE AND
SERVICES
4/2006
Authors
Digna AMIL
Jessy DOLVET
C o n t e n t s
Latest trends ... 1
Production indices
for construction ... 2
Production indices for building
and civil engineering ... 3
New orders and employment... 4
Hours worked
and wages and salaries... 5
Construction costs ... 6
Residential building
permits issued... 6
Definitions ... 7
Developments in
construction
during the third quarter of 2005
Latest trends
In the third quarter of 2005, the EU-25’s seasonally adjusted index of
production for the construction sector grew slightly by 0.2 % compared with
the previous quarter. For the euro-zone, the development of the index was
very similar, as output expanded by 0.3 % during the same quarter. These
latest rates of change for both European aggregates contrasted with the
relatively rapid increase in the index of production for the construction sector
registered in the second quarter of 2005, when the index of production rose
by 2.0 % in both the EU-25 and the euro-zone.
[image:1.595.7.198.6.490.2]On the basis of a comparison with the same quarter of a year before, the
working day adjusted index of production for the EU-25's construction sector
grew by 0.9 % in the third quarter of 2005, three times as high as in the
second quarter. Output in the euro-zone grew by 0.3 % between the third
quarters of 2004 and 2005, the first time that a positive rate had been
recorded (using this measure) since the first quarter of 2004.
Table 1:
[image:1.595.222.569.416.594.2]Table 1: PRODUCTION VOLUME INDEX FOR CONSTRUCTION,
GROWTH RATES (%); SOURCE: EUROSTAT STS
Figure 1: PRODUCTION VOLUME INDEX, WORKING DAY ADJUSTED, GROWTH
RATES COMPARED TO THE SAME QUARTER OF THE PREVIOUS YEAR,
EU-25 (%); SOURCE: EUROSTAT STS
(
#
-8 -6 -4 -2 0 2
Q4-04 Q1-05 Q2-05 Q3-05
Construction Building Civil Engineering
EU-25 Euro-zone EU-25 Euro-zone
Q4-04 0.0 -0.0 Q4-04 -0.6 -0.8 Q1-05 -1.3 -2.0 Q1-05 -3.4 -4.3 Q2-05 2.0 2.0 Q2-05 0.3 -0.5 Q3-05 0.2 0.3 Q3-05 0.9 0.3
Quarter on quarter growth rates, seasonally adjusted series
2
Statistics in focus — Industry, trade and services — 4/2006 —————————————————————————#
Production indices for construction
While the index of production for the construction sector
increased by 0.2 % in the EU-25 between the second
and third quarters of 2005, more rapid growth was
recorded in a number of Member States for which data
are available. Indeed, production increased by at least
1.5 % in 11 of the Member States, with growth rising as
high as 6.5 % in Hungary and 6.1 % in Estonia. For the
remaining Member States with data available for the
third quarter of 2005, France, the United Kingdom,
Cyprus and Spain were the only other countries to
record increases in their respective indices of
production that were at least equal to the EU-25
average. At the other end of the spectrum, output within
the construction sector contracted in Luxembourg,
Ireland, Austria, Belgium and Slovenia.
On the basis of a comparison between the third quarters
of 2004 and 2005, the working day adjusted index of
production for the construction sector rose by upwards
of 10 % in each of the Baltic States, Hungary, Slovakia,
Poland and Ireland. On the other hand, a number of
Member States reported that the output of their
respective construction sectors was below its level of a
year before. This was notably the case in Portugal
(-3.9 %) and Germany (-3.8 %), and to a lesser extent in
Belgium, Slovenia, Luxembourg and the United
Kingdom.
For building, the index of production contracted by
0.3 % in the EU-25 between the second and third
quarters of 2005. The corresponding rate for the
euro-zone was -0.2 %. Both of these latest growth rates were
in contrast to those posted in the previous quarter when
output had risen by 2.2 % in the EU-25 and by 1.8 % in
the euro-zone.
[image:2.595.50.554.424.718.2]For civil engineering, developments were rather
different for the index of production in the EU-25 and the
euro-zone between the second and third quarters of
2005, with output decreasing by 0.1 % in the EU-25,
while it rose by 0.4 % in the euro-zone. For comparison,
the index of production for civil engineering was almost
unchanged (+0.1 %) in the EU-25 in the second quarter
of 2005, while it grew by 1.7 % in the euro-zone.
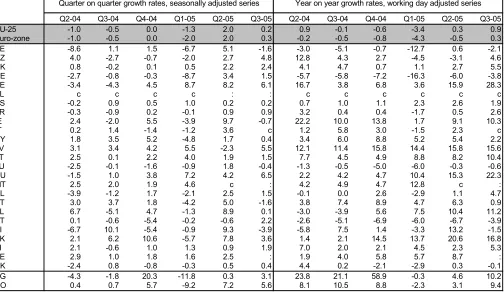
Table 2: PRODUCTION VOLUME INDEX FOR CONSTRUCTION, GROWTH RATES (%); SOURCE: EUROSTAT STS
Q2-04 Q3-04 Q4-04 Q1-05 Q2-05 Q3-05 Q2-04 Q3-04 Q4-04 Q1-05 Q2-05 Q3-05
EU-25 -1.0 -0.5 0.0 -1.3 2.0 0.2 0.9 -0.1 -0.6 -3.4 0.3 0.9
Euro-zone -1.0 -0.5 0.0 -2.0 2.0 0.3 -0.2 -0.5 -0.8 -4.3 -0.5 0.3
BE -8.6 1.1 1.5 -6.7 5.1 -1.6 -3.0 -5.1 -0.7 -12.7 0.6 -2.1
CZ 4.0 -2.7 -0.7 -2.0 2.7 4.8 12.8 4.3 2.7 -4.5 -3.1 4.6
DK 0.8 -0.2 0.1 0.5 2.2 2.4 4.1 4.7 0.7 1.1 2.7 5.5
DE -2.7 -0.8 -0.3 -8.7 3.4 1.5 -5.7 -5.8 -7.2 -16.3 -6.0 -3.8
EE -3.4 -4.3 4.5 8.7 8.2 6.1 16.7 3.8 6.8 3.6 15.9 28.3
EL c c c c : : c c c c c c
ES -0.2 0.9 0.5 1.0 0.2 0.2 0.7 1.0 1.1 2.3 2.6 1.9
FR -0.3 -0.9 0.2 -0.1 0.9 0.9 3.2 0.4 0.4 -1.7 0.5 2.6
IE 2.4 -2.0 5.5 -3.9 9.7 -0.7 22.2 10.0 13.8 1.7 9.1 10.3
IT 0.2 1.4 -1.4 -1.2 3.6 c 1.2 5.8 3.0 -1.5 2.3 c
CY 1.8 3.5 5.2 -4.8 1.7 0.4 3.4 6.0 8.8 5.2 5.4 2.2
LV 3.1 3.4 4.2 5.5 -2.3 5.5 12.1 11.4 15.8 14.4 15.8 15.6
LT 2.5 0.1 2.2 4.0 1.9 1.5 7.7 4.5 4.9 8.8 8.2 10.4
LU -2.5 -0.1 -1.6 -0.9 1.8 -0.4 -1.3 -0.5 -5.0 -6.0 -0.3 -0.6
HU -1.5 1.0 3.8 7.2 4.2 6.5 2.2 4.2 4.7 10.4 15.3 22.3
MT 2.5 2.0 1.9 4.6 c : 4.2 4.9 4.7 12.8 c :
NL -3.9 -1.2 1.7 -2.1 2.5 1.5 -0.1 0.0 2.6 -2.9 1.1 4.7
AT 3.0 3.7 1.8 -4.2 5.0 -1.6 3.8 7.4 8.9 4.7 6.3 0.9
PL 6.7 -5.1 4.7 -1.3 8.9 0.1 -3.0 -3.9 5.6 7.5 10.4 11.2
PT 0.1 -0.6 -5.4 -0.2 -0.6 2.2 -2.6 -5.1 -6.9 -6.0 -6.7 -3.9
SI -6.7 10.1 -5.4 -0.9 9.3 -3.9 -5.8 7.5 1.4 -3.3 13.2 -1.5
SK 2.1 6.2 10.6 -5.7 7.8 3.6 1.4 2.1 14.5 13.7 20.6 16.8
FI 2.1 -0.6 1.0 1.3 0.9 1.9 7.0 2.0 2.1 4.5 2.3 5.3
SE 2.9 1.0 1.8 1.6 2.5 : 1.9 4.0 5.8 5.7 8.7 :
UK -2.4 0.8 -0.8 -0.3 0.5 0.4 4.4 0.2 -2.1 -2.9 0.3 -0.1
BG -4.3 -1.8 20.3 -11.8 0.3 3.1 23.8 21.1 58.9 -0.3 4.6 10.2
RO 0.4 0.7 5.7 -9.2 7.2 5.6 8.1 10.5 8.8 -2.3 3.1 9.4
Production indices for building and civil engineering
[image:3.595.47.554.438.735.2]Table 4: PRODUCTION VOLUME INDEX FOR CIVIL ENGINEERING, GROWTH RATES (%); SOURCE: EUROSTAT STS
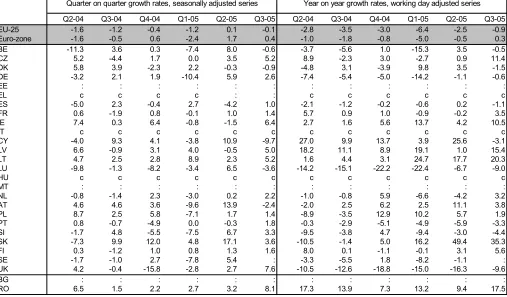
Table 3: PRODUCTION VOLUME INDEX FOR BUILDING, GROWTH RATES (%); SOURCE: EUROSTAT STS
Q2-04 Q3-04 Q4-04 Q1-05 Q2-05 Q3-05 Q2-04 Q3-04 Q4-04 Q1-05 Q2-05 Q3-05
EU-25 -0.8 -0.7 -0.1 -1.0 2.2 -0.3 2.1 0.4 -0.4 -3.2 0.6 0.8
Euro-zone -0.7 -0.8 -0.3 -1.6 1.8 -0.2 0.9 -0.3 -0.8 -4.2 -0.6 -0.2
BE -6.2 1.0 0.5 -7.5 7.2 -3.6 -2.6 -3.9 -0.2 -12.3 0.8 -4.2
CZ 3.7 -1.3 -3.3 -2.6 0.5 4.3 15.1 8.0 2.3 -5.2 -5.8 -1.2
DK 0.0 -1.3 -0.2 1.1 2.8 1.9 6.4 6.3 1.8 -0.4 2.5 5.8
DE -2.5 -2.4 -1.6 -7.6 1.9 0.8 -4.9 -6.0 -8.5 -17.3 -8.7 -5.7
EE : : : : : : : : : : : :
EL c c c c : : c c c c c c
ES 0.6 0.2 0.6 1.7 0.5 0.1 1.8 0.6 0.9 3.4 3.2 2.7
FR -0.7 -0.5 -0.1 0.0 0.9 0.6 2.0 0.1 0.2 -2.1 0.8 2.2
IE 1.4 -2.7 5.4 -4.6 12.5 -2.5 27.3 12.0 15.8 -0.8 10.1 10.3
IT c c c c c c c c c c c c
CY -0.1 3.0 6.2 -4.6 -1.2 3.6 -0.4 5.4 8.7 4.3 3.2 3.8
LV 2.4 8.6 4.8 7.8 -3.6 5.6 4.5 11.6 13.2 26.8 19.2 15.7
LT 1.3 -1.4 1.9 1.0 1.7 -1.0 11.9 4.6 6.0 4.0 2.3 2.7
LU -0.7 0.2 -0.3 -0.5 1.6 0.1 3.4 3.8 0.1 -2.4 1.6 1.7
HU c c c c c c c c c c c c
MT : : : : : : : : : : : :
NL -4.1 0.6 -1.4 -0.3 2.6 -0.3 0.5 0.6 1.7 -2.6 3.2 5.7
AT 2.8 3.9 1.6 -3.4 2.3 -0.7 6.1 9.4 9.8 5.3 4.6 -0.2
PL 6.3 -4.1 1.4 5.1 12.4 3.3 3.8 -4.5 -3.0 4.0 15.2 23.5
PT -0.2 -0.6 -5.5 -0.2 -0.8 2.4 -3.6 -6.1 -7.6 -6.6 -7.1 -4.2
SI -10.4 16.6 -7.1 4.5 14.7 -9.0 -1.5 20.8 -1.8 3.0 30.3 1.3
SK 3.5 1.8 10.4 -4.5 3.0 2.7 8.7 4.0 18.6 10.3 10.2 11.7
FI 3.9 -1.3 1.1 1.9 0.4 1.6 7.1 2.6 2.8 5.7 2.4 5.0
SE 2.2 2.3 2.4 2.5 3.2 : 3.8 7.2 8.5 8.6 12.2 :
UK -2.9 0.9 0.5 -0.2 0.4 0.0 5.8 1.4 -0.7 -1.9 1.7 0.7
BG : : : : : : : : : : : :
RO -6.1 -0.7 9.2 -18.3 6.3 -0.3 -1.0 6.9 10.2 -19.2 -4.5 0.1
Quarter on quarter growth rates, seasonally adjusted series Year on year growth rates, working day adjusted series
Q2-04 Q3-04 Q4-04 Q1-05 Q2-05 Q3-05 Q2-04 Q3-04 Q4-04 Q1-05 Q2-05 Q3-05 EU-25 -1.6 -1.2 -0.4 -1.2 0.1 -0.1 -2.8 -3.5 -3.0 -6.4 -2.5 -0.9 Euro-zone -1.6 -0.5 0.6 -2.4 1.7 0.4 -1.0 -1.8 -0.8 -5.0 -0.5 0.3
BE -11.3 3.6 0.3 -7.4 8.0 -0.6 -3.7 -5.6 1.0 -15.3 3.5 -0.5
CZ 5.2 -4.4 1.7 0.0 3.5 5.2 8.9 -2.3 3.0 -2.7 0.9 11.4
DK 5.8 3.9 -2.3 2.2 -0.3 -0.9 -4.8 3.1 -3.9 9.8 3.5 -1.5
DE -3.2 2.1 1.9 -10.4 5.9 2.6 -7.4 -5.4 -5.0 -14.2 -1.1 -0.6
EE : : : : : : : : : : : :
EL c c c c : : c c c c c c
ES -5.0 2.3 -0.4 2.7 -4.2 1.0 -2.1 -1.2 -0.2 -0.6 0.2 -1.1
FR 0.6 -1.9 0.8 -0.1 1.0 1.4 5.7 0.9 1.0 -0.9 -0.2 3.5
IE 7.4 0.3 6.4 -0.8 -1.5 6.4 2.7 1.6 5.6 13.7 4.2 10.5
IT c c c c c c c c c c c c
CY -4.0 9.3 4.1 -3.8 10.9 -9.7 27.0 9.9 13.7 3.9 25.6 -3.1
LV 6.6 -0.9 3.1 4.0 -0.5 5.0 18.2 11.1 8.9 19.1 1.0 15.4
LT 4.7 2.5 2.8 8.9 2.3 5.2 1.6 4.4 3.1 24.7 17.7 20.3
LU -9.8 -1.3 -8.2 -3.4 6.5 -3.6 -14.2 -15.1 -22.2 -22.4 -6.7 -9.0
HU c c c c c c c c c c c c
MT : : : : : : : : : : : :
NL -0.8 -1.4 2.3 -3.0 0.2 2.2 -1.0 -0.8 5.9 -6.6 -4.2 3.2
AT 4.6 4.6 3.6 -9.6 13.9 -2.4 -2.0 2.5 6.2 2.5 11.1 3.8
PL 8.7 2.5 5.8 -7.1 1.7 1.4 -8.9 -3.5 12.9 10.2 5.7 1.9
PT 0.8 -0.7 -4.9 0.0 -0.3 1.8 -0.3 -2.9 -5.1 -4.9 -5.9 -3.3
SI -1.7 4.8 -5.5 -7.5 6.7 3.3 -9.5 -3.8 4.7 -9.4 -3.0 -4.4
SK -7.3 9.9 12.0 4.8 17.1 3.6 -10.5 -1.4 5.0 16.2 49.4 35.3
FI 0.3 -1.2 1.0 0.8 1.3 1.6 8.0 0.1 -1.1 -0.1 3.1 5.6
SE -1.7 -1.0 2.7 -7.8 5.4 : -3.3 -5.5 1.8 -8.2 -1.1 :
UK 4.2 -0.4 -15.8 -2.8 2.7 7.6 -10.5 -12.6 -18.8 -15.0 -16.3 -9.6
BG : : : : : : : : : : : :
RO 6.5 1.5 2.2 2.7 3.2 8.1 17.3 13.9 7.3 13.2 9.4 17.5
4 Statistics in focus — Industry, trade and services — 4/2006 —————————————————————————
#
New orders and employment
[image:4.595.50.557.447.753.2]Table 6: EMPLOYMENT INDEX FOR CONSTRUCTION, GROWTH RATES (%); SOURCE: EUROSTAT STS
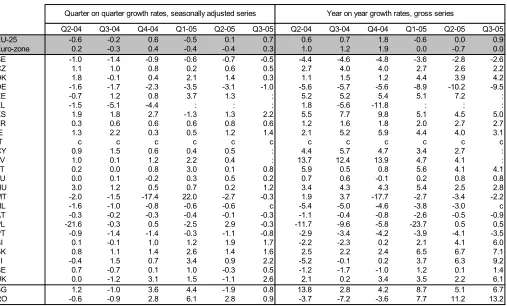
Table 5: NEW ORDERS INDEX FOR CONSTRUCTION, GROWTH RATES (%); SOURCE: EUROSTAT STS
Q2-04 Q3-04 Q4-04 Q1-05 Q2-05 Q3-05 Q2-04 Q3-04 Q4-04 Q1-05 Q2-05 Q3-05
EU-25 0.4 -1.5 4.2 1.9 1.1 1.5 5.0 3.9 6.0 1.0 9.8 8.9
Euro-zone -2.6 2.7 2.5 1.2 2.3 : 2.2 4.4 5.1 1.0 12.1 :
BE -1.7 -2.5 -1.9 3.0 0.9 2.9 7.4 4.0 -2.4 -3.7 -0.5 7.5
CZ 23.8 -2.8 -24.4 3.7 -0.4 17.9 55.0 36.1 -5.2 -8.5 -24.1 -7.9
DK -6.3 3.4 -1.2 -0.1 13.9 : 4.0 5.3 -5.2 -5.8 18.4 :
DE -5.7 -1.4 -0.5 -6.3 7.6 3.8 -6.0 -7.8 -5.6 -12.7 -1.0 4.4
EE 1.3 15.6 15.8 8.7 14.8 : -21.0 18.8 62.3 37.1 58.4 :
EL : : : : : : : : : : : :
ES -12.8 14.8 7.8 -1.3 5.4 : -1.2 12.9 17.6 6.6 28.7 :
FR 0.2 1.1 0.8 3.1 3.2 1.5 7.7 4.2 1.3 5.5 10.4 8.5
IE c c c c c c c c c c c c
IT : : : : : : : : : : : :
CY 8.5 6.6 18.7 -21.8 7.3 6.9 8.3 2.9 48.1 7.3 6.1 6.4
LV : : : : : : : : : : : :
LT -0.2 3.7 11.7 -3.0 2.8 -3.1 3.6 6.1 53.6 -8.4 20.1 24.0
LU -9.6 12.8 11.4 13.9 -35.4 63.3 -10.2 29.8 5.3 20.3 -1.9 29.1
HU 33.0 -12.7 -4.8 -5.9 -2.8 10.0 79.3 48.9 20.9 4.4 -24.0 -2.8
MT : : : : : : : : : : : :
NL c c c c c c c c c c c c
AT 0.9 4.8 3.2 0.7 -0.8 7.7 4.5 6.2 7.4 9.5 7.5 11.5
PL -6.9 -9.3 6.9 7.3 -0.7 -19.2 -19.3 -24.2 -13.7 -3.3 3.2 -8.5
PT 5.1 -17.0 13.8 2.8 0.1 -3.5 28.3 1.1 7.4 2.0 -2.8 13.0
SI 21.0 12.7 -13.2 27.4 -21.5 6.6 26.3 43.8 5.5 55.2 0.8 -4.0
SK 15.5 -4.9 -4.8 72.5 -35.0 41.6 5.4 13.7 -0.6 82.4 2.1 52.8
FI -32.5 -7.5 -5.5 12.6 21.5 -14.9 23.7 0.2 -38.4 -36.6 15.8 5.7
SE c c c c c c c c c c c c
UK -2.1 -6.1 5.0 -1.2 : : 9.4 3.5 13.2 -1.7 6.7 5.7
BG : : : : : : : : : : : :
RO 0.3 1.0 -0.4 2.7 17.9 13.6 37.5 38.1 37.3 -89.6 2.5 26.8
Quarter on quarter growth rates, seasonally adjusted series Year on year growth rates, gross series
Q2-04 Q3-04 Q4-04 Q1-05 Q2-05 Q3-05 Q2-04 Q3-04 Q4-04 Q1-05 Q2-05 Q3-05
EU-25 -0.6 -0.2 0.6 -0.5 0.1 0.7 0.6 0.7 1.8 -0.6 0.0 0.9
Euro-zone 0.2 -0.3 0.4 -0.4 -0.4 0.3 1.0 1.2 1.9 0.0 -0.7 0.0
BE -1.0 -1.4 -0.9 -0.6 -0.7 -0.5 -4.4 -4.6 -4.8 -3.6 -2.8 -2.6
CZ 1.1 1.0 0.8 0.2 0.6 0.5 2.7 4.0 4.0 2.7 2.6 2.2
DK 1.8 -0.1 0.4 2.1 1.4 0.3 1.1 1.5 1.2 4.4 3.9 4.2
DE -1.6 -1.7 -2.3 -3.5 -3.1 -1.0 -5.6 -5.7 -5.6 -8.9 -10.2 -9.5
EE -0.7 1.2 0.8 3.7 1.3 : 5.2 5.2 5.4 5.1 7.2 :
EL -1.5 -5.1 -4.4 : : : 1.8 -5.6 -11.8 : : :
ES 1.9 1.8 2.7 -1.3 1.3 2.2 5.5 7.7 9.8 5.1 4.5 5.0
FR 0.3 0.6 0.6 0.6 0.8 0.6 1.2 1.6 1.8 2.0 2.7 2.7
IE 1.3 2.2 0.3 0.5 1.2 1.4 2.1 5.2 5.9 4.4 4.0 3.1
IT c c c c c c c c c c c c
CY 0.9 1.5 0.6 0.4 0.5 : 4.4 5.7 4.7 3.4 2.7 :
LV 1.0 0.1 1.2 2.2 0.4 : 13.7 12.4 13.9 4.7 4.1 :
LT 0.2 0.0 0.8 3.0 0.1 0.8 5.9 0.5 0.8 5.6 4.1 4.1
LU 0.0 0.1 -0.2 0.3 0.5 0.2 0.7 0.6 -0.1 0.2 0.8 0.8
HU 3.0 1.2 0.5 0.7 0.2 1.2 3.4 4.3 4.3 5.4 2.5 2.8
MT -2.0 -1.5 -17.4 22.0 -2.7 -0.3 1.9 3.7 -17.7 -2.7 -3.4 -2.2
NL -1.6 -1.0 -0.8 -0.6 -0.6 c -5.4 -5.0 -4.6 -3.8 -3.0 c
AT -0.3 -0.2 -0.3 -0.4 -0.1 -0.3 -1.1 -0.4 -0.8 -2.6 -0.5 -0.9
PL -21.6 -0.3 0.5 -2.5 2.9 -0.3 -11.7 -9.6 -5.8 -23.7 0.5 0.5
PT -0.9 -1.4 -1.4 -0.3 -1.1 -0.8 -2.9 -3.4 -4.2 -3.9 -4.1 -3.5
SI 0.1 -0.1 1.0 1.2 1.9 1.7 -2.2 -2.3 0.2 2.1 4.1 6.0
SK 0.8 1.1 1.4 2.6 1.4 1.6 2.5 2.2 2.4 6.5 6.7 7.1
FI -0.4 1.5 0.7 3.4 0.9 2.2 -5.2 -0.1 0.2 3.7 6.3 9.2
SE 0.7 -0.7 0.1 1.0 -0.3 0.5 -1.2 -1.7 -1.0 1.2 0.1 1.4
UK 0.0 -1.2 3.1 1.5 -1.1 2.6 2.1 0.2 3.4 3.5 2.2 6.1
BG 1.2 -1.0 3.6 4.4 -1.9 0.8 13.8 2.8 4.2 8.7 5.1 6.7
RO -0.6 -0.9 2.8 6.1 2.8 0.9 -3.7 -7.2 -3.6 7.7 11.2 13.2
Hours worked and wages and salaries
Table 7: HOURS WORKED INDEX FOR CONSTRUCTION, GROWTH RATES (%); SOURCE: EUROSTAT STS
Q2-04 Q3-04 Q4-04 Q1-05 Q2-05 Q3-05 Q2-04 Q3-04 Q4-04 Q1-05 Q2-05 Q3-05
EU-25 0.1 0.2 -0.1 -0.5 -0.1 -0.1 0.6 0.7 0.9 -0.5 -0.7 -1.0
Euro-zone -0.4 0.0 -0.2 -1.1 0.2 -0.3 0.0 0.0 0.4 -2.2 -1.1 -1.4
BE -7.3 2.0 -0.1 -8.7 9.9 -2.2 -0.2 -8.6 1.2 -13.5 1.7 4.2
CZ 0.2 -0.3 1.5 -1.0 1.7 -0.3 7.2 1.7 4.5 -1.5 3.2 2.2
DK : : : : : : : : : : : :
DE -7.1 -2.6 -0.7 -6.7 0.1 -3.5 -6.7 -8.3 -8.2 -22.6 -8.6 -9.2
EE -2.7 3.5 2.4 1.5 3.7 : 4.6 6.5 7.0 4.5 11.5 :
EL -1.6 -6.4 -3.4 : : : -2.9 -14.5 -14.8 : : :
ES 3.0 0.7 1.8 0.8 0.1 : 5.8 6.0 7.5 5.3 3.0 :
FR 0.4 0.4 0.5 0.6 0.7 0.7 1.5 1.5 1.7 1.8 2.2 2.6
IE 5.4 4.2 3.2 2.9 -1.4 0.0 12.2 16.4 15.5 16.5 9.0 4.6
IT c c c c c : c c c c c c
CY 0.9 1.5 0.6 0.4 0.5 : 4.4 5.7 4.9 3.4 2.7 :
LV -1.1 2.5 2.0 -0.9 1.1 : 13.3 13.0 18.3 2.4 4.7 :
LT -2.5 0.0 1.0 4.7 6.2 : 4.9 -0.6 -1.0 3.1 12.8 :
LU -2.4 -0.6 -1.9 -1.4 1.1 -1.2 0.5 -2.6 -7.2 -8.3 -0.2 -2.6
HU 1.0 0.4 1.0 -1.1 2.0 0.9 5.1 4.1 4.5 0.0 2.5 3.1
MT 8.7 -12.5 -19.0 27.9 8.2 -0.7 16.8 -10.7 -26.7 -1.4 -1.9 11.3
NL -1.9 -1.3 -1.0 -0.7 -0.9 c -6.9 -6.6 -6.0 -4.7 -3.7 c
AT 0.2 0.7 -1.2 -2.7 2.7 0.1 0.8 0.9 -1.8 -4.1 0.7 -2.4
PL -0.7 -0.6 -0.5 -0.5 -0.9 -0.7 -10.1 -5.0 -6.4 8.3 -11.1 -1.9
PT -0.7 -2.0 -1.6 -0.8 -1.1 -0.4 -2.0 -4.2 -6.0 -5.3 -5.8 -3.3
SI -0.4 -0.4 -0.4 -0.8 -0.7 -0.8 -0.4 -0.2 -0.7 -2.9 -2.4 -2.0
SK -0.5 1.7 2.0 0.6 4.7 0.5 5.9 2.7 3.9 2.8 10.7 7.3
FI -1.3 1.7 0.5 1.8 3.1 0.8 -3.1 -1.2 -2.0 1.8 7.9 6.7
SE c c c c c c c c c c c c
UK 8.6 -0.8 5.2 -7.8 5.3 -4.3 6.3 5.8 5.2 3.9 1.2 -2.2
BG -0.4 -1.2 4.2 6.1 -1.1 0.2 14.2 0.9 2.9 9.5 8.2 9.3
RO c c c c c c c c c c c c
Quarter on quarter growth rates, seasonally adjusted series Year on year growth rates, gross series
Q2-04 Q3-04 Q4-04 Q1-05 Q2-05 Q3-05 Q2-04 Q3-04 Q4-04 Q1-05 Q2-05 Q3-05
EU-25 0.2 0.2 0.2 0.1 0.3 0.3 1.6 1.8 1.2 -0.1 0.9 1.1
Euro-zone -0.2 0.0 -0.2 -0.3 0.0 : 0.7 0.8 0.3 -1.5 -0.3 :
BE -1.7 -0.8 -0.1 -2.1 1.0 1.0 -2.5 -3.2 0.1 -9.2 0.3 -1.6
CZ 1.6 2.2 1.9 4.3 2.7 2.5 5.5 5.7 3.8 11.1 12.2 12.0
DK : : : : : : : : : : : :
DE -3.1 -2.3 -2.7 -4.2 -1.4 -1.9 -6.3 -6.1 -7.4 -12.5 -10.3 -9.5
EE 2.0 4.8 4.0 2.6 5.3 : 18.4 19.7 18.6 13.2 18.0 :
EL 2.6 -6.3 -2.0 : : : 7.5 -3.9 -6.0 : : :
ES 1.0 1.0 0.6 0.8 0.6 : 3.8 4.7 2.8 3.6 2.9 :
FR 1.6 0.9 1.3 0.0 3.2 : 6.7 6.3 5.7 3.8 5.5 :
IE 5.6 6.3 0.8 9.6 -0.1 0.2 14.7 20.8 17.6 24.0 17.3 10.6
IT 0.8 1.0 1.1 0.4 1.3 : 3.9 3.8 4.6 2.3 4.4 :
CY 6.2 0.3 3.7 6.1 1.2 : 8.8 5.9 6.8 17.2 11.7 :
LV 3.1 3.5 7.1 4.2 3.3 : 28.9 25.4 29.7 19.6 19.2 :
LT 1.9 4.3 4.3 10.0 3.8 : 15.0 14.1 13.4 23.2 23.6 :
LU 0.5 0.8 -0.1 1.2 1.2 0.1 4.4 2.6 0.7 2.1 3.5 2.5
HU 2.2 3.0 2.1 1.3 1.3 4.2 11.5 12.0 11.9 8.8 7.9 9.2
MT -4.7 4.3 -10.8 8.1 6.0 0.9 0.9 5.4 -2.9 -4.2 6.7 3.1
NL -1.5 -1.1 -0.9 -0.4 -0.4 c -3.0 -3.3 -3.5 -3.4 -2.2 c
AT -0.1 0.8 0.4 -0.1 1.0 0.2 0.8 1.8 1.9 -0.7 2.6 1.1
PL -1.1 -0.1 1.3 0.9 2.0 2.2 -7.0 -6.4 -2.6 1.2 4.3 6.7
PT 0.5 0.1 0.4 0.8 1.0 -0.1 4.6 2.9 2.3 1.8 2.7 2.1
SI 0.6 2.0 1.9 -1.4 2.2 1.1 5.0 6.7 7.9 3.0 4.9 4.0
SK 0.8 3.1 2.7 4.0 3.5 2.0 8.5 9.2 10.7 11.3 14.2 12.6
FI 1.0 1.1 3.1 0.8 1.6 3.4 3.6 6.6 8.7 4.3 6.6 10.6
SE c c c c c c c c c c c c
UK 1.3 1.3 0.9 -0.7 2.1 1.4 5.7 6.3 4.9 2.9 3.5 3.7
BG 0.9 -0.2 5.0 6.6 3.2 4.3 20.7 9.5 9.2 13.2 15.3 20.3
RO -4.1 16.0 -3.4 12.1 0.3 -9.4 10.9 2.5 8.8 25.7 29.1 -4.6
[image:5.595.48.556.461.760.2]6 Statistics in focus — Industry, trade and services — 4/2006 —————————————————————————
#
Construction costs
[image:6.595.45.552.99.411.2]Residential building permits issued
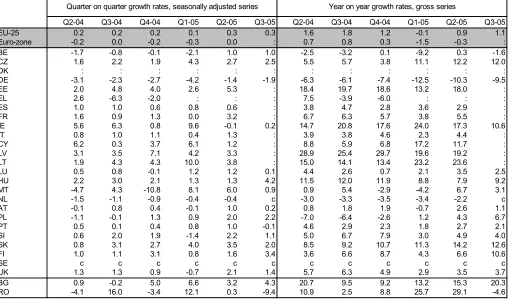
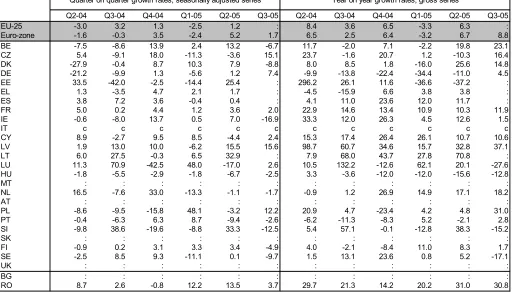
Table 10: BUILDING PERMITS: NUMBER OF DWELLINGS, GROWTH RATES (%); SOURCE: EUROSTAT STS
Table 9: CONSTRUCTION COSTS INDEX FOR RESIDENTIAL BUILDINGS, GROWTH RATES (%);
SOURCE: EUROSTAT STS
Q2-04 Q3-04 Q4-04 Q1-05 Q2-05 Q3-05 Q2-04 Q3-04 Q4-04 Q1-05 Q2-05 Q3-05
EU-25 2.0 0.9 0.9 0.9 0.5 : 6.7 5.6 5.3 4.9 3.3 :
Euro-zone 2.0 0.8 0.5 1.0 0.5 : 3.9 4.4 4.7 4.3 2.7 :
BE : : : : : : : : : : : :
CZ 1.7 0.9 0.5 0.8 0.3 0.5 3.8 4.1 4.1 4.0 2.6 2.2
DK 0.9 0.9 0.9 0.0 0.9 0.9 0.7 1.7 2.5 2.8 2.8 2.7
DE 1.1 0.3 0.1 0.4 -0.1 0.1 1.4 1.7 1.8 1.9 0.7 0.5
EE 2.6 1.3 1.1 1.2 1.8 1.7 5.0 5.9 6.6 6.4 5.5 6.0
EL 1.3 0.7 1.3 0.4 0.7 0.9 2.6 3.1 4.1 3.8 3.2 3.3
ES 3.2 1.1 0.6 2.9 1.5 : 4.9 5.6 6.3 7.9 6.1 :
FR 2.8 0.6 0.5 0.4 -0.1 : 6.3 6.6 6.4 4.3 1.3 :
IE 3.1 3.4 2.3 1.2 1.6 1.8 12.7 13.1 12.3 10.4 8.8 7.1
IT 1.8 1.2 0.6 1.3 1.1 : 3.9 5.0 5.4 4.9 4.2 :
CY 1.7 1.1 0.4 2.7 -0.3 0.5 6.9 7.0 7.3 6.0 3.9 3.4
LV : : : : : : : : : : : :
LT 4.3 3.1 1.7 0.0 2.3 3.6 5.9 8.1 9.9 9.4 7.3 7.8
LU 0.6 0.9 1.1 0.3 1.0 : 2.3 2.9 3.5 2.9 3.2 :
HU 2.6 1.0 2.8 -4.1 4.4 : 5.6 5.6 5.8 2.1 3.9 :
MT : : : : : : : : : : : :
NL 1.0 0.4 0.1 0.8 0.2 0.4 2.2 2.2 2.5 2.3 1.5 1.5
AT 2.2 0.6 0.8 0.4 0.2 -0.1 5.3 5.3 5.6 4.0 2.1 1.3
PL 1.2 1.4 0.9 0.5 0.5 0.4 2.1 3.4 4.1 4.0 3.3 2.3
PT 2.5 0.3 0.2 0.1 0.8 0.7 4.0 4.6 4.7 3.1 1.4 1.9
SI 6.0 2.0 1.5 1.0 1.2 0.7 10.9 11.8 11.8 10.8 5.9 4.6
SK 2.0 2.0 0.9 1.3 0.8 0.9 6.7 7.4 7.5 6.4 5.1 4.0
FI 1.4 1.0 0.6 0.9 1.5 0.4 2.0 2.7 3.6 4.1 4.1 3.5
SE 1.9 0.9 0.4 1.4 1.1 0.7 4.1 4.4 4.3 4.7 3.9 3.6
UK 2.2 1.4 2.0 1.0 0.5 0.6 16.7 9.4 7.3 6.7 4.9 4.1
BG : : : : : : : : : : : :
RO 2.4 4.2 2.0 6.8 1.6 1.9 19.0 18.9 18.3 16.2 15.3 12.8
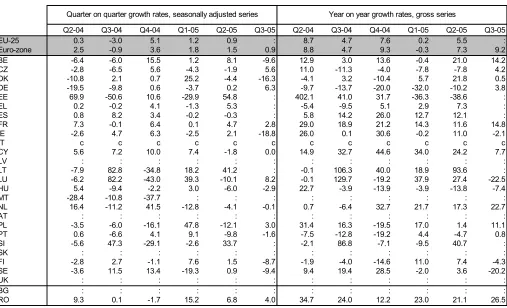
Quarter on quarter growth rates, gross series Year on year growth rates, gross series
Q2-04 Q3-04 Q4-04 Q1-05 Q2-05 Q3-05 Q2-04 Q3-04 Q4-04 Q1-05 Q2-05 Q3-05
EU-25 0.3 -3.0 5.1 1.2 0.9 : 8.7 4.7 7.6 0.2 5.5 :
Euro-zone 2.5 -0.9 3.6 1.8 1.5 0.9 8.8 4.7 9.3 -0.3 7.3 9.2
BE -6.4 -6.0 15.5 1.2 8.1 -9.6 12.9 3.0 13.6 -0.4 21.0 14.2
CZ -2.8 -6.5 5.6 -4.3 -1.9 5.6 11.0 -11.3 -4.0 -7.8 -7.8 4.2
DK -10.8 2.1 0.7 25.2 -4.4 -16.3 -4.1 3.2 -10.4 5.7 21.8 0.5
DE -19.5 -9.8 0.6 -3.7 0.2 6.3 -9.7 -13.7 -20.0 -32.0 -10.2 3.8
EE 69.9 -50.6 10.6 -29.9 54.8 : 402.1 41.0 31.7 -36.3 -38.6 :
EL 0.2 -0.2 4.1 -1.3 5.3 : -5.4 -9.5 5.1 2.9 7.3 :
ES 0.8 8.2 3.4 -0.2 -0.3 : 5.8 14.2 26.0 12.7 12.1 :
FR 7.3 -0.1 6.4 0.1 4.7 2.8 29.0 18.9 21.2 14.3 11.6 14.8
IE -2.6 4.7 6.3 -2.5 2.1 -18.8 26.0 0.1 30.6 -0.2 11.0 -2.1
IT c c c c c c c c c c c c
CY 5.6 7.2 10.0 7.4 -1.8 0.0 14.9 32.7 44.6 34.0 24.2 7.7
LV : : : : : : : : : : : :
LT -7.9 82.8 -34.8 18.2 41.2 : -0.1 106.3 40.0 18.9 93.6 :
LU -6.2 82.2 -43.0 39.3 -10.1 8.2 -0.1 129.7 -19.2 37.9 27.4 -22.5
HU 5.4 -9.4 -2.2 3.0 -6.0 -2.9 22.7 -3.9 -13.9 -3.9 -13.8 -7.4
MT -28.4 -10.8 -37.7 : : : : : : : : :
NL 16.4 -11.2 41.5 -12.8 -4.1 -0.1 0.7 -6.4 32.7 21.7 17.3 22.7
AT : : : : : : : : : : : :
PL -3.5 -6.0 -16.1 47.8 -12.1 3.0 31.4 16.3 -19.5 17.0 1.4 11.1
PT 0.6 -6.6 4.1 9.1 -9.8 -1.6 -7.5 -12.8 -19.2 4.4 -4.7 0.8
SI -5.6 47.3 -29.1 -2.6 33.7 : -2.1 86.8 -7.1 -9.5 40.7 :
SK : : : : : : : : : : : :
FI -2.8 2.7 -1.1 7.6 1.5 -8.7 -1.9 -4.0 -14.6 11.0 7.4 -4.3
SE -3.6 11.5 13.4 -19.3 0.9 -9.4 9.4 19.4 28.5 -2.0 3.6 -20.2
UK : : : : : : : : : : : :
BG : : : : : : : : : : : :
RO 9.3 0.1 -1.7 15.2 6.8 4.0 34.7 24.0 12.2 23.0 21.1 26.5
[image:6.595.48.555.446.754.2]Definitions
Production index: shows output volume through the trend in value added at factor costs at constant prices.
Building and civil engineering: the two main Sections in the classification of types of construction (CC).
New orders: an indication of future production. An order is the value of a contract linking a producer and a third party for the provision of
goods and services. The order is accepted if there is sufficient evidence for a valid agreement.
Employment: number of persons employed is the total number of persons working within and outside the observation unit (including
working proprietors, sales representatives and so on). It also includes persons absent for a short, definite period or persons on strike. Part
time, trainee and seasonal workers are also included.
Hours worked: total number of hours worked, excluding hours paid but not actually worked such as for meals, holidays and sick leave.
Wages and salaries: total remuneration, in cash or in kind, payable to all persons counted on the payroll, in return for work done during the
reference period. Includes taxes and social contributions paid by the employee.
Construction costs: measure the evolution of the costs of the factors employed in the activity of construction and incurred by the
contractor. These factors include, amongst others, materials, wages and salaries, plant and equipment hire; output prices: show the
evolution of prices paid by the client to the contractor.
Building permits: show the future development of construction activity. A building permit is an authorisation to start work on a building
project.
For more information please consult the STS methodology manual at the following web address (note that this is a PDF):
http://forum.europa.eu.int/irc/dsis/bmethods/info/data/new/embs/MM_Eurostat%202002-0507%20vo.2.pdf
[image:7.595.45.557.86.379.2]Abbreviation and symbols:
: not
available
c confidential
Table 11: BUILDING PERMITS: SQUARE METRES OF AREA, GROWTH RATES (%); SOURCE: EUROSTAT STS
Q2-04 Q3-04 Q4-04 Q1-05 Q2-05 Q3-05 Q2-04 Q3-04 Q4-04 Q1-05 Q2-05 Q3-05
EU-25 -3.0 3.2 1.3 -2.5 1.2 : 8.4 3.6 6.5 -3.3 6.3 :
Euro-zone -1.6 -0.3 3.5 -2.4 5.2 1.7 6.5 2.5 6.4 -3.2 6.7 8.8
BE -7.5 -8.6 13.9 2.4 13.2 -6.7 11.7 -2.0 7.1 -2.2 19.8 23.1
CZ 5.4 -9.1 18.0 -11.3 -3.6 15.1 23.7 -1.6 20.7 1.2 -10.3 16.4
DK -27.9 -0.4 8.7 10.3 7.9 -8.8 8.0 8.5 1.8 -16.0 25.6 14.8
DE -21.2 -9.9 1.3 -5.6 1.2 7.4 -9.9 -13.8 -22.4 -34.4 -11.0 4.5
EE 33.5 -42.0 -2.5 -14.4 25.4 : 296.2 26.1 11.6 -36.6 -37.2 :
EL 1.3 -3.5 4.7 2.1 1.7 : -4.5 -15.9 6.6 3.8 3.8 :
ES 3.8 7.2 3.6 -0.4 0.4 : 4.1 11.0 23.6 12.0 11.7 :
FR 5.0 0.2 4.4 1.2 3.6 2.0 22.9 14.6 13.4 10.9 10.3 11.9
IE -0.6 -8.0 13.7 0.5 7.0 -16.9 33.3 12.0 26.3 4.5 12.6 1.5
IT c c c c c c c c c c c c
CY 8.9 -2.7 9.5 8.5 -4.4 2.4 15.3 17.4 26.4 26.1 10.7 10.6
LV 1.9 13.0 10.0 -6.2 15.5 15.6 98.7 60.7 34.6 15.7 32.8 37.1
LT 6.0 27.5 -0.3 6.5 32.9 : 7.9 68.0 43.7 27.8 70.8 :
LU 11.3 70.9 -42.5 48.0 -17.0 2.6 10.5 132.2 -12.6 62.1 20.1 -27.6 HU -1.8 -5.5 -2.9 -1.8 -6.7 -2.5 3.3 -3.6 -12.0 -12.0 -15.6 -12.8
MT : : : : : : : : : : : :
NL 16.5 -7.6 33.0 -13.3 -1.1 -1.7 -0.9 1.2 26.9 14.9 17.1 18.2
AT : : : : : : : : : : : :
PL -8.6 -9.5 -15.8 48.1 -3.2 12.2 20.9 4.7 -23.4 4.2 4.8 31.0
PT -0.4 -6.3 6.3 8.7 -9.4 -2.6 -6.2 -11.3 -8.3 5.2 -2.1 2.8
SI -9.8 38.6 -19.6 -8.8 33.3 -12.5 5.4 57.1 -0.1 -12.8 38.3 -15.2
SK : : : : : : : : : : : :
FI -0.9 0.2 3.1 3.3 3.4 -4.9 4.0 -2.1 -8.4 11.0 8.3 1.7
SE -2.5 8.5 9.3 -11.1 0.1 -9.7 1.5 13.1 23.6 0.8 5.2 -17.1
UK : : : : : : : : : : : :
BG : : : : : : : : : : : :
RO 8.7 2.6 -0.8 12.2 13.5 3.7 29.7 21.3 14.2 20.2 31.0 30.8