AN INITIAL EVALUATION OF THE
EFFECTIVENESS OF INTREO
ACTIVATION REFORMS
ELISH KELLY, SEAMUS MCGUINNESS, PAUL REDMOND,
MICHAEL SAVAGE AND JOHN R. WALSH
NUMBER
81
March
201
9
EFFECTIVENESS
OF INTREO ACTIVATION REFORMS
Elish Kelly
Seamus McGuinness
Paul Redmond
Michael Savage
John R. Walsh
March
201
9
RESEARCH SERIES NUMBER 81
Available to download from www.esri.ie
The Economic and Social Research Institute Whitaker Square, Sir John Rogerson’s Quay, Dublin 2
ISBN 978-0-7070-0472-3
DOI https://doi.org/10.26504/RS81
The mission of the Economic and Social Research Institute is to advance evidence-based policymaking that supports economic sustainability and social progress in Ireland. ESRI researchers apply the highest standards of academic excellence to challenges facing policymakers, focusing on 12 areas of critical importance to 21st-century Ireland.
The Institute was founded in 1960 by a group of senior civil servants led by Dr T.K. Whitaker, who identified the need for independent and in-depth research analysis to provide a robust evidence base for policymaking in Ireland.
Since then, the Institute has remained committed to independent research and its work is free of any expressed ideology or political position. The Institute publishes all research reaching the appropriate academic standard, irrespective of its findings or who funds the research.
The quality of its research output is guaranteed by a rigorous peer review process. ESRI researchers are experts in their fields and are committed to producing work that meets the highest academic standards and practices.
The work of the Institute is disseminated widely in books, journal articles and reports. ESRI publications are available to download, free of charge, from its website. Additionally, ESRI staff communicates research findings at regular conferences and seminars.
The ESRI is a company limited by guarantee, answerable to its members and governed by a Council, comprising 14 members who represent a cross-section of ESRI members from academia, civil services, state agencies, businesses and civil society. The Institute receives an annual grant-in-aid from the Department of Public Expenditure and Reform to support the scientific and public interest elements of the Institute’s activities; the grant accounted for an average of 30 per cent of the Institute’s income over the lifetime of the last Research Strategy. The remaining funding comes from research programmes supported by government departments and agencies, public bodies and competitive research programmes.
Elish Kelly is a Senior Research Officer, Seamus McGuinness is a Research Professor, Paul Redmond is a Research Officer and John R. Walsh is a Senior Research Analyst at the Economic and Social Research Institute (ESRI). Michael Savage was a Research Officer at the ESRI when the research was undertaken. Dr Kelly, Professor McGuinness and Dr Redmond also hold adjunct research positions at Trinity College Dublin (TCD), and Professor McGuinness is a research fellow at the Institute of Labor Economics (IZA) in the University of Bonn.
ACKNOWLEDGEMENTS
The research undertaken in this report was funded by the Department of Employment Affairs and Social Protection. We would like to thank the individuals within the Department who provided assistance with queries during the project, including access to data and comments on earlier drafts of the report. In particular, we would like to thank Terry Corcoran, Hugh Cronin, Eric Doyle,1 Saidhbhin
Hardiman, Ciaran Judge, Barry Kennedy and Kasey Treadwell-Shine2 for their active
engagement with the project. We are also grateful to the independent reviewers who provided comments on an earlier draft of the report.
This report has been accepted for publication by the Institute, which does not itself take institutional policy positions. All ESRI Research Series reports are peer reviewed prior to publication. The author(s) are solely responsible for the content and the views expressed.
1 Now affiliated to the Department of the Taoiseach.
Executive Summary ... i
Background ... i
Intreo PES model ... i
Intreo evaluation ... ii
Main findings and policy implications... iii
CHAPTER 1: Introduction ... 1
1.1 Introduction ... 1
1.2 Outline of Intreo evaluation... 2
1.3 Structure of report ... 4
CHAPTER 2: Overview of reforms to Ireland’s public employment services ... 5
2.1 Initial PES model ... 5
2.2 National Employment Action Plans PES model ... 5
2.3 Intreo PES model ... 8
CHAPTER 3: Data and methods ... 15
3.1 Data ... 15
3.2 Methods ... 22
CHAPTER 4: Descriptive statistics ... 26
CHAPTER 5: Econometric results ... 31
5.1 Closed off the Live Register ... 31
5.2 Detailed outcome categories ... 37
CHAPTER 6: Conclusion ... 43
6.1 The evaluation... 43
6.2 Findings ... 43
6.3 Policy implications ... 44
References ... 46
Table 3.1 Social welfare local offices used for Intreo evaluation ... 17
Table 3.2 Geographical distribution of claimants across treatment offices ... 18
Table 3.3 Geographical distribution of claimants across control offices ... 19
Table 3.4 Incomplete PEX data ... 20
Table 3.5 Duration of event (calendar days) ... 21
Table 3.6 Outcomes six months after start of claim ... 22
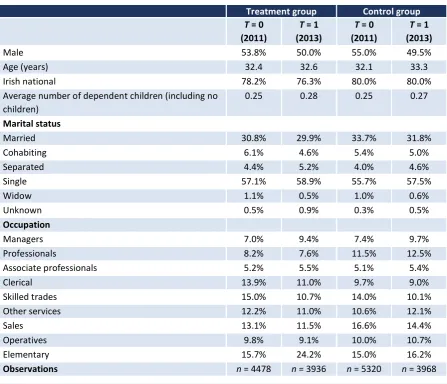
Table 4.1 Personal characteristics ... 27
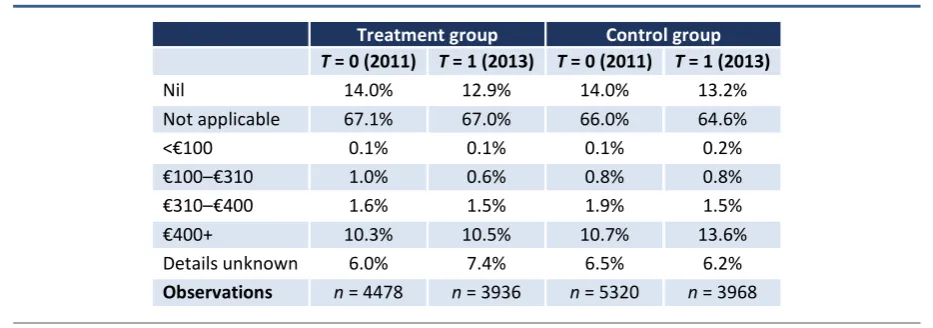
Table 4.2 Earnings of spouse ... 28
Table 4.3 Claimants’ employment history prior to becoming unemployed ... 28
Table 4.4 Percentages in employment: 3, 6, 9 and 12 months after first claim ... 29
Table 4.5 Percentages in education or training: 3, 6, 9 and 12 months after first claim ... 29
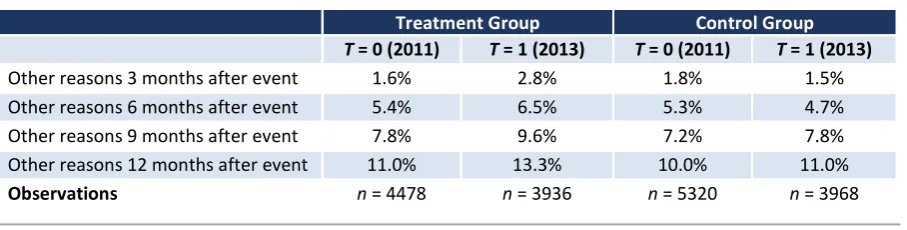
Table 4.6 Percentages in other outcomes: 3, 6, 9 and 12 months after first claim ... 30
Table 5.1 PSM–DiD results for probability of exiting the Live Register ... 33
Table 5.2 DiD coefficients from PSM–DiD analysis of probability of exiting the Live Register ... 36
Table 5.3 PSM–DiD analysis of probability of being in employment ... 38
Table 5.4 PSM–DiD analysis of probability of being in education, training or employment placement course ... 39
Table 5.5 PSM–DiD analysis of probability of being in the ‘other’ outcome category ... 40
Table 5.6 Distribution of outcomes within the ‘other’ outcome category ... 41
Table 5.7 PSM–DiD analysis of number of episodes ... 42
Table A1 Differences in personal characteristics among treatment and control groups ... 48
Table A2 Differences in personal characteristics within treatment and control groups over time 49 Table A3 Weighted and unweighted descriptive statistics ... 50
Table A4 Individuals with a Live Register history of less than 50 days’ duration: DiD coefficients from PSM–DiD analysis of probability of exiting the Live Register ... 51
Table A5 Individuals with a Live Register history of less than 50 days’ duration: PSM–DiD analysis of probability of being in employment ... 52
Table A6 Individuals with a Live Register history of less than 50 days’ duration: PSM–DiD analysis of probability of being in education, training or employment placement course ... 53
Table A7 Individuals with a Live Register history of less than 50 days’ duration: PSM–DiD analysis of probability of being in ‘Other’ outcome category ... 54
Table A8 DiD coefficients from PSM–DiD analysis of probability of exiting the Live Register (full sample) ... 55
Table A9 PSM–DiD analysis of probability of being in employment (full sample) ... 55
LIST OF FIGURES
ALMP Active Labour Market Programme AR Activation Review
BTEA Back to Education Allowance BTWS Back to Work Scheme CE Community Employment CWS Community Welfare Service
DEASP Department of Employment Affairs and Social Protection DSP Department of Social Protection
DiD Difference-in-Differences ES Employment Services ESO Employment Services Officer
ESRI Economic and Social Research Institute GIS Group Information Session
GSW Genuinely Seeking Work HSE Health Service Executive JA Jobseeker’s Allowance JB Jobseeker’s Benefit
JLD Jobseeker Longitudinal Dataset JSA Job Search Assistance
LCWO Local Community Welfare Officer NEAP National Employment Action Plan
NEES National Employment and Entitlement Service OLS Ordinary Least Squares
PES Public Employment Services PEX Probability of Exit
PPP Personal Progression Plan PSM Propensity Score Matching PtW Pathways to Work
RMC Record of Mutual Commitments SWA Supplementary Welfare Allowance SWLO Social Welfare Local Office
EXECUTIVE SUMMARY
BACKGROUND
Ireland’s public employment services (PES) have been undergoing restructuring since the mid-1990s. The country’s initial PES model was predominantly focused on passive social welfare support with no, or relatively little, consideration given to either activation measures or employment services to assist jobseekers to enter/re-enter the labour market. Consequently, the objective of the reforms that have been introduced has been to move PES to a model underpinned by proactive activation as opposed to predominantly passive income supports.
The first set of PES reforms were implemented in 1997. Known as the National Employment Action Plans (NEAPs), these reforms focused on targeting certain groups of jobseekers and provision of employment services. Although the changes that were introduced were progressive, research conducted on their effectiveness found that the NEAP PES system was still too focused on passive income support. In addition, it was not successful in the delivery of efficient and effective services to jobseekers (e.g. Grubb et al., 2009; McGuinness et al., 2011).
Given the issues identified with the NEAP PES model, the government further reformed PES in 2011. The new PES model that was introduced was initially known as the National Employment and Entitlement Service (NEES), but it was subsequently renamed Intreoin October 2012. These most recent set of reforms have focused on changing how services are delivered to jobseekers. However, there have been no substantial changes to what employment services are delivered (i.e. Active Labour Market Programmes (ALMPs)).
INTREO PES MODEL
One of the key restructurings under the Intreo reforms has been the integration of the provision of benefit and employment services into one-stop-shop Intreo centres. Prior to this restructuring, jobseekers had to interact with three separate departments/agencies to access benefit and employment services (the Department of Employment Affairs and Social Protection (DEASP), Community Welfare Service (CWS) and FÁS).
benefit claim) as opposed to the jobseeker having to be unemployed for a certain period of time (three months) before being engaged with for the provision of employment services.
Prior to Intreo, the monitoring of jobseekers and the imposition of sanctions for failure to engage with PES were components of the NEAP model. However, neither was fully implemented (see Grubb et al., 2009; McGuinness et al., 2011). Now under Intreo, if a jobseeker fails to engage with PES he/she will be sanctioned. Their job search activity is monitored as well through regular compulsory engagement with an Intreo case officer. The frequency of this engagement is determined by the claimant’s age and their risk of becoming long-term unemployed (i.e. their Probability of Exit (PEX) score – see Chapter 2): a new IT system introduced under Intreo uses these two pieces of information to independently determine the engagement pattern between the claimant and the DEASP.
In general, the ALMP and advice offered under Intreo are similar to what was provided under the NEAP system. Intreo, however, operates a work-first policy – jobs first for those that are ready to enter/re-enter the labour market and education and training programmes for claimants who are not. To support this policy, there is now more regular engagement between the Department and local employers in order to encourage them to hire more individuals from the Live Register.
In summary, the new Intreo PES model consists of three main phases: (i) reception of jobseekers (i.e. activation activities on the day that a jobseeker presents at an Intreo centre to make a claim), (ii) integrated decision-making (e.g. decision on claim, calculation of PEX score), and (iii) active case management (e.g. one-to-one meeting with case officer, development of personal progression plan).
INTREO EVALUATION
The goal in implementing the Intreo PES process reforms has been to deliver more streamlined, efficient, effective and targeted PES that respond to jobseekers’ needs. This report presents results from an initial evaluation of the effectiveness of the Intreo reforms in meeting this objective. Specifically, the evaluation identifies how the Intreo process reforms influenced various progression outcomes of jobseekers: (i) exits off the Live Register, (ii) exits to employment, (iii) exits to an education, training or an employment placement course, and (iv) exits to ‘other’ destinations. The evaluation is based on all new Jobseeker’s Allowance (JA) and Jobseeker’s Benefit (JB) recipients only. While the new approach to activation and engagement of jobseekers consists of three main phases, in this evaluation the various components of Intreo are treated as a single package of reforms.
unemployment claimants who entered a standard social welfare local office (SWLO) that operated under the previous NEAP PES model during the same time periods. Based on international best practice, a difference-in-differences (DiD) methodology combined with propensity score matching (PSM) was the evaluation approach used to assess the effectiveness of the Intreo reforms.
Under the DiD–PSM methodology, the former group of offices that introduced the Intreo reforms are known as the treatment group, while the SWLOs that operated under the old NEAP PES system are the control group. The progression outcomes of these two groups are examined prior to the introduction of the Intreo reforms (April 2011–June 2012) and after the reforms had been implemented (April 2013– June 2014).
MAIN FINDINGS AND POLICY IMPLICATIONS
In assessing the results from this study, it must be borne in mind that the evaluation was conducted at a time point early in the implementation of the new Intreo PES model, specifically one year after the reforms were put into operation. Thus, the evaluation is, at best, an assessment of the short-run effects of the Intreo PES reforms.
In conducting the analysis, we found that one of the cornerstones of the new Intreo PES system, the Probability of Exit (PEX) profiling model, was not properly implemented. The function of this component of the newly designed PES model was to rank jobseekers into low, medium and high PEX categories for activation, engagement and intervention by the DEASP according to an individual’s risk of becoming long-term unemployed. However, when we examined the PEX information in the dataset that was provided by the Department for the evaluation, we found that 20 per cent of individuals in Intreo offices in 2013 did not have a PEX value.
In addition, of the individuals that received a PEX score, each had missing data for some of the profiling questions used to calculate the PEX value. This means that, if properly implemented, these claimants’ scores were not usable for activation purposes and, therefore, should not have been used to segment individuals into different categories for engagement and intervention by the DEASP. Based on information provided by the Department, individuals with incomplete information should have been given a PEX value of zero. However, when we examined the data we found that this was not the case. These findings in relation to the PEX profiling model point to a potential process failure within the new Intreo PES system.
new Intreo PES model) against. Specifically, a key assumption of the DID evaluation framework is that, in the absence of the Intreo reforms, the treatment offices would display the same progression outcome trends as the control offices. However, a placebo analysis showed that this was not the case in the years prior to the introduction of the Intreo reforms.
On further investigation, the research suggests that differences in the geographic locations of the treatment and control offices are the reason why each group of offices displayed different progression outcomes in the years prior to the introduction of the Intreo forms. Specifically, four of the seven treatment offices were located in Dublin, with a fifth located in a neighbouring county (Bray, Co. Wicklow), while the control offices were mainly located along the western seaboard: two of the control offices were located in Cork, and one in each of Galway, Mayo, Donegal and Tipperary. There was only one control office in Dublin.
In an attempt to overcome this issue, we focused our analysis on treatment and control offices that were geographically close to each other. When we did this we found that, for the geographical sub-models that passed the placebo tests, there was weak evidence that the Intreo activation process reforms increased the probability of jobseekers exiting the Live Register at six, nine and 12 months following their initial claim.
For the geographical sub-model consisting of the Buncrana, Letterkenny, Sligo and Westport offices, there was weak evidence of an employment effect at six and nine months. However, the Intreo reforms were found to have no effect on the likelihood of a claimant entering an education, training or employment placement course. Given that the Intreo reforms focused on how PES were to be delivered (i.e. the processes) as opposed to what was delivered (i.e. ALMPs), it should not be too surprising that we found very small employment effects from the reforms and no education, training or employment placement course impact.
CHAPTER 1
Introduction
1.1 INTRODUCTION
This report presents results from an initial evaluation that the Economic and Social Research Institute (ESRI) has undertaken of the effectiveness of the most recent set of activation reforms that have been made to Ireland’s public employment services (PES). The modifications, which are known as the Intreo activation process reforms, were first introduced in 2012 for all newly unemployed Jobseeker’s Allowance (JA) and Jobseeker’s Benefit (JB) recipients only. The reforms have focused on making changes to how benefit and employment services are delivered to jobseekers as opposed to what types of employment services are delivered (i.e., job search assistance, training, education courses, etc.).
One of the key restructurings that has been introduced into Ireland’s PES has been the integration of the provision of benefit and employment services into ‘one-stop-shop’ Intreo centres.3 Prior to this modification, jobseekers interacted with three
separate organisations to access benefit and employment services:
1. the Department of Employment Affairs and Social Protection (DEASP),4 which
managed the unemployment assistance payments and provided limited employment advisory services through its Jobs Facilitators;
2. The Community Welfare Service (CWS) of the Health Service Executive (HSE), which was responsible for the provision of temporary income support and Supplementary Welfare Allowance (SWA) payments while the main claim was being processed by the DEASP; and
3. FÁS, formerly Ireland’s national training and employment authority, which provided training, work placements, apprenticeships and employment information services (i.e. Active Labour Market Programmes (ALMPs)) to jobseekers.
The introduction of the Intreo reforms, along with the other process changes that have been made to Ireland’s PES, have been implemented with the intention of delivering more streamlined, efficient, effective and targeted PES that respond to the needs of jobseekers.
3 Although the Department with responsibility for those who are unemployed has been renamed, as of 1 September
2017, from the Department of Social Protection to the Department of Employment Affairs and Social Protection, it is not proposed to make any changes to the name of Intreo offices at present.
4 Known as the Department of Social Protection (DSP) until 1 September 2017. For further information on the new
While labour activation reforms usually target specific services, Borghi and Van Berkel (2007) highlight a growing focus on operational reforms designed to improve administrative efficiency. As part of this process, the ‘one-stop-shop’ has emerged as a policy response to the problem of fragmented social security systems in Western Europe (Minas, 2014), as well as reflecting new ways of thinking about the provision of public services (Van Berkel, 2010). The United Kingdom (UK) was one of the first to introduce a ‘one-stop-shop’ for delivering benefit and employment services to its jobseekers: it did so in 2002 (Jobcentre Plus). Germany followed suit in 2004 (Bundesagentur für Arbeit) and France in 2009 (Pôle emploi) (Department of Public Expenditure and Reform, 2017).
While the adoption of such policies and their potential benefits and drawbacks are discussed in the literature, there is a lack of evidence on the effectiveness of these types of process reforms, such as the implementation of ‘one-stop-shops’, on labour market outcomes of unemployed people. In this report, we will help to fill this gap in the literature by evaluating whether the PES process reforms that have been introduced in Ireland (i.e. the Intreo reforms) have impacted the employment outcomes of jobseekers.
1.2 OUTLINE OF INTREO EVALUATION
The primary purpose of the evaluation conducted in this report is to identify how effective the Intreo activation process reforms, which are discussed in more detail in Chapter 2, have been in improving the likelihood of jobseekers exiting unemployment and, in particular, in exiting to employment. This new approach to activation and engagement of jobseekers consists of three main phases: (i) reception of jobseekers, (ii) integrated decision-making, and (iii) active case management. In this evaluation, the various components of Intreo are treated as a single package of reforms.5
Given the importance of PES in assisting the unemployed to reintegrate into the labour market, it is critical that any evaluation is carried out to the highest international standards. A difference-in-differences (DiD) methodology combined with propensity score matching (PSM) is the evaluation approach that is adopted in this study, selection of which was based on international best practice in the undertaking of such evaluations. The evaluation exploits variations in the roll-out of Intreo reforms over time in order to identify appropriate control and treatment offices. The PSM–DID methodology has been used in a large number of studies to evaluate the effectiveness of various labour activation programmes including, for example, job search assistance (Blundell et al., 2004; Centeno et al., 2009), general and specific skills training programmes (Stenberg and Westerlund, 2015), higher
caseworker-to-client ratio (Hainmueller et al., 2011) and vocational training (Reis, 2015).
In this evaluation, we examine the extent to which the introduction of the Intreo PES activation process reforms has influenced various progression outcomes for jobseekers: (i) exits off the Live Register, (ii) exits to employment, (iii) exits to an education, training or an employment placement course, and (iv) exits to ‘other’ destinations. The evaluation is based on all new JA and JB recipients only. This is because when the Intreo processes were introduced in 2012 they concentrated initially on all newly unemployed JA and JB recipients. In the treatment and control offices examined in this evaluation, existing unemployed jobseekers continued to receive the standard National Employment Action Plan (NEAP) PES approach (see Chapter 2), which they would have commenced on becoming unemployed.
The evaluation compares the outcomes of claimants who entered a new Intreo centre (i.e. one of the social welfare local offices (SWLOs) that were among the first to adopt the Intreo process reforms in 20126) in the first six months of 2011 and
2013 against similar unemployment claimants who entered a standard SWLO that operated under the previous NEAP PES system (i.e. offices that adopted the Intreo process reforms after 1 July 2014) during the same time points. Under the DiD– PSM methodology, the former group of offices are subsequently referred to as the treatment group, while the latter group are referred to as the control group. The progression outcomes of these two groups are examined prior to the introduction of the Intreo PES reforms (April 2011–June 2012) and after the reforms had been implemented (April 2013–June 2014).
One of the initial objectives of this study was to examine the impact of Intreo processes separately for jobseekers with different long-term unemployment risk levels. However, this proved not to be possible when the data received for the evaluation were examined. Specifically, the Live Register Probability of Exit (PEX) score, which ranks jobseekers into low, medium and high PEX categories for engagement and intervention by the DEASP according to an individual’s risk of becoming long-term unemployed, is based on information that is gathered from claimants in the second phase of Intreo. This information is then inserted into an econometric profiling model (see O’Connell et al., 2009), which, as part of the Intreo PES reforms, was rolled out in SWLOs from 2011 onwards. When we examined the PEX information in the dataset that was provided by the DEASP for this evaluation, we found that 20 per cent of individuals in Intreo offices in 2013 did not have a PEX score.7 Furthermore, individuals that received a PEX value all
6 Ballymun (Dublin), Coolock (Dublin), King’s Inn Street (Dublin), Tallaght (Dublin), Bray (Wicklow), Buncrana (Donegal)
and Sligo.
had missing data for some of the profiling questions required to calculate the PEX score, rendering their scores unusable for activation purposes.8 In theory,
individuals with incomplete profiling information should have been given a value of zero, but in examining the data we found that this was not the case. Given that the introduction of the PEX profiling model was designed to be one of the cornerstones of the newly designed approach to activation, the apparent failure to properly implement the system points to a potential process failure within the Intreo PES system.
The data provided by the Department for the evaluation were also not rich enough to support additional analyses of those who progressed into employment; specifically, in terms of examining the duration of such individuals’ next employment spell, the earnings associated with their new job and the specific occupation that the individuals entered. When we examined the data, we found that approximately 40 per cent of those who exited to employment had a zero value for their subsequent employment counts/duration. Consequently, aspects of job quality could not be considered as part of the evaluation.
1.3 STRUCTURE OF REPORT
The remainder of the report is structured as follows. Chapter 2 outlines the main reforms that have been made to Ireland’s PES. Chapter 3 provides a detailed description of the data used to evaluate the Intreo process reforms, along with the methodologies employed. Some descriptive statistics are presented and discussed in Chapter 4, while the econometric evaluation results are set out in Chapter 5. Finally, Chapter 6 provides a summary of the report, and also outlines the main conclusions that can be drawn from the evaluation.
8 Individuals providing partial information cannot be compared directly with claimants providing full information, as
CHAPTER 2
Overview of reforms to Ireland’s public employment services
Ireland’s PES have been undergoing restructuring since the mid-1990s. The intention of the changes that have been implemented has been to move PES to a model underpinned by proactive activation as opposed to predominantly passive social welfare supports.
2.1 INITIAL PES MODEL
Under the original PES model that operated in Ireland, which was in place until the introduction of the NEAP model in 1997, a jobseeker commenced their interaction with PES on the day that he/she entered their Social Welfare Local Office (SWLO; these offices are under the remit of the DEASP) to make a benefit claim. If the jobseeker had all the relevant information required to process their claim, he/she was fast-tracked to the Fresh Claims section. If not, then an appointment would be set up with the Fresh Claims section for a later date. Once claims were submitted, the Decisions section within the SWLO determined whether the claim would be awarded.
If a jobseeker required financial support while their claim was being processed, he/she was referred to the Community Welfare Service (CWS) of the Health Service Executive (HSE), who provided temporary income assistance. In this situation, the Local Community Welfare Officer (LCWO) immediately assessed the jobseeker’s request and, if eligible, he/she would receive a weekly SWA payment until their unemployment benefit claim was decided.
Jobseekers were notified by mail if their claim was awarded, and were recorded as being unemployed as of the date they made their original claim. Once payment of their appropriate jobseeker payment had commenced,9 the claimant was entitled
to a back-payment to the date of their original benefit claim.10
As can be ascertained from this description, Ireland’s original PES model was entirely focused on passive social welfare support, with relatively little attention given to employment services to support jobseekers to enter/re-enter the labour market.
2.2 NATIONAL EMPLOYMENT ACTION PLANS PES MODEL
The National Employment Action Plans (NEAPs), which covered the period 1997 to 2011, were the first set of activation reforms that were undertaken to Ireland’s
9 Jobseeker’s Allowance (means-tested payment) or Jobseeker’s Benefit (based on insurance contributions).
PES. The amendments that were introduced focused on targeting certain categories of jobseekers and provision of employment services.
The NEAPs initially concentrated on those under the age of 25 that had been on the Live Register for six months, and were gradually extended to target all new entrants onto the Live Register during the 2000s. The Live Register threshold for intervention was reduced over time as well: from November 2006 onwards, individuals were pursued for employment assistance once they had been on the Live Register for three months.
Under the NEAP PES model, the DEASP identified all individuals aged 18–65 who had reached three months on the Live Register and referred them for a one-to-one counselling interview with a FÁS Employment Services Officer (ESO). During this interview, the ESO provided the jobseeker with guidance and job search assistance, along with possible referral to a job or access to a training, education or public-sector job creation scheme placement. After this interview, the jobseeker was required to adhere to the personal progression plan (PPP) drawn up with the ESO. However, follow-up engagement with Active Labour Market Programmes (ALMPs) was voluntary; thus, not all jobseekers followed their plan. For claimants who continued to engage with FÁS’s employment services, the ESO and the jobseeker agreed an interview schedule to monitor the jobseeker’s progress in the steps they had agreed the jobseeker would undertake to assist him/her to enter/re-enter the labour market. This engagement could include job search monitoring, but it was not formalised.
Attendance at the FÁS one-to-one interview was quasi-compulsory; thus, not all individuals referred by the DEASP to FÁS for employment assistance attended their interview.11 Jobseekers who did not attend, or who subsequently declined offers
of training or other employment service assistance, were referred back to their SWLO for a DEASP Deciding Officer to determine if the jobseeker continued to satisfy conditions for receipt of their unemployment payment.12 If the SWLO
Deciding Officer found that the claimant had valid reasons for not availing of the employment services that were being offered to him/her, the jobseeker continued to receive their benefit payment. In these situations, the DEASP Job Facilitators assisted jobseekers to identify barriers to participation and explored other labour market entry routes for the claimant. If the jobseeker’s reasons for not attending the FÁS one-to-one interview were not deemed to be valid, then the jobseeker could be sanctioned. However, in practice this was not consistently applied.
11 There are various reasons why claimants may not have attended their one-to-one meeting with a FÁS ESO. For
example, some jobseekers were able to access employment or training/education opportunities by their own efforts or by using the self-service facilities available in the FÁS employment service offices. Others had already found work/registered for a training or education course by the time that they received their referral letter. Others still may not have had the confidence to accept the offer of assistance, or were further away from the labour market and had basic literacy/numeracy difficulties or other personal issues (e.g. drug use) that prevented them from availing of the employment services offered to them (DSP, 2012).
12 In Ireland, jobseeker payment recipients are statutorily obliged to be available for and genuinely seeking
The reforms of the NEAP were progressive. In particular, they provided for greater and more systematic engagement with jobseekers through referral to a counselling interview with FÁS employment services. However, research conducted on the effectiveness of the NEAP PES model found that the system was not successful in delivering efficient and effective services to jobseekers, and that it was still too focused on passive income support as opposed to engaging more proactively with unemployed clients (Grubb et al., 2009; McGuinness et al., 2011). In particular, the lack of, or inconsistent use of, activation measures, such as requiring compulsory engagement with employment services, monitoring job-search activities and implementing a robust sanctions regime, was found to be a major flaw with the NEAP PES model.
In addition, several barriers to efficiency were highlighted with this system. Specifically, the NEAP PES model was identified as being quite fragmented due to the number of different departments and agencies involved in delivering benefit and employment services to jobseekers – the DEASP, CWS and FÁS (see Figure 2.1). This fragmentation resulted in different rules and processes being applied to deal with jobseekers’ claims; control systems were fragmented; and assessment and control of claims were investigated separately by the DEASP and CWS, with different conditionality rules applied. Also, there was little data sharing across the organisations allowing for the effective tracking of a jobseeker through their claim period – from awarding of their benefit and their engagement with the various departments/agencies for employment services through to their exit from unemployment.
FIGURE 2.1 NATIONAL EMPLOYMENT ACTION PLAN PUBLIC EMPLOYMENT SERVICES MODEL
Source: DEASP.
2.3 INTREO PES MODEL
In response to the various issues that the research identified with the NEAP PES model, the government established a new PES model, the National Employment
and Entitlement Service (NEES), in 2011. The rapid rise in unemployment that the
2008 global financial crisis, and subsequent Great Recession, gave rise to also contributed to the reforms that were implemented. The Programme of Financial Support agreement that was signed between Ireland and the EU/IMF to address Ireland’s national debt played a role as well. Specifically, under this agreement the Government agreed to reform Ireland’s PES (Department of Public Expenditure and Reform, 2017). This included improving activation measures, increasing incentives to work and strengthening sanctions for non-compliance with the
job-Present at SWLO Appointment made/fast track to fresh claim section
Referral to CWS
Submit claim and documentation Claim processing begins
Present at local CWS office Submit SWA claim Payment commenced
Decision section decides claim Payment commenced Referral to FÁS within 13
weeks
SWLO advises CWS of payment commencement CWS ceases SWA payment
Present at FÁS
Details taken and appointment made
Referral to training/work programme,
etc. payment details to reflect FÁS updates SWLO with training/scheme allowances
FÁS
Employment DEASP SWLO Community HSE
Attend interview Interview schedule and action plan
developed
Review job-search activity at 7, 12 or 15 months
(scheme-dependent) Annually thereafter Referred back to SWLO if jobseeker
did not attend one-to-one interview with FÁS Employment Services
search requirements for unemployment benefits (Department of Public Expenditure and Reform, 2017).
The name of the new PES model (i.e. NEES) was subsequently changed to Intreo in October 2012, which was when national roll-out of the new PES system commenced. The reforms that have been implemented to Ireland’s PES under Intreo focus on how entitlement and employment services are delivered (i.e. the processes used) as opposed to what employment services are delivered (i.e. ALMP).
As mentioned in Chapter 1, one of the main process reforms made to Ireland’s PES under Intreo has been the integration of the management of jobseekers’ payments with employment services: the delivery of unemployment benefits, supplementary welfare and employment and activation services by the DEASP, CWS and FÁS respectively are now together under one roof (see Figure 2.2). These new ‘one-stop-shops’, known as Intreo centres, are the responsibility of one government department, the DEASP. The amalgamation of these three departments/agencies was undertaken in order to facilitate the delivery of more streamlined PES. In addition, it is intended that the merger of the three organisations will reduce the time taken to process a jobseeker’s claim and to lower the need to resort to temporary CWS income payments.
The Intreo PES reforms have also seen the introduction of a new case management system that links unemployment benefit payments to active engagement with jobseekers to support them into employment or training. This new form of engagement is implemented through the principle of mutual obligation, whereby benefit recipients are expected to engage in job search and/or education, training or employment programmes in exchange for receiving benefit payments and efficient employment services.
Under the new Intreo PES model, failure to engage with PES now results in jobseekers being sanctioned, which is a substantial reform of the NEAP regime: although sanctions and monitoring were components of the NEAP PES model, neither was implemented to any extent (see Grubb et al., 2009; McGuinness et al., 2011). Authority to implement reduced rates of pay was signed into law in the Social Welfare (Miscellaneous Provisions) Act 2010, and is applied when a jobseeker declines any type of PES intervention offered to him/her to assist them to enter/re-enter the labour market.13
13 A reduced rate of payment is applied for non-attendance after a jobseeker is warned of the consequences of not
In addition, under the new Intreo PES model jobseekers, specifically newly unemployed JA and JB claimants, are engaged with on the day that they make an unemployment benefit claim as opposed to having to be on the Live Register (i.e. unemployed) for a specified period of three months. Specifically, information is gathered from all new jobseekers on the day that they make their benefit claim, or on a day soon after,14 in order to calculate a score that identifies the jobseeker’s
likelihood of exiting the Live Register within 12 months (see O’Connell et al., 2009). This score, which is known as the Probability of Exit (PEX) score, and was mentioned briefly in Chapter 1, is then used by the DEASP to segment jobseekers into three target groups (low, medium and high PEX) for determining engagement levels. This new tool, which is known as profiling, was introduced to improve the targeting of activation interventions.
Even if a jobseeker’s PEX score is not calculated on the day that he/she makes an unemployment benefit claim, engagement between the DEASP and the jobseeker commences straight away. Specifically, on their first day in an Intreo centre jobseekers receive information on a Group Information Session (GIS)15 that they
have to attend. GISs are usually scheduled three weeks after a claimant’s initial engagement with an Intreo officer. The GIS is a briefing session during which the activation process is explained to the jobseeker. If claimants do not attend the GIS, they are contacted to attend their nearest Intreo centre and receive a verbal warning if they do not have an appropriate explanation for non-attendance. If a claimant fails to attend a GIS for a second time, he/she is given a penalty rate. Approximately 30 people are invited to each GIS, which is undertaken with the intention of achieving a minimum of 20 attendees. On their first day, claimants are also given information about the support that they will receive from the DEASP, their role in the PES activation process and what will happen if they do not actively engage with the DEASP.
14 If an appointment with an Intreo officer cannot be arranged for the same day that the jobseeker makes their initial
benefit claim, which could happen if a jobseeker does not have all the documentation required to proceed with such a meeting, this appointment will be organised for a date soon after the initial claim.
15 GISs were initially trialled in October 2010. They were introduced with the intention of increasing the numbers of
Activation Services
FIGURE 2.2 INTREO PUBLIC EMPLOYMENT SERVICES MODELIntegrated Reception
Info provided /
direction given Ascertain appointment type
Appointments
set up
Client provided with information pack, doc checklist, profile form,
RMC, etc.
Integrated Decisions
Client attends appointment
Client issued Public Services Card
Claim Decision, Profiled and PEX
calculated
Client signs RMC and is informed of
next GIS
DEASP Intreo Centres
Low PEX Medium PEX High PEX
Compulsory attendance at Group Information Session (GIS)
Compulsory 1-2-1 meeting arranged after GIS
Compulsory 1-2-1 meeting arranged after GIS
Compulsory 1-2-1 meeting arranged 6 months after GIS
Followed-up monthly: compulsory attendance
or sanctioned
Followed-up every 2 months: compulsory attendance or sanctioned
Followed-up every 2 months after their 1-2-1 meeting at 6
months: compulsory attendance or sanctioned
Activation commences at the GIS. Specifically, claimants are assigned a case officer and are given an appointment letter for a one-to-one meeting with this person. A new IT system introduced under Intreo, using claimants’ PEX score information, independently determines the engagement pattern between the claimant and the DEASP:16 under the NEAP, the engagement pattern was determined by the ESO.
Claimants with a low PEX score (i.e. low likelihood of exiting the Live Register) are seen monthly, as are claimants aged under 25. Medium PEX score individuals are engaged with every two months. After the GIS, high PEX score individuals are not engaged with again for six months and then these individuals are engaged with every two months.17 This engagement pattern is a ‘minimum’ engagement pattern
as people can walk into an Intreo office and seek assistance at any time: claimants could independently walk in for employment services under the NEAP PES model as well.
Case officers work with their claimants to develop PPPs that outline the steps that will be taken to move the claimants from unemployment to a job. This could include JSA, training, job placement, etc. PPPs were developed under the NEAP PES system too; however, under Intreo the PPPs specify regular compulsory follow-up review meetings, which have sanctions attached if not attended by the claimants. Thus, as indicated previously, under Intreo income support has been made conditional on participation in activation/case management processes.
In general, the ALMP offered under Intreo, and advice, are similar to that provided under the NEAP PES model. Intreo, however, operates a work firstpolicy – jobs first for those that are ready to enter/re-enter the labour market, and education and training for claimants who are not. To support this principle, there is now more systematic engagement with local employers to encourage hiring from the Live Register under the Intreo PES model, which did not operate under the NEAP system. Thus, as well as facilitating a single point of contact for jobseekers, Intreo centres facilitate a single point of contact for local employers. For the most part, ALMP under the NEAP PES model focused on training, education and public-sector job creation scheme referrals.
Under the Intreo PES model, the actual number of claimants assisted, and the time period when they are engaged with, depends on resource availability within each Intreo centre: the same applied under the NEAP PES model.
Under Intreo, activation and engagement end with claimants after 12 months. Again, this is determined centrally by the DEASP’s new IT system, and then implemented by the local Intreo office. At this time point, signing on the Live
16 Intreo centres can determine the quantity of jobseekers that are referred to the case officers within their centre.
However, the selection of jobseekers sent to their case officers is determined independently by the new IT system that the DEASP introduced, which is operated centrally in Carrick-on-Shannon.
17 Some Intreo centres run separate GIS for high PEX individuals, to account for their needs being different to low and
Register is reinstated for low and medium PEX jobseekers and they are required to engage in intensive job search for six months: high PEX claimants are not required to attend their Intreo office for the first six months. If jobseekers continue to be unemployed after this time period, a Genuinely Seeking Work (GSW) meeting is held with their Intreo case officer for their claim to be reassessed. This GSW meeting is a condition for eligibility for a jobseeker’s social welfare payment. In more recent times, the long-term unemployed are referred to JobPath, a relatively new DEASP employment activation programme that is aimed at helping the long-term unemployed, and those furthest from the labour market, back into work. This employment programme is operated by two private providers.18
The process reforms to Ireland’s PES that were introduced under Intreo were developed further under the Government’s Pathways to Work (PtW)strategies. The first of these strategies was launched in 2012, with updates in 2013, 2015 and 2017. The PtWstrategies were designed to complement the Government’s Action
Plan for Jobs strategies, both of which had the aim of addressing the jobs and
unemployment crises that emerged after the Great Recession. The PtW strategies focus specifically on making sure that as many as possible of the new jobs that are being created in the economy, and any vacancies that arise, are being filled by unemployed jobseekers. The most recent PtW strategy, Pathways to Work 2016–
2020 (DEASP, 2017), sets out measures to extend the approach of activation from
unemployed jobseekers only to people with disabilities and lone parents. In general, the PtW strategies set out a range of targets, actions and objectives to enhance Ireland’s PES with the intention of ensuring that the system is efficient and effective in helping jobseekers to transition out of unemployment and into the labour market.
In summary, the Intreo process can be categorised into three main phases: (i) reception of jobseekers, (ii) integrated decision-making, and (iii) active case management.
In phase (i), jobseekers present at an Intreo centre to make a claim. During this time, they register with the Employment Services (ES). They are also provided with a checklist for their appointment, which may take place that day if the jobseeker has all the required documentation, and a copy of the Record of Mutual Commitments (RMC). The RMC outlines the responsibilities of both the DEASP, via the Intreo centres, and the jobseeker. In the RMC, Intreo centres commit to finding suitable employment or training for the jobseeker through a PPP. The jobseeker commits to engage with Intreo services, attend meetings arranged by their case officer and take up activation programmes suggested by Intreo.
In phase (ii), the PEX score, which measures an individual’s likelihood of becoming long-term unemployed, is calculated for the jobseeker and they are given information about the GIS. The jobseeker also signs the RMC.
In phase (iii), the jobseeker will attend the GIS, during which time a one-to-one meeting will be arranged with a Case Officer. During this meeting, the jobseeker agrees a PPP and may be offered a range of activation opportunities.
CHAPTER 3
Data and methods
3.1 DATA
The DEASP provided anonymised data to the ESRI for the purpose of carrying out an initial evaluation of the Intreo activation process reforms. The data, which were extracted from the Department’s Jobseeker Longitudinal Dataset (JLD),19 contain
information on a person’s social welfare claim history, along with their employment, training and activation episodes over time.
Data were provided for 14 social welfare local offices (SWLOs) for the years 2011 and 2013. The specific offices that were selected, along with the years, were necessary for the difference-in-differences (DiD) methodology that we employed to evaluate the Intreo PES reforms. As is discussed in more detail in Section 3.2, this evaluation methodology is based on identifying SWLOs that introduced Intreo activation process reforms in 2012, which will be referred to as the treatment group in this study, and offices that did not introduce the reforms and were therefore still operating under the NEAP PES model, which will be known as the control group, and comparing the Live Register exit outcomes of the two groups of offices at different points in time.
With the DiD methodology, the initial comparison in the outcomes of the treatment and control group SWLOs is based on a year prior to the introduction of the Intreo reforms. Given that the reforms were introduced in 2012, 2011 was selected for this initial outcome examination. In 2011, none of the selected 14 SWLOs had implemented the Intreo reforms. However, by 2013 seven of the 14 offices (our treatment offices) had implemented the reforms while the other seven (our control offices) had not. In order to evaluate the effectiveness of the Intreo process reforms, a second comparison in the Live Register outcomes of the treatment and control offices was undertaken in 2013, a year after the reforms had been implemented in the treatment offices.
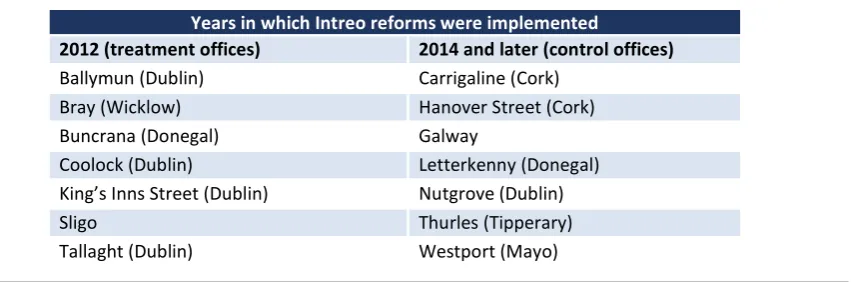
Details of the offices that form our treatment and control groups are shown in Table 3.1. Seven treatment offices were identified as having implemented the reforms in 2012. Selection of these seven offices by the DEASP as the first to implement the Intreo reforms was based on the physical infrastructure of the offices, along with the amount of work needed to convert them into ‘one-stop-shops’ and local human resource availability. Thus, the selection process was not based on these offices being located in geographic areas with the highest level of
need or other such strategic criteria.
We were restricted to the seven control offices that appear in Table 3.1 on the basis that the control group offices, in order to meet the underlying criteria of the DiD methodology, could not have implemented the Intreo reforms prior to the outcome period examined in 2013/2014. Specifically, we did not want spill-over of the treatment (i.e. Intreo reforms) into the control offices. Based on the information provided to us by the DEASP, the control offices listed in Table 3.1 were the only offices that met this implementation criterion, as they did not implement the Intreo reforms until after 1 July 2014.
While all DEASP staff were made aware of the roll-out of Intreo, training to implement the new PES system was not provided to staff in the control offices until the roll-out commenced in their office.20 Thus, there was no potential spill-over of
the treatment in the control offices through this channel. In addition, the DEASP checked and confirmed that no claimant in the data provided for the evaluation had switched from a treatment to a control office. In theory, jobseekers must make their claim and be activated in the welfare office located within their dwelling catchment area, whether that was an Intreo centre or a standard SWLO during the time period covered by this evaluation. However, a jobseeker’s claim may be transferred to a new office in a different geographic location if the claimant changes their dwelling location. In such instances, the jobseeker is assigned to a case officer within the new office for continuation of their activation plan. Nevertheless, in order to ensure that there was no potential contamination from such switches in the evaluation conducted in this report, the Department removed any claimants who had switched office from the data provided for the study.
Another potential concern relates to the possible contamination of the treatment group, i.e. we must ensure that individuals in the treatment offices who made claims in 2011 did not fall under Intreo regimes before 12 months of their claim had elapsed. The DEASP provided information that the Intreo roll-out did not occur in the treatment offices until the second half of 2012. Therefore, to prevent contamination, we restrict our analysis to individuals who started their claim in the first six months of 2011. As such, even observing these individuals 12 months after their claim (up to the end of June 2012), we can be sure that they did not benefit from the Intreo PES reforms.
20 Specifically, a dedicated, and centralised, Intreo roll-out team trained, and worked with, local staff and oversaw the
TABLE 3.1 SOCIAL WELFARE LOCAL OFFICES USED FOR INTREO EVALUATION
Years in which Intreo reforms were implemented
2012 (treatment offices) 2014 and later (control offices)
Ballymun (Dublin) Carrigaline (Cork) Bray (Wicklow) Hanover Street (Cork) Buncrana (Donegal) Galway
Coolock (Dublin) Letterkenny (Donegal) King’s Inns Street (Dublin) Nutgrove (Dublin)
Sligo Thurles (Tipperary)
Tallaght (Dublin) Westport (Mayo)
Source: JLD.
For each claimant, we have data on characteristics including gender, age, marital status, earnings of the spouse, nationality (Irish or non-Irish), number of dependent children and previous occupation, as well as on the number and duration of previous employment and Live Register spells (prior to the individual’s current claim) and pre-Intreo Public Employment Services (PES) training. In our econometric models (Chapter 4), we also include a local unemployment rate measure to control for variations in local labour market conditions between the treatment and control offices.
The dataset provided to us by the DEASP for this evaluation contained information on 62,838 claimants in 2011 and 2013. However, as our analysis focuses on new entrants to Intreo offices, we focused only on individuals with no Live Register history, of which there were 18,189 cases. In addition, there were 487 cases who, although not recorded as having a Live Register history, were listed as having a previous episode in the past month involving either some type of labour market intervention or DEASP payment. Of these claimants, 158 (32 per cent), were recorded as having had an episode with FÁS. One Parent Family Payments and Specific Skills Training accounted for a further 26 per cent and 16 per cent of these cases respectively. The remaining individuals came from a wide variety of episodes including, for example, Community Employment (CE) schemes, Back to Education Allowance (BTEA), Back to Work Scheme (BTWS) and JobBridge. We excluded these 487 cases with an intervention in the previous 30 days, and were therefore left with a sample of 17,702 new Jobseeker’s Allowance (JA) and Jobseeker’s Benefit (JB) claimants. This sample represents our baseline specification. However, we also conducted sensitivity tests to check whether our results are robust to alternative specifications, one of which involved estimating our models using the full sample of 62,838 claimants. When we did this we found that our results remained consistent across various specifications.
on individuals who exited the Live Register for ‘other’ reasons, such as being transferred to another DEASP scheme or no longer being entitled to JA or JB.
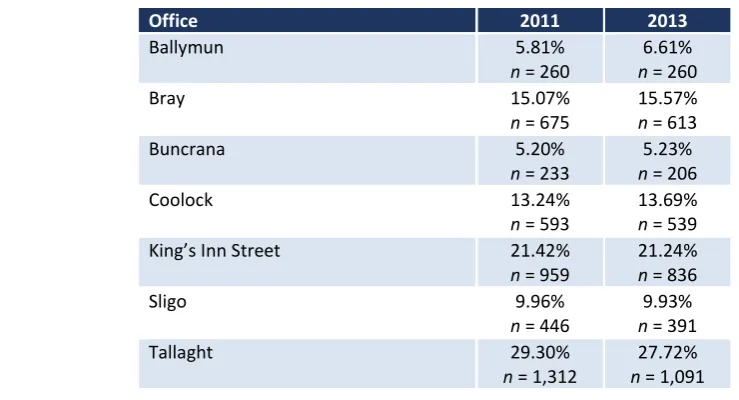
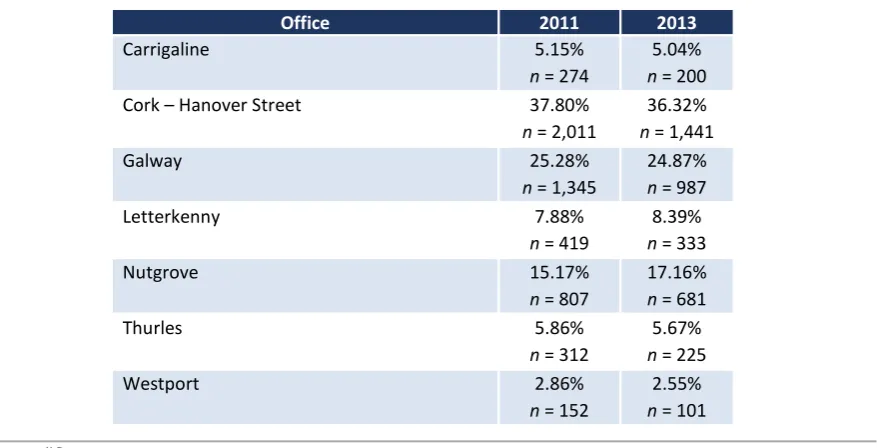
[image:31.595.80.450.272.472.2]Of the 17,702 individuals in our sample, 8,414 (48 per cent) are claimants from a treatment office and 9,288 (52 per cent) are from control offices. Tables 3.2 and Table 3.3 show the distribution of claimants across offices for the years 2011 and 2013. In the treatment offices, the Tallaght and King’s Inns offices combined account for approximately half of the observations. The distribution was relatively stable over the two periods.
TABLE 3.2 GEOGRAPHICAL DISTRIBUTION OF CLAIMANTS ACROSS TREATMENT OFFICES
Office 2011 2013
Ballymun 5.81%
n = 260 n = 260 6.61%
Bray 15.07%
n = 675 15.57% n = 613
Buncrana 5.20%
n = 233 n = 206 5.23%
Coolock 13.24%
n = 593 13.69% n = 539
King’s Inn Street 21.42% n = 959
21.24% n = 836
Sligo 9.96%
n = 446
9.93% n = 391
Tallaght 29.30%
n = 1,312 n = 1,091 27.72%
Source: JLD.
TABLE 3.3 GEOGRAPHICAL DISTRIBUTION OF CLAIMANTS ACROSS CONTROL OFFICES
Office 2011 2013
Carrigaline 5.15%
n = 274
5.04% n = 200 Cork – Hanover Street 37.80%
n = 2,011
36.32% n = 1,441
Galway 25.28%
n = 1,345
24.87% n = 987
Letterkenny 7.88%
n = 419
8.39% n = 333
Nutgrove 15.17%
n = 807
17.16% n = 681
Thurles 5.86%
n = 312
5.67% n = 225
Westport 2.86%
n = 152
2.55% n = 101
Source: JLD.
While the JLD is a very rich data source, these data were due to be augmented for the Intreo evaluation with additional personal characteristic information that the Department gathers on all new social welfare claimants through its profiling system, which, as indicated previously, was rolled out in SWLOs from 2011. This system, which produces the PEX score that the DEASP uses to segment jobseekers into categories for activation engagement (low, medium and high PEX groups), was discussed in detail in Chapter 2.21 The answers to the 30 PEX questions that provide
data for the profiling model relate to a claimant’s educational attainment, labour market history, unemployment benefit history, literacy and numeracy difficulties, health, access to public transport, etc. The data also contain the actual PEX score that is derived for each claimant.
While the PEX information presents a potentially rich source of data, it was not possible, for a number of reasons, to fully utilise these data in our analysis. The main issue, as mentioned in Chapter 1, related to the limited coverage of PEX data. While 90 per cent of individuals in treatment offices in 2013 had a PEX value, the corresponding figure for control offices was 75 per cent.22 In 2011, just 38 per cent
of individuals in treatment offices and 30 per cent of individuals in control offices had a PEX value. This latter finding is due to the fact that roll-out of PEX was not fully implemented in 2011, and its subsequent implementation was mainly concentrated, as one would expect, in Intreo offices. Nonetheless, it appears that 10 per cent of individuals in the treatment offices who should have had PEX scores did not.
21 For further information on the Department’s use of the PEX model, see:
http://www.welfare.ie/en/downloads/pathwaystowork.pdf
In examining the PEX data, we also found an issue relating to the completeness of data for the PEX questions. An individual’s PEX score should be calculated based on their response to 30 PEX questions. We were provided with data from the Department that contained 30 variables that correspond to the 30 PEX questions.
However, no individual with a PEX score had complete data on all 30 questions. This
suggests that individuals had varying minimum and maximum possible PEX scores depending on the questions answered and, as such, the scores could not be directly compared with each other. The extent of the missing data is shown in Table 3.4, which shows the frequency of the number of incomplete questions. For example, 49 per cent of those with a PEX value have missing data relating to eight of the PEX questions.
The identification of these PEX data issues is a concern given that, since 2012, the PEX model, as discussed in Chapter 1, has been a key component in the Department’s toolkit for segmenting jobseekers into different groups (low, medium and high PEX) for activation engagement and intervention: it was also a cornerstone in the Pathways to Work (PtW) strategy that the Department devised to address the unemployment crisis that arose after the Great Recession in 2008.
TABLE 3.4 INCOMPLETE PEX DATA
Incomplete PEX questions (out of 30) %
22 0.01
21 0.01
17 0.01
15 0.01
12 0.01
11 0.03
10 3.11
9 20.76
8 48.74
7 21.06
6 3.12
5 0.27
4 0.51
3 1.49
2 0.79
1 0.09
Total 100
Source: JLD
provided another source of education data, which were collected separately to the PEX questions.23 However, analysis of these other data revealed some issues that
made them unusable. While the coverage of this other education data source was greater than the PEX data, there were still a large number of claimants with missing information. In 2013, no education data were available for approximately 40 per cent of individuals in both the treatment and control groups. The corresponding figures for missing data in the treatment and control groups in 2011 were 30 per cent and 36 per cent respectively.
A more serious issue than the limited data coverage was the systematic differences that were found to exist between the individuals for whom education data were provided and those for whom no education data existed. Table 3.5 compares the duration of the unemployment event (in calendar days) for individuals in the two groups, using the combined 2011 and 2013 data.24 The average duration of a
claimant’s unemployment event is substantially higher for the group with education data than for the group with no education data (360 days compared to 197 days). As such, it appears that the group with education data face significantly greater labour market disadvantage compared to the group without education data. In fact, information provided by the DEASP on the collection of this education data supports this. Specifically, these education data were gathered by the case officers who only engaged with jobseekers when they had been unemployed for more than three months. Given this, individuals with no education data would have had higher exit rates from unemployment to employment. Thus, they would not be as disadvantaged, in terms of ability to access the labour market, as the group with education data who were unemployed for a minimum of three months.
TABLE 3.5 DURATION OF EVENT (CALENDAR DAYS)
Education data available Mean (days) Min (days) Max (days) Observations
No 197 1 1889 6,351
Yes 360 1 1916 11,351
Total 302 1 1916 17,702
Source: JLD.
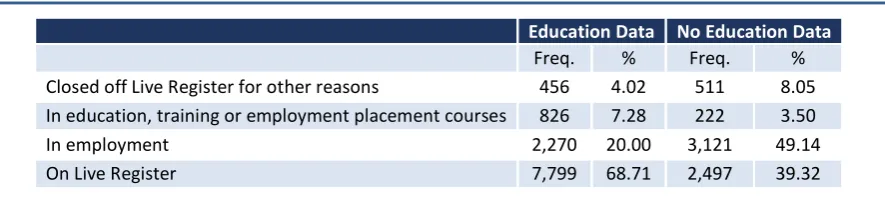
This disadvantage is reinforced when we examine the outcomes of the groups (i.e. those with and without education data). In Table 3.6 we show the outcomes of both groups six months after the date of their initial unemployment claim. While a similar pattern is observed for three, nine and 12 months, for brevity we just show the six-month outcomes. It is clear that the group for which education data exist have much less favourable outcomes than the group without education data. For
example, just 20 per cent of the group with education data are in employment six months after the start of their claim, compared to 49 per cent of the other group.
TABLE 3.6 OUTCOMES SIX MONTHS AFTER START OF CLAIM
Education Data No Education Data
Freq. % Freq. % Closed off Live Register for other reasons 456 4.02 511 8.05 In education, training or employment placement courses 826 7.28 222 3.50
In employment 2,270 20.00 3,121 49.14
On Live Register 7,799 68.71 2,497 39.32
Source: JLD.
In the absence of usable educational attainment information, we use a variable that captures a person’s previous occupation (prior to their current claim). This will act as a proxy for educational attainment as the person’s previous occupation and their education levels will be correlated. For example, those classified as managers and professionals will likely be educated to tertiary level.
3.2 METHODS
In this analysis, the impact of the introduction of the Intreo process reforms is estimated using a difference-in-differences (DiD) approach. We use cross-sectional data from 2011 and 2013. In each year, we observe two groups of individuals – jobseekers from Intreo offices (the treatment group) and jobseekers from non-Intreo offices (the control group). To examine the effect of the reforms on the likelihood of claimants exiting the Live Register to employment, for example, the DiD estimator involves measuring the change in employment probabilities before and after the introduction of the Intreo process reforms, i.e. in 2011 (pre) and 2013 (post), in both the treatment and control groups.
The DiD estimate of the Intreo employment effect is then obtained by subtracting the difference in the outcomes in the treatment group from the difference in the outcomes in the control group. If we observed a large increase in employment probabilities in the treatment group, while at the same time observing no change in the employment probabilities in the control group, then we would get a positive DiD employment estimate which would indicate that the reforms increased a person’s likelihood of finding a job. However, if we observed an increase in the treatment group’s employment probabilities and a similar increase for the control group’s, this would indicate that the Intreo reforms had no employment effect.
groups within the population of jobseekers: those that were claimants in the Intreo SWLOs25 (i.e. the treatment group) and those that were not (i.e. the control group).
We then identify two time periods: one before and one after the introduction of the Intreo processes; in this case, as mentioned in Section 2.1, 2011 and 2013 respectively. When we are examining the impact of Intreo reforms on the probability to exit the Live Register to employment, for example, we can define the DiD estimator by letting:
q0,T = the percentage of jobseekers in the treatment offices that exited to
employment in 2011 (i.e. pre-Intreo);
q1,T = the percentage of jobseekers in the treatment offices that exited to
employment in 2013 (i.e. after the introduction of Intreo);
q0,C = the percentage of jobseekers in the control offices that exited to
employment in 2011 (i.e. pre-Intreo);
q1,C = the percentage of jobseekers in the control offices that exited to
employment in 2013 (i.e. after the introduction of Intreo).
Using the DiD methodology, we compare the difference between the change in rates of exit to employment in each group before and after the introduction of the Intreo reforms. For the treatment group, the total difference in exit to employment rates before and after the introduction of the Intreo approach is q1,T − q0,T. For the
non-Intreo control group, the total difference is q1,C − q0,C. The DiD equation is
therefore expressed as:
DiD = (q1,T − q0,T) – (q1,C − q0,C) (1)
By making some reasonable assumptions, we should be able to predict the sign of this equation. If the introduction of the Intreo reforms increased the probability of claimants exiting from the Live Register to employment, then (q1,T − q0,T) will be
positive. The introduction of Intreo should have no impact on the outcomes of the control groups, so that, all else being equal, (q1,C − q0,C) should be zero. Crucially,
there should be no factor other than Intreo that affects the probability of exit of one group more than it affects the other. Therefore, if the Intreo process reforms increased the probability of exit to employment, the