Allocation System Using Market-Based Agents
Nadim Haque ([email protected]),
Nicholas R. Jennings ([email protected]), Luc Moreau ([email protected])
School of Electronics and Computer Science, University of Southampton, Southampton SO17 1BJ, UK.
Submission: Nov 1, 2005 First Revision: Apr 12, 2006 Second Revision: May 15, 2006 Accepted: May 25, 2006
Abstract. In this paper, we consider issues associated with scalability and robustness in designing a market-based multi-agent system that allocates bandwidth in a com-munications network. Specifically, an empirical evaluation is carried out to assess the system performance under a variety of design configurations in order to provide an insight into network deployment issues. This extends our previous work in which we developed an application that makes use of market-based software agents that compete in decentralised marketplaces to buy and sell bandwidth resources in a network that is partitioned into regions, each with a separate market server. We investigate the average call success rate and average message load per market server, as the number of markets are scaled up in a fixed size network. The same investigations are performed in the presence of single market failures. Finally, for both the failure and non-failure cases, a trade-off is found between their average call success rates and message load per server in order to find an optimum number of regions to deploy in the network.
Resource allocation is a crucial problem in effectively managing networks. Specifically, this covers the process by which network elements try to meet the competing demands that applications have for network resources — primarily link bandwidth and buffer space in routers or switches (Peterson and Davie, 2003). This is a challenging problem since resources become scarce when there is a high demand for them. Specifically, in this work, we consider a circuit switched meshed network where nodes communicate with their immediate neighbours using radio links (Nicopolitidis et al., 2003). In this system, the nodes are designed to consume as little power as possible, to be as robust as possible and are targeted for rapid and cost-efficient deployment in poor countries. However, such low power consumption implies that there is limited bandwidth available in the network. To cope with this, we have developed a multi-agent system that allocates end-to-end (source-to-destination) bandwidth in such communi-cations networks to set up calls. More specifically, based on our previous solution (Haque, Jennings and Moreau, 2005a), in which we deployed a market-based approach, in this paper we consider a network that is partitioned into a number of non-overlapping regions, each with its own market server, from where resources are allocated. Using regions and decentralised markets in this way means that there is no central point of failure from where all resources are allocated. In this context, we focus on the impact that varying region size and, hence, the number of markets has on the network and on how robust the system is in the face of failures in the network. By investigating these issues, we provide a network designer with an insight into how such a network can be deployed in practice.
man-agement (Keller, Duguay and Precup, 2004), scheduling (Wellman et al., 2003), congestion control (Heikkinen, 2002), routing (Goemans et al., 2004), workflow automation (Hulaas, Stormer and Schnhoff, 2001) and recommender systems (Wei, Moreau and Jennings, 2005). Building on this, the solution that we have developed consists of software agents that compete in a marketplace to buy and sell network bandwidth. Here, buyer agents represent callers and seller agents represent the owners of the re-sources. We decided to base our solution on agents for a number of reasons. First, their autonomous behaviour allows them to carry out their tasks in the decentralised control regime of distributed marketplaces. Second, the reactive nature of agents is needed to respond to requests quickly so that calls within the network can be made with minimum delay. Third, agents have the ability to flexibly interact which is important in our system because the agents need to bid against a variety of different opponents in an environment where the available resources vary dynamically. More specifically, a market-based approach was chosen for the following reasons. First, markets are effective mechanisms for allocating scarce resources in a decentralised fashion (Clearwater, 1996). Second, they achieve this based on the exchange of small amounts of information (such as prices). Finally, they provide a natural way of viewing the resource allocation problem because, generally speaking, they ensure the individual that values the resources the most will obtain them.
performing scalability and robustness tests, with respect to increasing the number of regions in a fixed size network.
The remainder of this paper is structured as follows: the marketplace design and components are briefly recapped in section 1. Section 2 pro-vides the system formalisation where the functionality is described. The system evaluation and experimental results are presented in section 3. Section 4 describes related work and, finally, section 5 concludes.
1. Marketplace Design
This section describes the design of the system. Specifically, the basic components and network model are outlined in section 1.1. Section 1.2 describes the constituent agents and, finally, section 1.3 provides a brief description of how resources are acquired in a multi-region call.
1.1. Network Model
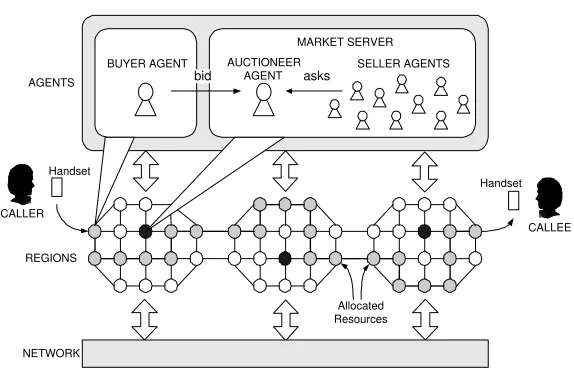
The system consists of three types of agents: seller, buyer and auctioneer (see figure 1). Seller agents are responsible for selling node bandwidth capacity resources and buyer agents are responsible for buying these re-sources. The auctioneer agent accepts asks from seller agents and bids
NETWORK REGIONS AGENTS
MARKET SERVER AUCTIONEER
AGENT SELLER AGENTS
BUYER AGENT
CALLER
CALLEE
bid asks
Allocated Resources Handset
[image:5.595.155.442.90.277.2]Handset
Figure 1. An overview of the system architecture. Black nodes in regions represent market servers and grey nodes represent allocated resources for a particular call from the caller to the callee.
tries to reserve a resource bundle (i.e. a set of resources in a single region) from its local market server. The resources in a bundle are interrelated which, in this context, means that they form a path within the region and are not just any resources. Buyer agents work together to collectively make a complete source-to-destination path across the regions using the bundles. If a resource bundle cannot be obtained, then a backtracking mechanism is used which allows alternative allocations to be made if currently reserved bundles cannot lead to the final destination.
divided. Here we regard a network region as a group of nodes that are situated geographically close together. By geographical position, we refer to the physical placement where nodes are positioned in a way such that they can communicate with other nodes that are within their transmitter ranges. These are typically neighbouring nodes. Thus, in order for any two nodes to be able to communicate, they must be positioned geographically close together so that they are within reachable distance of each other. In this application, we consider a static network configuration as defined at deployment time. Nodes on the edge of regions can communicate with other edge nodes in neighbouring regions. In using local markets, resource information does not have to be replicated across all markets in the network. This is good since the market server that receives a bid from a buyer does not need to contact all other markets to make sure that the same resources are not being sold elsewhere, for each bid placed. The downside, however, is that allocations that span multiple markets need to be closely coordinated.
1.2. The Agents and the Markets
Auctioneer agents conduct auctions using a combinatorial reverse auction protocol (Sandholm et al., 2002) to allocate goods (units of node band-width) to buyers (i.e. they allocate acombination of goods that consist of the cheapest possible bundles). There is one auctioneer agent per region in the network, each on their respective market server nodes. Auctioneer agents execute a winner determination protocol that determines which resources are allocated to which parties, for each bid submitted. There are several seller agents per region, one owning each node, where they each submit an individual ask price to their local markets. The implication of each seller agent owning a node is that they can attempt to compete against each other by pricing their respective resources competitively. To minimise communication in the network, all seller agents are physically deployed on their local market server nodes.
We assume that, currently, sellers all use the same linear pricing strat-egy. A seller agent begins with a total ofλresource units initially priced at one price unit each. For each unit sold, the price increases by one price unit (i.e. when there is only one resource unit left, it should costλprice units). Conversely, for each unit reclaimed by a seller, the price reduces by one price unit. The initial low price per unit is chosen so that sellers can sell resources more easily to begin with. As demand for resources increases, the price per unit increases so that buyer agents have to pay more for resources and seller agents can increase their profit. Sellers also reduce the price of their resources by one price unit when they have reclaimed a resource so that they can remain competitive against other seller agents. In our work, a buyer submits a bid composed of several bundles, of which only one is required. The winner determination algorithm then attempts to allocate resources by minimising the amount spent. In more detail, for each bid submitted by a buyer, the set of winning sellers and thus, resources, must be found. For each buyer, the auctioneer has a set of resources that it tries to acquire, M = {1, 2, ..., m}, as specified by each bundle in a buyer bid. Buyers only ever bid for single units of goods for their bundles, since one unit of node bandwidth is assumed to be sufficient capacity for handling a call. They specify for which nodes these single resource units are required for each bundle: U = {u1, u2, ..., um}
where, in this case, ui = 1. Sellers only ever sell one type of resource
each (i.e. the bandwidth of a single node which is a different and unique node for each seller). They each submit an ask individually where the market eventually receives the set of asks from all sellers: A = {A1, A2,
..., Am}. Each ask is a tupleAj = hλj,pj i whereλj ≥0 is the number
of resource units of a node offered by the ask from the jth seller andpj
the following:
bundle= Pm
i=1 pixi s.t. Pmi=1 λixi ≥ ui, i = 1, 2, ...,m xi ∈ {0,1},
where this is computed for each bundle in a buyer bid and where the bundle with the minimum cost is allocated from the ones submitted by the buyer agent in its bid. (x takes the value of 1 if resourceiis wanted, or 0 otherwise).
Here we use a relatively straightforward technique for solving the win-ner determination problem because the numbers of bids that need to be considered at each market server are relatively small.1 A buyer requests one bundle of resources from a set of bundles submitted to its local market. On receipt of these bundles, the auctioneer iterates through the resources in each bundle, one at a time, in order to check if all the resources are available. Whilst doing this, the auctioneer sums up the values of the resources in each bundle to compute the total price of each bundle. When iterating through the bundles, if a resource is not available, then that bundle can be discarded since an incomplete bundle is inadequate to form a path. Then, from the bundles that are available as a set, the cheapest one is allocated to the buyer so that a sub-path can be made. Our approach is inspired by using pure market-based approaches, which focus only on price to decide which bundle to choose. This implies that the bundle allocated by an auctioneer may not be the shortest or rely on more robust nodes: price however provides an indication of resource availability. For bundles with an identical cheapest price, the shorter bundle is chosen since less resource units are consumed. If the price and bundle size are the same, then the bundle is chosen randomly. Thus, this is the procedure used to find the set of winning sellers whose resources are successfully reserved.
1
Assuming that a buyer agent’s bid is successful, resources are sold at the seller agent’s asking price. There is one buyer agent placed on each in-dividual node where they await call requests, from callers, from any point in the network. We assume that all buyer agents use the same purchasing strategy. Thus, when a buyer agent receives a request for purchasing node bandwidth, it formulates its bid. It attempts to find the cheapest set of routes that lead from its current node to a destination node within its own region. Now, in this work, we assume that buyer agents select a set of bundles that minimise the length of their desired routes. The intuition here is that the buyer believes shorter routes are generally cheaper since they contain fewer resources.
We make the assumption that buyer agents are only allowed to submit up to a certain number of bundles for each bid. The value chosen here must be enough to allow some flexibility in the bundle that a buyer could be allocated, but it should not be so high that the market algorithm has to do significant amounts of unnecessary processing. If the final destination node is within the same region, that node is the destination node. The bundles selected by a buyer agent are sent as a bid to the buyer’s local market. Finally, if the buyer agent is successful in reserving resources, it is informed by the local market. Callers are assumed to pay for successfully established calls per region where the cost per region is proportional to the number of resources in the region. This is realistic because, generally speaking, the longer the distance of a call, the more resources are used and, therefore, the more the call would cost.
1.3. Acquiring Resources Across Regions
b1
b2
[image:11.595.197.399.95.220.2]REGION 2 REGION 3
Figure 2. A market server in region 2 (black node) contacting a buyer agent, b2, in the following region for setting up a multi-region call. Grey nodes represent a reserved resource bundle for b1 in region 2.
the final destination for a call is in a different region from the one in which a buyer is located, then this buyer will attempt to find routes that lead to a node within its region that is connected to a node in a neighbouring region that leads to the final destination. Then, in a multi-region call, once a buyer agent has successfully reserved a bundle of resources, the market server in that region is responsible for contacting a buyer agent that is on the edge of the next region. The node on which this second buyer agent resides must be in reach of the last node in the bundle of resources that have been reserved in the previous region. Thus, these boundary nodes will relay the call from the initiating source node to the final destination node, such that there is a continuous path when/if the call eventually takes place.
region until the final node is reached and the call is set up. In general, the system allows buyers to choose which region to contact next when there is a choice of following regions in a multi-region call. In such a case, the regional route that involves the use of the fewest regions for the set up of a call is preferred (i.e. the shortest regional route).
Once the final destination has been reached, the market server in the last region sends a commit message to the buyer agent within its own region. This buyer agent then contacts the market server in the previous region which, in turn, informs its buyer agent and so on, until the initial region is reached. Eventually, the originating buyer agent receives the commit message and the call can be placed. Thus, there is a reservation and commitment process that takes place in the system, where payment for resources only takes place during the commit phase once all of the necessary resources have been acquired. When the call has completed, a message is sent from the initial buyer to its local market (and to all other markets and buyers involved in this call in the direction of the final region) to signal that resources can be released. The markets then resell the resources to buyers that place bids for them in the future. (The overall behaviour of the system described here is outlined, from a global perspective, in a formalisation that appears in section 2).
search for other routes which have previously been unexplored. Thus, agents perform a distributed search for resource bundles.
2. System Formalisation
This section provides a formal description of the system that was previ-ously outlined in section 1. The definitions of the variables are given first. This is followed by a description of the global system behaviour, along with an algorithm that describes this behaviour.
The definitions of the system variables now follow.
− allocation : a bundle of bandwidth resources actually allocated to a buyer;
− availablebundles : sets of bandwidth resources that are currently available, as complete bundles, from the local market server;
− calldest: the final call destination node to which a complete resource path is to be made, for a particular call;
− region : the current network region.
The system behaviour is outlined in algorithm 1. A description of the main functionality of the algorithm also follows. Algorithm 1 starts with calls originating from handsets where call attempts are made (lines 1 to 3). Here, the local region for each handset is obtained (getLocalRegion) along with the call destination (getCallDestination).
Algorithm 1 System Algorithm
1: for allh∈H do .whereH is the set of all handsets
2: processCallAttempt(h.getLocalRegion(), getCallDestination())
3: end for
4:
5: procedureprocessCallAttempt(region, calldest)
6: allocation←reserveResources(region, calldest)
7:
8: if allocation6=nullthen
9: notif yBuyer(allocation)
10:
11: if isF inalDestination(region, calldest)then
12: notif ySellers()
13: commit()
14: makeCall()
15: releaseResources()
16: else
17: processCallAttempt(
18: contactN extRegion(region, calldest), calldest)
19: end if
20: else
21: retryAnotherRoute(calldest)
22: end if
23: end procedure
24:
25: procedurereserveResources(region, calldest)
26: availablebundles←checkBundleAvailability(region, calldest)
27: allocation←allocateCheapestBundle(availablebundles)
28:
29: if allocation6=nullthen
30: removeResourcesF romRepository(allocation)
31: end if
32:
33: returnallocation
34: end procedure
resources (notif ySellers). This occurs at the same time as the commit message being sent, via (commit), between market servers and buyers that were involved in setting up the call across all regions where resources were reserved. The call is then made (makeCall) after which the resources are released (releaseResources). If the current region does not contain the call destination, then the next region is contacted (contactN extRegion) which leads towards the call destination. This is so that the resource reser-vation process can continue. Finally, if an allocation was not successful, then the backtracking process (retryAnotherRoute) takes place where alternative routes are searched for in the current region or in the previous region. The backtracking process continues until either a complete source-to-destination path is found or until all paths searched for have been exhausted.
The reserveResources procedure : This procedure (lines 25 to 34) is executed by auctioneer agents, each on their respective market servers. It first checks to see which bundles of bandwidth resources are available as complete sets of resources (checkBundleAvailability) and then allocates the cheapest one (allocateCheapestBundle). If an allocation is made, it is removed from the local market server repository so that these same resources cannot be re-reserved for another buyer.
3. Experimental Evaluation
3.1. Experimental Methodology and Settings
Previously, we have explored the basic behaviour of our system in terms
of average call success rate and average call set up time when compared
against optimum and random strategies. This provided us with an insight into a fundamental measure of the percentage of successful calls and set up times, respectively, given one particular network setting. While this was promising, the aim of our current work is to extend this evaluation in order to ascertain its properties in a wider range of situations. In particular, we are interested in issues associated with region scalability and robustness. Looking at the former will give us an understanding of how the structuring of the network into regions impacts the performance for a given network size. Testing for the latter will show how well the system performs with market failures (which obviously occur in real world settings).
different set ups. This helps them dimension their servers to support the anticipated load. Since nodes operate by battery power and are designed to consume as little power as possible, it is desirable for message process-ing to be distributed amongst several market servers. (As the size of a region increases, the load on a server would typically increase. However, as the number of regions increases, the multi-region handling overhead would increase too). By studying these two measures, we can observe a trade-off between attempting to satisfy end users of the system and the amount of processing per market server (see section 3.2.3). This trade-off can provide network deployers with an insight into how to dimension the network. (We acknowledge that other measures may also be used to evaluate the system and that they may be studied at a later date).
For robustness testing, a market failure was introduced in the network. The average call success rate (section 3.3.1) and messages received per market server (see section 3.3.2) were also measured for robustness testing. As with scalability testing, the average call success rate is an equally applicable measure to investigate for robustness testing, given a market failure. For the sake of consistency, we chose to investigate asingle market failure throughout all of the robustness testing. Given that our goal is to understand the impact of regions in the presence of failures, we assume that all buyers have knowledge of the failed market server and, thus, we do not deal with failure detection. Finally, as with the scalability testing, a trade-off was looked at to find the optimum number of regions (section 3.3.3). For all experiments in sections 3.2 and 3.3, the network load was increased by varying the call origination probability (i.e. the probability of a call originating from any given unused handset).
1 REGION 2 REGIONS 3 REGIONS
[image:18.595.195.399.97.166.2]4 REGIONS 5 REGIONS 10 REGIONS 20 REGIONS
Figure 3. Set of seven tori used where each consists of an 80-node (20-by-4) network but is split into a different number of regions.
each region (market servers are placed manually within a central loca-tion in their regions where there is a high connectivity of neighbouring nodes). Thus, all of the experimental set ups use an 80-node (20-by-4) network. This was chosen because it demonstrates a topology that can be partitioned vertically with ease into several regions such that it is easier to evaluate the system for scalability. For each set up, the network was wrapped around and shaped into a torus, as shown in figure 3.2 Also,
all calls made were unidirectional (i.e. calls travel in only one direction around the torus). The combination of joining the beginning and end of the network to form a torus and allowing calls to traverse the network in one direction ensures fairness in our experiments for two reasons. Firstly, the number of types of different distance calls made within any set up are the same. For example, given the five region set up, there are exactly five different types of calls that require a single region, five different types that span across two regions, five types of triple region calls, and so on. Secondly, by using a torus, the average load in any region is the same, since there is no central region through which any extra calls traverse. This provides an even setting for testing the system.
The experimental settings we used in this evaluation were obtained from a domain expert. Specifically, each experiment was run for a total
2
of 100,000 time steps. The duration of a call was set to 1,000 time steps. We assume that each node has 2 handsets attached to it and has a total of 10 units of bandwidth capacity available, allowing each node to relay up to 10 simultaneous calls at any one time. Calls were made to originate after every 50 time steps. Buyer agents were allowed to submit bids that contained a choice of 5 bundles from which an attempt was made to allocate the cheapest one available. Finally, the results presented in this paper are statistically significant with 95% confidence.
3.2. Scalability Testing
This section describes the experimental results obtained from carrying out the scalability testing outlined in section 3.1.
3.2.1. Average Call Success Rate
0 0.1 0.2 0.3 0.4 0.5 0.6 0.7 0.8 0.9 1 1.1 1.2
0 0.05 0.1 0.15 0.2 0.25 0.3 0.35 0.4
(Call Success Rate) / (Call Success Rate for 1 Region Network)
Call Origination Probability 1 Region Net
[image:20.595.195.395.97.240.2]2 Region Net 3 Region Net 4 Region Net 5 Region Net 10 Region Net 20 Region Net
Figure 4. Average call success rate over the 1 region set up average call success rate, as the call origination probability is varied.
more searching for resource bundles takes place, resources are reserved for longer periods of time, while calls are being set up. Consequently, this reduces the chance of other calls being made.
1 region case since there is only a single region and, therefore, if the initial attempt fails, the call set up fails.
However, a point is reached where actually having more regions (i.e. 4 or more) starts to give lower average call success rates than the 1 region set up, even at low call origination probabilities. Our understanding of why this occurs is that the additional multi-region handling required to pro-cess calls increases when using these network set ups. In these cases, the number of resources that are currently reserved during the search process is higher with more regions and this prevents other calls from being made. As a result, with 4 or more regions, the additional searching blocks more resources and, therefore, the average call success rate decreases. When the call origination probability increases, resource contention increases for all network set ups (i.e. node bandwidth becomes more scarce). For multi-region cases, more searching for resource bundles takes place, where resources are reserved for longer periods of time, while a call is being set up. Consequently, this reduces the chance of other calls being made. This is not an issue with the 1 region network and, therefore, it is only at this point that the single region network set up begins to perform better than all of the multi-region network set ups.
3.2.2. Market Server Load
0 25000 50000 75000 100000 125000 150000 175000 200000 225000
0 0.05 0.1 0.15 0.2 0.25 0.3 0.35 0.4
Average No. of Messages Received per Market Server
Call Origination Probability 1 Region Net
[image:22.595.195.395.102.240.2]2 Region Net 3 Region Net 4 Region Net 5 Region Net 10 Region Net 20 Region Net
Figure 5. Average number of messages received per market server, as the call origination probability is varied.
one. Our hypothesis was that there would be a lower number of messages received by a market server, per simulation run, as the number of network regions increases. This is important because if market servers receive fewer messages then less processing needs to take place, less battery power is consumed, fewer input buffers are required and, therefore, the overall load on a server is less.
the load is better distributed, which is desirable, since less processing is required per server).
Whilst the total number of messages received by all market servers in each network set up is higher with an increasing number of regions, this sum of messages does not increase by a disproportionate amount when, say, the number of regions doubles. For example, at a call origination probability of 0.04, there is only a 35% increase in the total number of messages received by all market servers from the 5 region network set up to the 10 region case. Also, at a lower call origination probability of 0.01, there is only an 8% increase in the total number of messages from the single region case to the 2 region network set up. However, it still remains the case that the average load per market server decreases with increasing number of regions and this is a useful result, since it is the processingper
market server that we wish to minimise.
3.2.3. Optimum Number of Network Regions
Our result from figure 4 shows that, given specific call origination proba-bilities, the average call success rate is generally higher when the network is partitioned into a smaller number of regions. Alternatively, figure 5 showed that the number of messages received per market server decreases per market when there are more regions in the network. Thus, figure 4 (average call success rate) shows that less regions is better and figure 5 (messages received per market server) indicates that more regions gives a better performance.
0.4 0.5 0.6 0.7 0.8 0.9 1 0 0.05 0.1 0.15 0.2 0.25 0.3 0.35 0.4 0 2 4 6 8 10 12 14 16 18 20 2 4 6 8 10 12 14 16 18
PSfrag replacements Weigh
[image:24.595.179.408.111.280.2]t Value for A Call Origination Probabilit y Optim um Num b er of Net w ork Regions
Figure 6. Optimum number of regions, as call origination probability and weight value for A are varied.
When the network designer believes that receiving fewer messages per market server is more important than the average call success rate in the system (i.e. when B>A), the optimum number of regions to deploy is 20, across all call origination probabilities. This observation can be explained by the fact that a lower value for A means more importance is given to the number of messages received per market server, where the utility is higher when there are more regions.
When the network designer gives an equal importance to the average call success rate in the system and to receiving fewer messages per market server (i.e. when A = B = 0.5), the optimum number of regions that should be deployed decreases from 20 to 10, 3, 10 and then back to 20, given call origination probabilities of 0.01, 0.02, 0.04, 0.08 and 0.1, respectively. Thus, a minimum is seen across the optimum set of regions when A is 0.5. A similar pattern is observed when the importance given to average call success rate increases, thereby preserving the minimum. When a higher weighting is given to the average call success rate, the optimum number of regions drops further. The reason for this is that with intermediate call origination probabilities between 0.02 and 0.08, the difference in the average call success rates begins to widen with an increasing number of regions. This is also shown in figure 4 where the largest change in average call success rate occurs between these values of call origination probability. Thus, it becomes more evident that the fewer regions there are, the higher the average call success rate. In addition to this, because there is a higher weight value for A than there is for B, the optimum number of regions to deploy begins to decrease.
is best. Figure 6 shows that at these call origination probabilities, there is a maximum when the 2 region network provides the optimum solution. (Section 3.2.1 provided an explanation for why the 2 region network gave a higher average call success rate at these call origination probabilities).
3.3. Robustness Testing
This section provides the experimental results obtained from carrying out the robustness tests that were outlined in section 3.1.
3.3.1. Average Call Success Rate with Failure
0 0.1 0.2 0.3 0.4 0.5 0.6 0.7 0.8 0.9 1 1.1 1.2
0 0.05 0.1 0.15 0.2 0.25 0.3 0.35 0.4
(Call Success Rate) / (Call Success Rate for 20 Region Network)
Call Origination Probability 2 Region Net
[image:27.595.196.391.93.241.2]3 Region Net 4 Region Net 5 Region Net 10 Region Net 20 Region Net
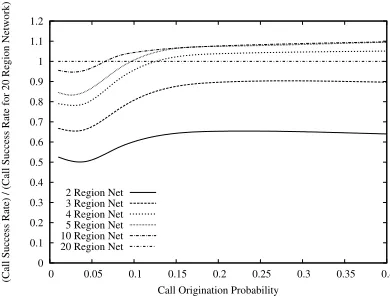
Figure 7. Average call success rate over the 20 region set up average call success rate, as the call origination probability is varied and where there is a single market failure.
increases. However, when the call origination probability exceeds 0.06, the call success rate decreases from the 10 region set up to the 20 region set up. We also notice that when the call origination probability exceeds 0.13, the 4 region set up performs better than the 20 region case and that beyond 0.1, the 5 region set up is also better than the 20 region set up.
These results can be explained by the following. When the number of regions increases and there is asingle market server failure, themaximum
attempted in the 5 region set up. Now given this, for the 2 region set up (regions A and B) without any market server failures, there are 4 different types of calls that can take place: A, B, AB and BA. If there is a single market server failure, for example in region A, only calls that originate, traverse and/or terminate in region B can possibly be set up. Since there is an equal probability of any of the 4 different types of call attempts being made, this means that the maximum percentage of calls that can take place in this example is 25% (1/4) since no calls can involve region A. In the 5 region set up, without any failures, there are 25 different types of calls that can exist, where there is an equal probability of each type occurring (e.g. 5 different single region calls (A, B, C, D, E), 5 double region calls (AB, BC, CD, DE, EA), and so on). Given a single market server failure, a maximum of 40% (10/25) of calls can take place. This principle applies to each network set up.
The following formula can be used to calculate the proportion of calls that can take place, given a single market server failure: (n−1)/2n, where n is the total number of regions originally present in a given network set up.3 Thus, the percentages show that, given the network set ups in figure 3, the impact on the performance is affected more with a market
3
This formula is derived in the following way for the unidirectional torus. If n is
the total number of regions present in the network, then given a single market server
failure, there are 0 types of calls that are nregions in length, 1 type of calls that are
(n−1) regions in length, 2 types of calls that are (n−2) regions long, and so on, where
each of these is non-negative. Therefore, we get 1 +...+ (n−2) + (n−1) kinds of calls
that can take place. For the general case, where nis a positive integer greater than 1,
this can be represented more formally as: n
−1 X
i=1
(n−i) =
n
−1 X
i=1
i which simplifies to ((n−1)n)/2 .
If we now wish to calculate the maximum rate of calls that can take place, we must divide by the total number of different types of calls that could be placed if there was
no market server failure. Thus, we divide byn2
since in annregion network, there are
n different kinds of single region calls,n different kinds of double region calls, and so
on. Therefore, we obtain the following: ((n−1)n)/2
failure, when there are fewer regions in the first instance. However, as already mentioned, the 4, 5 and 10 region set ups give better call success rates than the 20 region case at intermediate and heavier network loads. Our reading into this result suggests that when resources are more scarce, the excessive multi-region handling of the 20 region set up occupies re-sources for longer periods of time as compared to the 4, 5 and 10 region set ups. This is regardless of the maximum percentage of calls being higher for the 20 region case (47.5%), which is only apparent at lower call origination probabilities when resources are plentiful. Thus, figure 7 shows that at most network load levels, a network designer should ideally deploy a network which has between 5 and 10 regions if a market failure is anticipated.
3.3.2. Market Server Load with Failure
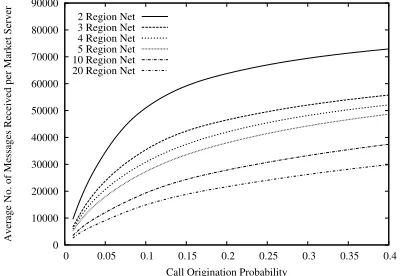
We now look at the load with respect to the number of messages received per market server, as the number of regions is scaled up, when there is a single market failure in the network. As discussed in section 3.2.2, we consider all of the different types of messages that are received by the market servers. Our hypothesis was that, even with a single market server failure, there would be a lower number of messages received by a market server, per simulation run, as the number of network regions increases.
0 10000 20000 30000 40000 50000 60000 70000 80000 90000
0 0.05 0.1 0.15 0.2 0.25 0.3 0.35 0.4
Average No. of Messages Received per Market Server
Call Origination Probability 2 Region Net
[image:30.595.195.395.102.240.2]3 Region Net 4 Region Net 5 Region Net 10 Region Net 20 Region Net
Figure 8. Average number of messages received per market server, as the call origination probability is varied and where there is a single market failure.
20 regions, there are just 21,500 messages per server. A similar pattern is seen at all call origination probability values, as the number of regions is scaled up.
Our analysis of this result indicates that this can be explained by the same trend that was described in section 3.2.2 when there is no market server failure. Inducing a single market failure in the network made no difference to the general pattern which showed that as the number of markets is increased, the average number of messages received per market server decreased. Thus, the benefits of distribution are maintained with respect to the message load per server.
3.3.3. Optimum Number of Network Regions with Failure
0.5 0.6 0.7 0.8 0.9 1 0 0.05 0.1 0.15 0.2 0.25 0.3 0.35 0.4 10 12 14 16 18 20 11 12 13 14 15 16 17 18 19 PSfrag replacements Weigh tV alue for A Call Origination Probabilit y Optim um Num b er of Net w ork Regions
Figure 9. Optimum number of regions, as call origination probability and weight value for A are varied, where there is a single market failure.
When the network designer believes that receiving fewer messages per market server is more important than the average call success rate in the system (i.e. when B>A), the optimum number of regions to deploy is 20, across all call origination probabilities. Thus, a similar observation is made here as was noticed in section 3.2.3 when there is no market server failure. When the network designer gives an equal importance to the average call success rate in the system and to receiving fewer messages per market server (i.e. when A = B = 0.5) and also when the importance given to A is twice that given to B (i.e. when A = 0.67 and B = 0.33), the same trend continues where the optimum number of regions for deployment remains at 20, across all call origination probabilities.
but that this changes when they are increased (i.e. between 0.04 to 0.2) where the optimum number of regions drops to 10 and then goes back to 20 beyond call origination probabilities of 0.2. Thus, a minimum is seen across the optimum set of regions when A is 0.75. The reason for this trend is that beyond a call origination probability of 0.06, the trend in the average call success rates changes where the 10 region network set up begins to give the best performance, only marginally beating the 5 region set up (see figure 7).
Finally, when exclusive importance is given by the network designer to the average call success rate (i.e. when A = 1 and B = 0), figure 9 shows that the 20 region case is the best network set up at low call origination probabilities (up to 0.04). However, at intermediate and higher call origi-nation probabilities (above 0.06), figure 9 also shows that deploying the 10 region network gives the best overall performance. In fact the difference between using 10 and 5 regions is marginal when the call origination probability is above 0.12. Thus, at intermediate and higher network traffic loads, a network designer should consider using no more than 10 regions for network deployment. This trend can be explained simply by looking at figure 7 which shows that the 10 region network gives the highest average call success rate above a call origination probability of approximately 0.06.
3.3.4. Call Distances
0 0.1 0.2 0.3 0.4 0.5 0.6 0.7 0.8 0.9 1
0 0.05 0.1 0.15 0.2 0.25 0.3 0.35 0.4
Average Call Success Rate
Call Origination Probability S-NF
S-WF
I-NF I-WF
L-NF L-WF
[image:33.595.196.392.100.241.2]Short distance - No Failure (S-NF) Short distance - With Failure (S-WF) Intermediate distance - No Failure (I-NF) Intermediate distance - With Failure (I-WF) Long distance - No Failure (L-NF) Long distance - With Failure (L-WF)
Figure 10. Average call success rate for different distance calls for the 10 region net-work, with and without a single market failure, as the call origination probability is varied.
and 7 regions and long distance calls cover 8 to 10 regions. The percentage of long distance calls for the failure case is less than without failures since, intuitively, our understanding suggests that the number of these calls is restricted more in the failure case (i.e. given the 10 region network set up in figure 3 with a single market server failure, no calls which span across all 10 regions can be made, for example). Thus, there are more resources available in the network for shorter distance calls to be more successful and indeed, figure 10 shows that the success rate of such calls is greater for the failure case beyond a call origination probability of 0.03. Finally, figure 10 also shows that the number of intermediate distance calls are roughly the same when the call origination probability exceeds 0.08.
4. Related Work
telecommunications network. The system used a double auction proto-col (Wurman, Walsh and Wellman, 1998) with sealed bids and provided good utilisation of the network where the load was also balanced. How-ever, a drawback of this system was that if some resources on a path were already bought and the next desired resource could not be obtained, then the resources already bought could become redundant and money would be spent unnecessarily. In contrast, our reserve/commit mechanism ensures that this situation is avoided by releasing unused resources imme-diately and allowing payment to occur only after all necessary resources have been successfully reserved.
TheGlobal Electronic Market System(GEM) is a framework for
decen-tralised markets across the Internet (Rachlevsky-Reich et al., 1999). GEM has a single market which is distributed on which goods are sold. In GEM, the markets are replicated and the order for goods is distributed across these markets. Looking at GEM provided an insight into one method of how servers in a market-based resource allocation system could be dis-tributed. However, the approach taken by GEM of replicating the resource information is not suitable for our system because it would induce more messages in the network than our partitioned approach (as was outlined in section 1.1).
MIDAS is an auction-based mechanism that allocates link bandwidth in a network for making paths (Courcoubetis, Dramitinos and Stamoulis, 2001). Simultaneous multi-unit Dutch auctions were used as the protocol for allocating resources. However, this protocol would be inadequate for our requirements since it is not capable of allocating several interrelated goods at the same time.
using a high-bandwidth network which is an assumption that does not hold within our work.
5. Conclusions and Future Work
In this paper, a system was described that allocates end-to-end bandwidth to set up calls in a network using market-based agents. The system used a combinatorial reverse auction where bundles of interrelated resources were allocated. Scalability testing was performed with respect to increasing the number of regions in a fixed size network. In conclusion, the results from the experiments conducted in this paper show that if light to average network loads are anticipated, then the network designer should consider deploying a decentralised network with a few regions rather than opting for a completely centralised system with a single market. We also see that the average number of messages received per market server is less as the number of regions is scaled up, and thus, allowing the processing of bids and the message load to be distributed better amongst the market servers when there are more of them.
de-creases progressively, at intermediate call origination probabilities, where a minimum is seen. If a network designer wishes to associate a greater importance to the average call success rate than the number of messages received per market server, the general trend that shows this minimum continues.
Robustness testing was also performed by inducing a single market server failure. This showed that at intermediate and higher values of call origination probability, the call success rate was higher as the number of regions increased until a maximum was reached, beyond which the call success rate decreased. This result was brought about by the fact that, given a market failure, there is a greater impact on the average call success rate when there are fewer regions in the network. We also saw that the number of messages received per market server decreased as the number of regions was scaled up, and that this trend follows the one where there is no failure in the network.
For robustness testing, we also looked at the trade-off between the call success rate and the number of messages received per market server. Here, we found that at most call origination probabilities and weight values, generally speaking, deploying more regions in the network was best. We also saw a minimum across the optimum number of regions when increasing the call origination probability, when the importance for the average call success rate was considerably greater than the importance assigned to the number of messages received per market server. However, even with this minimum, results suggested that generally speaking, when a market server failure is likely to occur, then deploying a higher number of regions is better than when there are too few regions.
market server failure in the network at all. This was explained by the fact that more longer distance calls were restricted in the failure case, thereby allowing many other shorter distance calls to take place with the remaining resources. This is a good result if a market server failure is likely to occur and if more shorter distance calls are envisaged being made. However, on the downside, the higher overall call success rate comes at the expense of fewer longer distance calls being made.
Acknowledgements
References
L. ChunLin and L. Layuan. A two level market model for resource allocation
opti-mization in computational grid. In CF ’05: Proceedings of the 2nd conference on
Computing frontiers, pages 66–71, New York, NY, USA, 2005. ACM Press.
S. H. Clearwater. Market-Based Control: A Paradigm For Distributed Resource
Al-location. World Scientific Publishing Co. Pte. Ltd, Covent Garden, London, 1996.
C. Courcoubetis, M. Dramitinos, and G. D. Stamoulis. An auction mechanism for bandwidth allocation over paths: New results. Technical report, London, UK, June 2001.
P. D. Ezhilchelvan and G. Morgan. A dependable distributed auction system:
Ar-chitecture and an implementation framework. In International Symposium on
Autonomous Decentralized Systems, pages 3–10, 2001.
M. A. Gibney and N. R. Jennings. Dynamic resource allocation by market-based routing in telecommunications networks. In S. Albayrak and F. J. Garijo, editors,
Intelligent Agents for Telecommunication Applications — Proceedings of the Second International Workshop on Intelligent Agents for Telecommunication (IATA’98), volume 1437, pages 102–117. Springer-Verlag: Heidelberg, Germany, 1998.
M. Goemans, L. E. Li, V. S. Mirrokni, and M. Thottan. Market sharing games applied
to content distribution in ad-hoc networks. InMobiHoc ’04: Proceedings of the 5th
ACM international symposium on Mobile ad hoc networking and computing, pages 55–66, New York, NY, USA, 2004. ACM Press.
N. Haque, N. R. Jennings, and L. Moreau. Resource allocation in communication
networks using market-based agents. International Journal of Knowledge Based
Systems, 18(4-5):163–170, August 2005a.
N. Haque, N. R. Jennings, and L. Moreau. Scalability and robustness of a market-based
network resource allocation system. In D. Grosu and J. Shapiro, editors,Proceedings
of the First International Workshop on Incentive Based Computing (IBC05), pages 30–39. University of Technology of Compiegne, France, September 2005b.
T. M. Heikkinen. On congestion pricing in a wireless network. Wireless Networks,
8(4):347–354, 2002.
J. Hulaas, H. Stormer, and M. Schnhoff. Anaisoft: An agent-based architecture for
dis-tributed market-based workflow management. InProceedings of the Software Agents
and Workflows for Systems Interoperability workshop of the Sixth International Conference on CSCW in Design, June 2001.
P. W. Keller, F. Duguay, and D. Precup. Redagent-2003: An autonomous
market-based supply-chain management agent. In AAMAS ’04: Proceedings of the Third
International Joint Conference on Autonomous Agents and Multiagent Systems, pages 1182–1189, Washington, DC, USA, 2004. IEEE Computer Society.
Rodr´ıguez-Aguilar, editors,Agent-Mediated Electronic Commerce VI, Theories for and Engineering of Distributed Mechanisms and Systems AAMAS 2004 Workshop, Amec 2004, New York, NY, USA, July 19, 2004, volume 3435 ofLecture Notes in Computer Science, pages 73–86. Springer, 2006. ISBN 3-540-29737-5.
P. Nicopolitidis, M. S. Obaidat, G. I. Papadimitriou, and A. S. Pomportsis. Wireless
Networks. John Wiley & Sons Ltd, Chichester, England, 2003.
L. L. Peterson and B. S. Davie. Computer Networks: A Systems Approach. Morgan
Kaufmann Publishers Inc, San Francisco, California, 2003.
B. Rachlevsky-Reich, I. Ben-Shaul, N. T. Chan, A. W. Lo, and T. Poggio. GEM: A
global electronic market system. Information Systems, 24(6):495–518, 1999.
O. Ratsimor, T. Finin, A. Joshi, and Y. Yesha. encentive: a framework for intelligent
marketing in mobile peer-to-peer environments. In ICEC ’03: Proceedings of the
5th international conference on Electronic commerce, pages 87–94, New York, NY, USA, 2003. ACM Press.
T. Sandholm, S. Suri, A. Gilpin, and D. Levine. Winner determination in combinatorial
auction generalizations. InProceedings of the First International Joint Conference
on Autonomous Agents and Multiagent Systems (AAMAS), pages 69–76, Bologna, Italy, July 2002.
Y. Z. Wei, L. Moreau, and N. R. Jennings. A market-based approach to recommender
systems. ACM Transactions on Information Systems (TOIS), 23(3):227–266, 2005.
M. P. Wellman, J. K. MacKie-Mason, D. M. Reeves, and S. Swaminathan. Exploring
bidding strategies for market-based scheduling. In EC ’03: Proceedings of the 4th
ACM conference on Electronic commerce, pages 115–124, New York, NY, USA, 2003. ACM Press.
P. Wurman, W. Walsh, and M. P. Wellman. Flexible double auctions for electronic