Optimizing Area Spectral and Energy Efficiency
.
White Rose Research Online URL for this paper:
http://eprints.whiterose.ac.uk/129571/
Version: Accepted Version
Article:
Hashmi, US, Zaidi, SAR and Imran, A (2018) User-Centric Cloud RAN: An Analytical
Framework for Optimizing Area Spectral and Energy Efficiency. IEEE Access, 6. pp.
19859-19875. ISSN 2169-3536
https://doi.org/10.1109/ACCESS.2018.2820898
© 2018 IEEE. Personal use of this material is permitted. Permission from IEEE must be
obtained for all other uses, in any current or future media, including reprinting/republishing
this material for advertising or promotional purposes, creating new collective works, for
resale or redistribution to servers or lists, or reuse of any copyrighted component of this
work in other works.
[email protected] https://eprints.whiterose.ac.uk/
Reuse
Items deposited in White Rose Research Online are protected by copyright, with all rights reserved unless indicated otherwise. They may be downloaded and/or printed for private study, or other acts as permitted by national copyright laws. The publisher or other rights holders may allow further reproduction and re-use of the full text version. This is indicated by the licence information on the White Rose Research Online record for the item.
Takedown
If you consider content in White Rose Research Online to be in breach of UK law, please notify us by
User-Centric Cloud RAN: An Analytical framework
for Optimizing Area Spectral and Energy Efficiency
Umair Sajid Hashmi
∗, Syed Ali Raza Zaidi
†and Ali Imran
∗∗
BSON Lab, School of Electrical and Computer Engineering, University of Oklahoma, Tulsa, OK, USA
†School of Electronic and Electrical Engineering, University of Leeds, Leeds LS2 9JT, U.K.
Abstract—In this article, we develop a statistical framework to quantify the area spectral efficiency (ASE) and the energy efficiency (EE) performance of a user-centric cloud based ra-dio access network (UC-RAN) downlink. We propose a user-centric remote radio head (RRH) clustering mechanism, which: (i) provides significant improvement in the received signal-to-interference-ratio (SIR) through selection diversity; (ii) enables efficient interference protection by inducing repulsion among scheduled user-centric RRH clusters and (iii) can self-organize the cluster radius to deal with spatio-temporal variations in user densities. It is shown that under the proposed user-centric clustering mechanism, the ASE (bits/s/Hz/m2) maximizes at an optimal cluster size. It is observed that this cluster size is sensitive to changes in both RRH and user densities and hence must be adapted with variations in these parameters. Next, we formulate the cost paid for the UC-RAN capacity gains in terms of power consumption, which is then translated into the EE (bits/s/Joule) of the UC-RAN. It is observed that the cluster radius which maximizes the EE of the UC-RAN is relatively larger as compared to that which yields maximum ASE. Consequently, we notice that the trade-off between the ASE and the EE of UC-RAN manifests itself in terms of cluster radius selection. Such tradeoff can be exploited by leveraging a simple two player cooperative game. Numerical results show that the optimal cluster radius obtained from the Nash bargaining solution of the modeled bargaining problem may be adjusted through an exponential weightage parameter that offers a mechanism to utilize the inherent ASE-EE trade-off in a UC-RAN. Furthermore, in comparison to existing state of the art non user-centric network models, our proposed scheme, by virtue of selective RRH activation and non overlapping user-centric RRH clusters, offers higher and adjustable system ASE and EE, particularly in dense deployment scenarios.
Index Terms—User-centric architectures, Cloud radio access networks, Self Organizing Networks, Area spectral efficiency, Energy efficiency, Nash bargaining solution, Poisson point process
I. INTRODUCTION
A. Motivation
As the mobile data transmission is expected to grow 7-fold from 2016 to 2021 [1], network densification through a conglomeration of diverse technologies (HetNets) seems to be the viable way forward to 5G. Network operators are facing numerous challenges arising from the dense small deployment, high inter-cell interference being the primary culprit. De-ployment wise, network densification increases the total cost of ownership (TCO) which includes capital and operational expenditures (CAPEX, OPEX). As the average revenue per user (ARPU) remains virtually flat, network operators are
fearing a crisis situation where rising expenses may overcome the dwindling profit margins [2]. To aggravate things further, impromptu cell deployments by mobile users (MUs) render traditional cell planning strategies inept. The aforementioned idiosyncrasies of ultra-dense small cell networks call for a paradigm shift in network design.
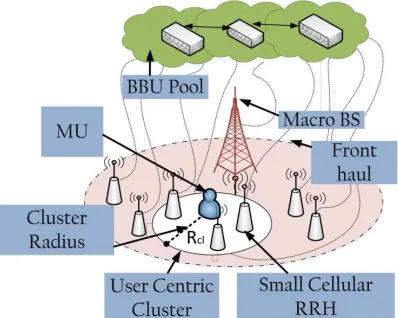
Certain promising disruptive 5G technologies such as mas-sive MIMO and mmWave are being considered for higher average user throughput in 5G. However, both of these tech-nologies, while offering higher network wide capacity, are likely to cost more in terms of energy efficiency and location-independent uniform user Quality of Experience (QoE). In this work, we investigate a User-centric Cloud Radio Access Net-work (UC-RAN) architecture that has the potential to address the aforementioned challenges. Conventional C-RAN allows centralizing and sharing of the baseband processing between several small cells in a virtual baseband processing unit (BBU) pool [3][4]. By separating baseband units from the radio access units, the C-RAN architecture: (i) reduces the capital and operational expenditure [4]; (ii) provides huge energy saving (due to centralized air-conditioning etc.) and (iii) provisions implementation of sophisticated coordination mechanisms for reducing the co-channel interference [5]. However, there is one key 5G requirement that conventional C-RAN still fails to address, i.e. QoE. In conventional C-RAN, the Quality of Service (QoS) varies significantly from cell center to cell edge, same way it does in legacy networks, leading to poor QoE. UC-RAN on the other hand has potential to virtually remove cell edges by shifting the pivot of the cell design from the base station (BS) to the mobile user (MU) [6] [7]. The key distinct feature of UC-RAN is that, a cell is built around a user and not around the RRH or BS as in current networks [8]. This enables dynamic coverage as well as higher gains at the user terminals through spatial diversity from having several RRHs available to serve a user [5], [9].
Fig. 1: UC-RAN architecture with activation disc of radius Rcl for a served user.
and propose a novel RRH clustering technique for designing efficient large scale UC-RANs. Furthermore, we present a game theoretic framework to trade-off between ASE and EE in dynamic fashion. This framework allows to retain a pareto-optimal performance while accommodating varying network load and operator’s priority between ASE and EE.
B. User-Centric C-RAN: Architectural Overview
With the assumption of ultra-dense RRH deployment, which is a plausible scenario in future networks, inter-cell interfer-ence and network management issues due to close BS-user spatial proximity become prominent. UC-RAN addresses these by provisioning demand based baseband processing to RRHs and seamless coverage to the users. In a UC-RAN architecture, the BBU pool turns ON the RRHs that are required to serve a desired user at a certain QoS. The dynamic clustering of RRHs allows users to be served seamlessly and provides uniform service experience regardless of user location and movement [5]. The user-centric cluster size serves as a proxy to the minimum spatial separation between an arbitrary user and its closest interfering RRH, thereby improving the average SINR at the user. Furthermore, contrary to the traditional small cell networks where the energy consumption and the handovers both increase with the density of the small cell RRHs, UC-RAN mitigates this problem by providing on demand cov-erage, i.e., by selectively turning ON as opposed to always turned ON RRHs. Additionally, the throughput gains provided by distributed diversity alleviate the overhead of cooperation. Fig.1 provides a graphical illustration of a UC-RAN with RRH clustering. The RRHs are connected to the pool of BBUs via flexible front haul. The front haul is usually an optical fiber where signaling is done using radio-over-fiber (RoF) or common public radio interface (CPRI). Most of the signal processing at baseband level is delegated to the BBUs. The RRH deployment is expected to be very high density by leveraging the existing infrastructure (e.g. street lamp posts, poles, side of buildings etc.). The key idea here is to dynamically select the best RRH (in terms of SIR) within a circular area (virtual cell) of pre-defined radius around selected
users (based on scheduling priority) during each scheduling interval. All other RRHs within the circle here after called cluster are kept OFF thereby minimizing the interference. The aforementioned UC-RAN architecture provides two-fold benefits: i) on-demand centralized processing at the BBU pools caters to non-uniform user traffic that subsequently enables OPEX reduction by as much as 30% [15], ii) user-centric RRH clustering reduces the number of nearby interfering RRHs and eliminates cell-edge coverage issues, hence improving the overall user experience.
C. Design Issues & Problem Statement
UC-RAN functions on resource pooling and virtual cell formation around scheduled users. The centralized user-centric RRH clustering not only reduces frequent handovers but also increases the signal-to-interference-plus-noise-ratio (SINR) that subsequently reduces the outage probability in dense networks. This in turn paves the way for increase in the system wide spectral efficiency. Additionally, selective RRH activation enables reduced power consumption, hence making the network more energy efficient. Effectively, the user-centric RRH clustering:
1) empowers UC-RAN to provide demand based coverage, i.e., the coverage can dynamically extend or shrink based on user density by intelligently switching RRHs ON/OFF;
2) enables energy savings as an RRH is only turned ON when required to serve a nearby user;
3) provides an efficient way to control the signal strength which is a function of RRH cluster size (through both the maximum path loss incurred and the number of serving RRHs providing selection diversity gain);
4) enables effective interference protection to an MU by inducing repulsion between RRH clusters (i.e., clusters are not allowed to overlap spatially which induces a natural guard-zone for a scheduled MU).
• What is the optimal RRH cluster size that maximizes a
key performance indicator of capacity, i.e., area spectral efficiency (ASE)?
• What is the cluster radius that yields optimal performance
in terms of energy efficiency (EE)?
• What parameters are crucial in defining the optimal
clus-ter sizes that maximize these system efficiencies (ASE, EE)? How sensitive are the efficiencies to variations in these parameters?
• Can we design a self-organizing framework to
dynami-cally adjust the user-centric RRH cluster size and trade between ASE and EE in UC-RAN to cope with the spatio-temporal variations in user traffic?
In this paper, we take the first step towards analytical treatment of the above mentioned design issues and answering the key research question at hand, i.e., what is the optimal cluster size around a scheduled user? Amongst recent works, studies in [5] and [9] are most relevant. However, our analysis differs in three key aspects: 1) [5] and [9] leverage user-centric architectures to optimize virtual cluster radius that maximizes the system capacity. On the other hand, we present a frame-work to simultaneously analyze ASE and EE in a UC-RAN. 2) Unlike [5] where the proposed clustering is overlapping (scenarios where a single RRH may simultaneously serve multiple MUs), our model builds on non-overlapping user-centric clusters resulting in a one-to-one RRH-MU association during a given time slot. 3) Contrary to analysis in prior studies, we take into account variations in user density. By employing principles from stochastic geometry to model the thinned user and RRH densities in a particular time slot, we analyze the overall system efficiency more accurately. This allows investigation of relationship between key design parameters such as path loss exponent and SINR threshold on ASE and EE for given user and RRH densities.
D. Contributions & Organization
The contribution of this work is six-fold:
1) First, we introduce the user-centric RRH clustering mechanism. Borrowing from well established tools in stochastic geometry [16], we formulate a spatial model for a UC-RAN under the proposed clustering mecha-nism (Section III). We then characterize the mean and variance for the average aggregate interference (Section IV) experienced by a scheduled MU in a large scale UC-RAN. Our analysis considers both the geometric uncertainty due to the randomness in topology and the channel uncertainty due to small-scale multi-path fading (see Section II).
2) We then derive a closed form expression for the lower bound on the link success (which also corresponds to the coverage probability) for a scheduled MU. The bound is employed to establish a lower-bound on the area spectral efficiency of the UC-RAN (Section IV).
3) Shifting our attention from the network level perfor-mance to the link level throughput, we consider the scenario where RRHs encode downlink (DL) transmis-sion at maximum supportable rate for a certain reliability
constraint. Under this consideration, we characterize the outage capacity of the scheduled MU under the proposed user-centric RRH clustering protocol. We then inves-tigate the scaling behavior of the per user throughput with respect to the density of RRH. It is shown that the aggregate interference contributes to a loss in the distributed diversity gain which is obtained by the RRH selection (see Section V).
4) We then proceed to explore the overhead associated with discovering the best RRH under the proposed protocol in terms of the power consumption (see Section VI). The formulated power consumption is employed with the link level throughput to study the energy efficiency of UC-RAN.
5) We employ the developed analytical framework to in-vestigate the design questions which were formulated in section IC. Specifically, we address the problems of optimal dimensioning of the cluster radius and selection of the RRH deployment density (Section VII). We investigate the impact of different parametric variations on these design issues and highlight the need for a self-organizing network (SON) features [17] to cope with the varying user densities. It is shown that there exists an optimal cluster radius which maximizes the energy efficiency of the network. However, such an optimal cluster size is not necessarily same as that which maximizes the area spectral efficiency. Consequently, there exists a trade-off between energy and area spectral efficiency of the UC-RAN.
6) Lastly, we model the inherent ASE-EE trade-off in UC-RANs through a bargaining problem [18] where the performance metrics are modeled as virtual game players and a Nash bargaining solution is found that corresponds to a unique optimal cluster radius for a given set of network parameters. Using an exponential weightage parameter in the optimization framework, we vary the bargaining powers of the players and show that the ASE-EE trade-off may be adjusted in real-time as a function of the network operator’s spatio-temporal revenue model which may include traffic intensity, time of the day and hotspot locations (e.g. cafes, stadiums) [19] (see Section VIII).
E. Notation
Throughout this paper we useEZ(.)to denote the expected value of a random variable Z. A particular value of random variable Z is denoted byz. The probability density function (PDF) of a random variablez is denoted byfZ(.). The bold
The symbol Z∼ U(a, b)is used to denote a random variable which takes values betweenaandbwith uniform probability. Similarly, Z∼ E(µ)is used to denote an exponential random variable with mean µ. The symbol 1(x > y) represents an indicator which is one if the condition (x > y) is satisfied and 0 otherwise.
II. NETWORK MODEL
A. Spatial Model of the Network
We consider a cloud radio access network under-laid within a large-scale cellular network. Both the small cell RRHs and MUs are assumed to be spatially distributed across the macrocells (see Fig. 1). The spatial distribution of the RRHs and the MUs is captured by two independent stationary Poisson point processes (SPPPs):ΠCLR∈R2andΠM U∈R2
with intensities λCLR and λU SR respectively. Specifically,
at an arbitrary time instant, the probability of finding ni ∈
N, i ∈ {RRH, M U} RRHs/MUs inside a typical macro-cell with area foot-print A ⊆ R2 follows the Poisson law with mean measureΛi(A) =λiv2(A). The mean measure is characterized by the average number of RRHs/MUs per unit area (i.e. λCLR and λU SR ) and the Lebesgue measure [16]
v2(A) =RAdxon R2, where if Ais a disc of radius rthen
v2(A) =πr2 is the area of the disc.
B. Channel Model
The channel between a UC-RAN RRH x ∈ ΠCLR and
an arbitrary MU y ∈ ΠM U is modeled by hxyl(||x−y||).
Here hxy ∈ E(1) is a unit mean exponential random variable
which captures the impact of a Rayleigh fading channel between an RRH and an MU. The small-scale Rayleigh fading is complemented by a large-scale path loss modeled by l(||x−y||) =K||x−y||−αpower-law function. Here||x−y||
is the distance betweenxandy,K is a frequency dependent constant and α ≥ 2 is an environment/terrain dependent path loss exponent. The fading channel gains are assumed to be mutually independent and identically distributed (i.i.d.). Without any loss of generality, we will assumeK= 1for the rest of this discussion. It is assumed that the communication is interference limited and hence the thermal noise is negligible. Furthermore, we assume that all RRHs employ the same transmit power PCLR.
III. USER-CENTRICCLUSTERING INUC-RAN In this article, we propose a user-centric clustering mech-anism for the UC-RANs. More specifically, we envision a scenario where out of the multitude of small cell RRHs deployed in close proximity of an intended MU, a single RRH that provides the best channel gain (and consequently the highest signal-to-interference ratio (SIR)) is activated to serve that MU. The proximity or neighborhood of an MU is characterized by the cluster radiusRcl. The proposed
user-centric clustering mechanism (Algorithm 1, Fig.2) yieldsΠ′
M U
and Π′
CLR which is the set of scheduled MUs and activated
RRHs during a particular time slot respectively.
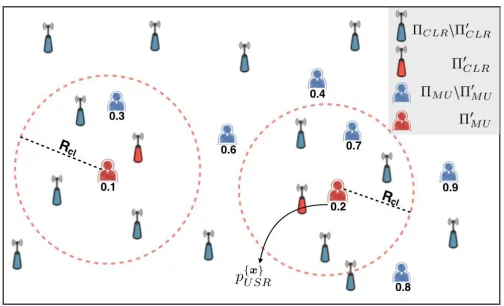
As specified by Algorithm 1, the macro-cell or the BBU data center assigns a mark/tag pU SR ∼ U(0,1) to each MU.
These marks correspond to the downlink scheduling priority of the MUs. More specifically, the lower the value of the mark, the higher is the priority of the user to be served by the RRHs. Effectively, these marks can be thought of as the timers corresponding to each MU which are decremented on each time slot where service to this MU is deferred. A MU is scheduled for a downlink transmission iff it has highest scheduling priority in its neighborhood. In other words, there is no other MU in a disc of radius Rcl centered at MU with
a higher priority. This round robin scheduling scheme ensures fair DL scheduling among MUs1. Notice that this disc also characterizes the size of the RRH cluster from which MU is being served. For a fixedRcl, the percentage of MUs served
in a given transmission time interval (TTI) is a function of relative RRH and MU PPP densities, i.e., ifλU SR>> λCLR,
the average wait time before an arbitrary MU is served will be longer as compared to the scenario with same order MU and RRH densities.
The activation of RRHs is coupled with the user-centric scheduling mechanism (Algorithm 1). Only the RRHs which lie in the neighborhood of the scheduled users and provide the best propagation channel gain to their respective MUs are activated by the macro base station (MBS) (or BBU pool). This implies that each scheduled MU has a set of nearby RRHs that defines its user-centric RRH cluster. From this cluster of RRHs, only one that yields the highest SINR at the user is activated. Consequentially, there is at max one activated RRH that lies within a user-centric circular disk of area πR2
cl. Effectively, activation of RRHs is on demand
basis which provides UC-RAN capability of self-organizing the coverage to cope with the spatio-temporal variations of the user demography.
One might argue that such a non overlapping user-centric clustering scheme may result in service holes, i.e. there may exist MUs that are not associated with any RRHs due to empty RRH clusters around those MUs. Since we are considering dense small cell deployments with comparable λCLR and
λU SR, user-centric RRH clusters with realisticRclwill hardly
be void. In the unlikely scenario of a void cluster though, user clustering strategies [20] may be employed where nearby MUs are grouped together and optimization is performed on the MU clusters rather than individual MUs2. Furthermore, it is known that best RRH activation with a proximity constraint provides dual benefits of low outage probability and high power efficiency in dense deployment scenarios [21].
IV. QUANTIFYING THEAREASPECTRALEFFICIENCY OF A
UC-RAN
In the previous section, we presented an outline of a user-centric clustering algorithm for a UC-RAN. As is obvious from the algorithm, the size of the cluster employed for scheduling is a critical system design parameter. Optimal dimensioning of theRcl is necessitated by the fact that:
1The case with MUs having non-uniform scheduling priorities will be
covered in future extensions of this work.
2In the interest of space, detailed discussion and evaluation of MU clusters
Fig. 2: User-centric RRH clustering in a UC-RAN. Each scheduled user is served by a single RRH in its respective cluster that maximizes its received SIR. The user-centric scheduling is based on p{U SRx} values with lower marks
cor-responding to high scheduling priorities.
Algorithm 1 User-centric clustering for C-RAN
Data:ΠM U,ΠCLR,Rcl
Result:Π′
M U,Π′CLR
Π′
M U←∅,Π′CLR←∅;
foreach x∈ΠM U do
FP RIO[x]← U(0,1)
end
foreach x∈ΠM U do
p{U SRx} ←FP RIO[x] p{
x}
SCH ←1 foreach y∈ΠM U do
if y6=xthen
if y∈b(x,2Rcl)and p{
y}
U SR> p
{x}
U SR then
p{SCHx} ←0
else
continue
end else
continue
end end
foreach r∈ΠCLR do
if r∈b(x, Rcl) andp{SCHx} == 1then
if hrxl(||r − x||) > hr′xl(||r′ − x||),∀r′ ∈
ΠCLR,r′∈b(x, Rcl),r′6=r then
Π′
CLR∪ {r}
end end end
if p{SCHx} == 1then
Π′
M U∪ {x}
end end
1) The cluster size determines the number of the active RRHs at any given time. In turn the density of active RRHs shapes the co-channel interference experienced by a scheduled MU.
2) The radius of the cluster, also characterizes the number
of concurrently scheduled MUs per unit area.
3) The dimensions of a cluster also determine the number of RRHs serving a scheduled MUs. This in turn de-termines the diversity gain experienced due to spatially distributed RRHs.
The area spectral efficiency of a UC-RAN network is strongly coupled with these three factors. In this section, our objective is two fold:
• To characterize the area spectral efficiency of a large scale
UC-RAN.
• To investigate the optimal dimensioning of the cluster
radius for maximizing the throughput potential of the UC-RAN.
A. Signal Model
Consider a scheduled user x∈Π′
M U. Let Scop(x, Rcl) =
Π′CLR ∩(x, Rcl) be the unique RRH which is fed by the
same BBU as x and selected to serve x on the basis of the scheduling criteria (Algorithm 1). Furthermore, let ΠI = Π′CLR\Scop(x, Rcl) be the set of RRHs which are
concurrently scheduled to serve y 6= x,∀y ∈ Π′
M U . In
this article, we assume that the UC-RAN employs the RRH selection to serve its intended MU. Under RRH selection trans-mission the received signal at xcan be written as (1), where maxi∈Scophixl(||x−i||)is the channel gain between the serv-ing RRH and the MU x,maxj∈Π′
CLR∩(y,Rcl)hxjl(||x−j||)
is the interference experienced atxdue to RRHjserving MU
y andsk is the message signal transmitted to MU k by its
selected RRH. PCLR is the transmit power employed by the
RRH andϕxis the additive white Gaussian noise (AWGN) at
the receiver front end3.
B. Probe Cluster
In order to characterize the area spectral efficiency of a UC-RAN, quantification of the success probability for a scheduled MU is essential. The key hurdle in characterizing the performance arises from the fact that unlikeΠM Uthe point
process of the scheduled usersΠ′
M Uis non-stationary. A closer
inspection ofΠ′
M U reveals that it is indeed a modified version
of a type II Matern hardcore process [16]. Fortunately, for such processes it is well established that they can be approximated by an equidense SPPP with appropriate modified intensity [22], [23]4. Consequently, Π′
M U can be approximated by a
SPPP with the intensity
λ{U SREF}=
1−exp(−4πλU SRR2cl)
4πR2
cl
. (2)
3We notice that even with the induced spatial repulsion between MUs which
consequently thins the PPPs of serving MUs and activated RRHs, the noise power at served MUs is negligible as compared to the aggregate interference. In other words, the network operates in a saturated conditions and the links are interference limited.
4This is validated by employing Ripley’s K function [16] for both PPPs. It
rx=
r
PCLR max
i∈Scop
hixl(||x−i||)sx+ X
y∈Π′
M U,y6=x
r
PCLR max
j∈Π′
CLR∩(y,Rcl)
hjxl(||x−j||)sy+ϕx. (1)
Notice that since the user-centric clusters are considered non over lapping, the minimum distance between any two user-centric clusters should be 2Rcl. Exploiting the stationary
characteristics of the resultant SPPP, it is sufficient to focus on a typical MU. According to Silvnyak’s theorem [16], the law of the SPPP does not change by addition of a single point. Hence we add a probe MU at origin. Moreover, the received signal (rx(o)) in Eq. (1) can now be simplified with
ri=||i−o||andry=||y−o||. For the sake of compactness,
we will drop the index o for the rest of the discussion (e.g., hio=hi).
C. Lower-bound on the Success Probability of Scheduled MU
From Eq. (1) the received SIR at the probe MU can be expressed as
SIR= ΓM U=
maxi∈Scophil(ri)
P
j∈ΠIhjl(rj)
. (3)
Notice that Scop is a function of the non-stationary Poisson
point processΠ′CLR.
Proposition 1 (Moments of Aggregate Interference).The mean and variance of the aggregate interference experienced by a typical MU during a user-centric algorithm can be approximated as follows
κ1=E(I) =
2πλCLR[1−exp(−[1−exp(−4πλU SRR2cl]/4)]
(α−2)(Rcl)α−2(λCLRπR2cl)
,
(4)
κ2=V(I) = πλCLR[1
−exp(−[1−exp(−4πλU SRR2cl]/4)]
(α−1)(Rcl)2(α−1)(λCLRπR2cl)
,
where λCLR is the density of the UC-RAN RRHs, α is the
path loss exponent andRcl is the radius of UC-RAN cluster.
Proof: Consider the SPPP ΠCLR, then under user-centric
clustering algorithm, for each scheduled user, only a single RRH which resides in the vicinity as well as provides max-imum channel gain to that user is activated by the macro-cell. A natural implication of this policy is that the resulting PPP Π′
CLR is non-stationary. However, like Π′M U it can be
approximated with an equivalent SPPP with modified density λCLR.pACT . HerepACT is the activation probability for the
RRH and can be computed as (5), where (a) follows from the fact that a BS is only activated if: i) there is a scheduled user within distance Rcl, and ii) there is no other BS within
this distance of that user that can provide better channel gain. Now noticing thatΠI = Π′CLR\Scop(o, Rcl), we can precisely
describe ΠI = Π′CLR\b(o, Rcl). Hence the mean and the
variance can be computed using Campbell’s theorem [16] as follows
κ1=E(I) =E
X
j∈Π′
CLR\b(o,Rcl)
hjl(rj)
,
= 2πλCLRpACT
Z ∞
R cl
E(H)r1−αdr,
(6)
and similarly
κ2= 2πλCLRpACT
Z ∞
R cl
E(H2)r1−2αdr. (7) SubstitutingE(H) =E(H2) = 1in the (6) and (7) concludes
the proof.
Remarks
1) From (4), we notice that the average aggregate interfer-ence experiinterfer-enced by an MU increases with an increase in the user density. For the fixed density of RRH, the only parameter that designer can adjust to compensate for the increase in the user density is to reduce the size of the cluster. While reducing the cluster size will increase the number of RRHs activated by accommodating more users, it also reduces the interference protection available to each MU link. More specifically, the small number of large clusters or large number of small clusters may lead to a similar co-channel interference environment. 2) The average interference experienced by an MU
de-creases with an increase in path loss. This follows from the fact that with an increase in path loss, signals atten-uate more rapidly and hence the aggregate interference power is reduced. However, the signal strength is also reduced for the same reason.
Proposition 2 (Link success probability for a scheduled MU). The link success probability of the probe MU served under the proposed user centric clustering and RRH selection scheme algorithm can be lower-bound as follows
Psuc(γth, R2cl)≥1−exp
−λCLRπδ
γδ thκδ1
γ(δ, γthκ1Rαcl)
, (8)
where γth is the MU’s desired SIR threshold, δ = α2 and
γ(a, b) =R0btα−1exp(−t)dtis the lower incomplete Gamma
function.
Proof: Consider the probe MU scheduled under the pro-posed clustering mechanism, the link success probability for this MU is given by
Psuc(γth, R2cl) =Pr{ΓM U> γth}, = 1−Pr{ΓM U≤γth},
= 1−EI[Pr{max
i∈Scop
hil(ri)≤Iγth}
| {z }
A1
pACT
(a)
= Pr[Π′M U∩b(r, Rcl)6=∅|r∈Π′CLR}.{hrl(rr)> hjl(rj)|j∈Π′CLR,j 6=r}],
= [1−Pr{Π′
M U∩b(r, Rcl) =∅|r∈Π′CLR}].Pr{hrl(rr)> hjl(rj)|j∈Π′CLR,j6=r},
=h1−exp(−λ{U SREF}πR2cl)
i
.(1/[λCLRπR2cl]),
=1−exp(−[1−exp(−4πλU SRR 2
cl]/4)
λCLRπR2cl
.
(5)
The term A1 = Pr{maxi∈Scophil(ri) ≤ Iγth} can be computed by noticing the fact the Scop is a SPPP inside a
finite area b(o, Rcl)and we can construct a Marked PPP by
assigning the fading marks to each i ∈ Scop 5. Additional
Bernoulli or indicator marks are assigned to the PPP such that the intensity of modified process6 can be expressed as
λS(r, h) =λCLR2πr1(hl(r)≥Iγth)fH(h). (10)
Now A1 can be computed by the void probability of the modified point process as
A1= exp
−
Z ∞
0
Z Rcl
0
λs(r, h)drdh
| {z }
Λs
, (11)
The mean measure Λs can be evaluated by
ΛS =λCLR2π
Z Rcl
0
Z ∞
0
r1(hl(r)≥Iγth)fH(h)drdh,
(a)
= λCLR2π
Z Rcl
0
rP r(h≥Iγthrα)dr,
=λCLR2π
Z Rcl
0
rexp(−Iγthrα)dr,
=λCLRπδ
γδ thIδ
γ(δ, γthIRαcl),
(12)
where (a) follows from the CDF of the exponential function. Employing (11) and (12), we obtain
Psuc(γth, R2cl) = 1−EI
exp
−λCLRπδ
γδ thIδ
γ(δ, γthIRclα)
,
(b)
≥1−exp
−λCLRπδ
γδ thκδ1
γ(δ, γthκ1Rαcl)
.
whereκ1=EI(I)from (4) and (b) follows from the Jensen’s
inequality.
The area spectral efficiency of the large scale UC-RAN is defined as the number of bits/s which can be transmitted over a unit Hertz bandwidth per second in the area of 1 square meter. In other words, the area spectral efficiency measures the amount of information that is flowing through a unit area
5A detailed discussion on the Marked PPP is beyond the scope of this
article. Interested readers should refer to [16].
6The modified intensity corresponds to the dependently thinned point
process.
when one Hertz of bandwidth is employed. The lower bound on the link success probability (which is equivalent to the coverage probability) can be employed to establish a lower bound on the area spectral efficiency of the UC-RAN as
TCLR=λ{U SREF}log2(1 +γth)Psuc(γth, R2cl), (13)
where λ{U SREF} is the effective density of the scheduled user defined in (2). As is clear from (13), the area spectral efficiency of the UC-RAN is strongly coupled with the cluster size. Intuitively, increasing the cluster size decreases the effective number of scheduled users. However it also increases both the SIR (due to lower number of nearby interfering RRHs) and the interference protection margin. Essentially, this implies that there exists an optimal radius for the cluster which will balance these two opposite effects to maximize the attainable area spectral efficiency.
V. OUTAGECAPACITY ANDIMPACT OFCO-CHANNEL
INTERFERENCE
Until now we have focused on the scenario, where each MU has a certain desired QoS requirement which is reflected in their desired SIR threshold. We have developed a statistical framework to quantify the area spectral efficiency of the large scale UC-RAN under the proposed user-centric clustering mechanism. The area spectral efficiency is the measure of network wide performance of the UC-RAN. Nevertheless, consider a scenario where instead of a fixed desired SIR threshold, the MU’s QoS is reflected by a reliability threshold ρwhich upper-bounds the downlink outage probability. Then, under such a constraint, the scheduled RRH can encode the transmission at a maximum rate Cρ for each MU. This rate
measures the spectral performance on the downlink for an arbitrary MU and is known as the outage capacity [24]. Notice that the outage capacity is a link level performance metric. In this section, our aim is to:
1) derive a closed form expression for the bounds on the outage capacity of the user centric UC-RAN;
2) establish the scaling laws for per user throughput with respect to the RRH density;
3) explore the loss in diversity due to aggregate interfer-ence.
A. Outage Capacity of the C-RAN Downlink
The outage capacity (Cρ) of the downlink between the probe
MU and its serving RRH is defined as
Cρ= sup{Co:Pout(co) = 1−Psuc(2Co−1, R2cl) ≤ρ}.
An upper-bound on the outage probability at a certain desired rate Co can be obtained from (8) as follows,
Pout(Co)≤exp
− λCLRπδ
((2Co−1)κ1)δγ(δ,(2
Co−1)κ 1Rαcl)
.
(15)
Proposition 3 (Outage-Capacity of the Interference limited MU Link).Theρ-outage capacity of the MU scheduled under the proposed scheme can be upper bounded as:
Cρ≤log2 1 +
λ1δ−1
CLR
¯
κ1ln(ρ−1)
1
δ
!
(bits/s/Hz) (16)
where
¯
κ1=2π(πΓ(1 +δ))
1
δ[1−exp(−[1−exp(−4πλU SRR2
cl)]/4)]
(α−2)(Rcl)α−2(λCLRπR2cl) .
Proof: The outage probability expression in (15) can be upper-bounded using the fact thatγ(δ, γthκ1Rclα)≤Γ(δ)7 to
give
Pout(Co)≤exp
− λCLRπδΓ(δ)
((2Co−1)κ1)δ
≤ρ, (17)
whereδΓ(δ) = Γ(δ+ 1). Bounding the outage probability by the desired reliability constraint and employing the definition in (14) along with some mathematical manipulations provides
an upper-bound onCρ.
In order to gain further insights, let us define the effective SIR under the proposed user centric scheme as
ΓICRAN =
λ
1
δ−1
CLR
¯
κ1ln(ρ−1)
1
δ
. (18)
The CI
ρ = log2(1 + ΓICRAN) is an increasing function of
ΓI
CRAN. Let us consider the case where each scheduled user
can be assigned a separate frequency band. Effectively, the transmissions are noise limited rather than interference limited. In order to characterize the impact of co-channel interference, we need to quantify Cρ for a noise limited user-centric
C-RAN.
B. Outage Capacity under Noise-limited Scenario
Proposition 4 (Outage Capacity of a Noise-limited MU Link).Theρ-outage capacity for a downlink MU transmission in a large scale interference free UC-RAN in the presence of additive white Gaussian noise at the receiver front-end is given by
CρN ≤log2 1 +
λ1δ
CLR
κ2ln(ρ−1)
1
δ
!
(bits/s/Hz), (19)
whereκ2= (πΓ(δ+ 1))
1
δP/σ2,σ2 is noise variance andP
is the transmit power employed by RRH.
Proof: The proof follows similar steps as in Proposition 3, with the only difference is thatκ1=E(I)should be replaced with σ2/P which can be interpreted as γ−1 =SNR−1, i.e., the SNR in the absence of fading and path loss.
7Notice that for the reasonable parametric value ofR
cl, the termRαclis large and hence the bound is tight.
Similar to the interference limited case, we can define the effective SNR as ΓN
CRAN =λ
1/δ
CLR/(κ2ln(ρ−1)1/δ). Compar-ingΓN
CRAN with theΓICRAN reveals the impact of co-channel
interference, as follows:
1) The power-gain obtained due to distributed diversity provided by the RRHs scales as O(λ1CLR/δ−1) for the interference limited scenario, while the scaling in the noise limited scenario followsO(λ1CLR/δ ).
2) The effective SIR for the interference limited scenario is independent of the transmit power. Consequently, the number of bits transmitted with the desired reliability threshold ρ per Hertz usage of bandwidth cannot be increased by increasing the transmit power. This is contrary to the noise-limited scenario.
VI. THECOST OFDIVERSITYGAIN: ENERGYEFFICIENCY
PERSPECTIVE
In previous sections, we focused on the spectral perfor-mance of the proposed UC-RAN. While the proposed user-centric mechanism exploits centralized processing in cloud to harness the distributed diversity gains, an important issue from network operator/designers perspective is the cost associated with these gains. More specifically, from an energy consump-tion perspective the cost-benefit analysis can be formulated in terms of energy efficiency. The network or link level energy efficiency characterizes the number of bits that can be transmitted per unit usage of available spectrum at the expense of one Joule in one second.
Due to a large spatio-temporal variance in user traffic, energy efficiency can be significantly improved in dense urban environment through efficient ON/OFF activation [25]. In order to quantify the energy consumption-throughput trade-off, our prime focus here is the energy consumption associated in discovering the best RRH for the association. To that end, we only focus on this additional energy which is required for the discovery purpose and can be considered as the overhead incurred for harnessing the diversity gain. Note that during the discovery process, each RRH is required to estimate the channel gain from the scheduled MU which comes at the expense of energy dissipation.
A. Power Consumption Model
The power consumption of a standalone RRH was in-vestigated in the project EARTH [26]. The proposed power consumption model provides accurate estimates of dissipated power in different building blocks such as antenna interface, cooling, power amplifiers and baseband processing. The model was extended by parameterization with the C-RAN efficiency in [27]. In this article, our primary interest is to compute the total power consumed in the discovery process in each user cluster. Thus, we propose a modified power consumption model which is inspired by [27] and [26]. Mathematically, the power consumption of the discovery process can be quantified as:
PCRAN =ωCRAN(M, θ)P0+ ∆uPu+Pou, (20)
wherePu is the transmit power employed by the MU, Po is
∆u is the radio frequency dependent component of power
consumption at the MU, ωCRAN(M, θ) is the the UC-RAN
coefficient andPouis the fixed circuit power consumed at the
MU. The UC-RAN coefficient is coupled with the number of RRHs in each cluster (denoted by M) and a parameterθwhich parameterizes the implementation efficiency. More specifically, ωCRAN(M, θ) ≤ M captures the performance gains due to
consolidated architecture of UC-RAN. The lower the value of ωCRAN(M, θ), the lesser is the amount of power dissipated
in each cluster. A simple parameterization of the efficiency coefficient from can be obtained as follows:
ωCRAN(M, θ) =θM, 0≤θ≤1 (21)
whereθ= 1 captures the least efficient UC-RAN implemen-tation. The mathematical expression for determining average number of RRHs in each cluster (M) is given in Lemma1.
Lemma I: The average number of RRHs within each user-centric cluster, i.e. M, is the complement of the void proba-bility of the RRHs, i.e. M = 1−e−λCLRπR2cl.
Proof:Consider thatΠCLRis an SPPP with intensityλCLR,
then under user-centric scheme, the average number of RRHs within a circular area of radius Rcl is given by λCLRπR2cl.
Since each user-centric cluster can have at most one RRH, the average number of RRHs is the complement of the probability that an arbitrary cluster would at least one RRH within its foot-prints, i.e.
M=Pr{ΠCLR∩b(x, Rcl)6=∅|x∈Π′M U},
= 1−Pr{ΠCLR∩b(x, Rcl) =∅|x∈Π′M U},
= 1−exp{−πλCLRR2cl}.
The average power consumption of each cluster can then be written as
PCRAN =ωCRAN(1−exp{−πλCLRRcl2}, θ)Po+∆uPu+Pou.
(22) Notice that in this analysis we are mainly focusing on the power consumed at MU for re-broadcasting the pilot signal and the power consumed at RRHs to estimate channel from this pilot. We do not consider the power consumption at macro BS for initial transmission of pilot signal, since this cannot be regarded as an energy overhead. Such transmission is part of the macro BS operation even in the traditional cellular networks.
B. Energy Efficiency
The network wide average energy efficiency is defined to be as the ratio of sustainable throughput for each scheduled MU and the average power consumption times the number of scheduled users. Mathematically
ηEE=
Blog2(1 + ΓICRAN)
ωCRAN(1−exp[−λCLRπR2cl], θ)Po+ ∆uPu+Pou
,
(23) where B is the employed bandwidth (assumed unity for sub-sequent discussion) and ΓI
CRAN is the effective SIR defined
in (18).
Remarks:
1) The per user throughput scales asO(λ1CLR/δ−1)while the average power consumption of each cluster involved in discovery process scales asO(1−e−λCLR). This implies that both the user throughput and the power consumption are increasing functions of the RRH density. However, as λCLR increases, the power consumption quickly
saturates to Po+ ∆uPu+Pou asωCRAN(M, θ)→1.
2) Similar to RRH density, it is obvious that the throughput and power consumption are monotonically increasing functions of the cluster radius (Rcl). Due to the
satu-ration of the power consumption though, the optimal cluster radius which maximizes the energy efficiency of the UC-RAN would be the maximum possible cluster size as per network operator’s design specifications. 3) These two observations lead to an important design
question, i.e., how different the EE-optimal cluster size is as compared to the cluster radius which maximizes the network wide area spectral efficiency? Also, since an energy efficient design would prefer a larger cluster size comprising on the area spectral efficiency, is there a way to work out a balance between these two parameters. The rest of our discussion will be formed across this design issue.
VII. RESULTS ANDDISCUSSION
In this section, we discuss how the efficiency parameters ASE and EE are impacted by variations in user activity, deployment density and propagation environment. For ease of understanding, we denote the RRH cluster radii that maximize the ASE and EE in (13) and (23) asR∗
clandR∗cl,eerespectively.
A. Optimal Cluster Radius for ASE
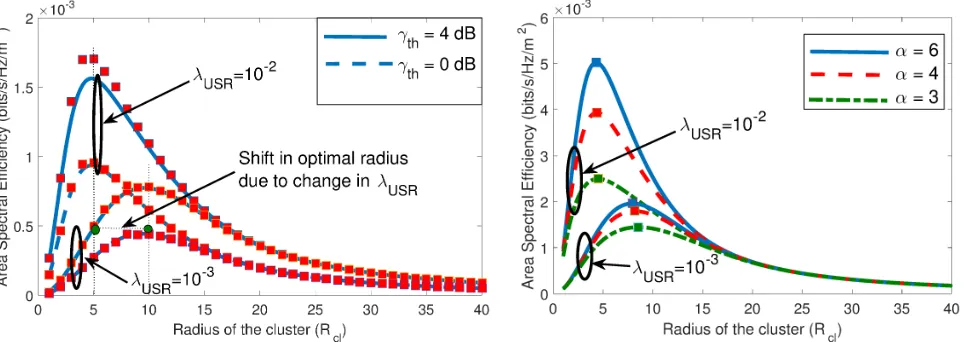
Fig. 3 depicts the impact of different parametric variations on the area spectral efficiency of the UC-RAN. The solid lines correspond to the simulation of analytical expressions obtained in the previous section. Furthermore, the curves with ”” markers are obtained by performing Monte-Carlo simulations. The Monte-Carlo simulations employed 104 realizations of spatial and channel variations for each value of Rcl at a
desired SIR threshold γth for each parametric value of the
user density λU SR. As shown in Fig. 3a, the lower-bound
established in the previous sub-section is indeed extremely tight for all parametric variations.
Fig. 3a consolidates the observation which followed from (13), i.e., there exists an optimal cluster size which maximizes the area spectral efficiency of the UC-RAN. As indicated by Fig. 3a, the optimal cluster radius, R∗
cl, is not very sensitive
to the changes in the desired SIR threshold. The impact of user density λU SR on the R∗cl is more pronounced as
compared to the SIR threshold. With an increase inλU SR, the
can be established from the expression derived in the previous subsection. Such SON mechanism can be easily implemented on the BBU data centers or macro BS. At this juncture, it is worth highlighting that the SON algorithm will require the estimates of the path loss exponent and the user density. The estimation error in these parameters can lead to sub-optimal selection of the cluster radius, incurring significant penalty in terms of spectral efficiency.
Fig. 3b shows that the optimal cluster radius (R∗
cl) increases
with an increase in the path loss exponent (α). Intuitively, a higher path loss exponent implies that the aggregate inter-ference power is reduced. However the signal power is also reduced. To compensate for the signal power reduction, the cluster size can be increased to harness the spatial diversity gain for increasing the effective received power. It is clear from Fig. 3b that the ASE is an increasing function of αfor a fixed cluster size.
B. Optimal RRH density for maximizing ASE
Besides optimal selection of the cluster radius, from a network designer’s perspective it is important to estimate the density of RRHs required to satisfy a certain desired QoS requirement. Fig. 4 plots the UC-RAN area spectral efficiency against the varying RRH density and cluster size.
From Fig. 4, we can see that for a certain fixed cluster radius, the ASE increases with an increase in RRH density. This is naturally the consequence of the increased probability of presence of RRH within the user-centric clusters due to an increase in the RRH density. Notice that the density of RRH also impacts the optimal cluster size. Consequently, both the optimal radius which maximizes the ASE and the RRH density should be jointly selected to reap the full potential of UC-RAN.
As shown in the previous subsection, the optimal cluster radius is also a function of the user density. Hence from a SON perspective, the cluster radius must be adapted with any change in user density for a certain fixed RRH density. However, the RRH density at the selected cluster radius may not be optimal. This motivates the design where a certain density of the RRH is deployed as a baseline design. These RRHs can be turned ON/OFF depending on the density requirement. The SON algorithm then tracks the changes in the user density and optimizes the area spectral efficiency by re-configuring both the density of the RRHs and the optimal cluster radius.
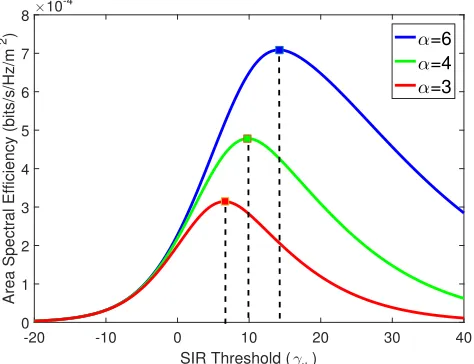
C. Optimal SIR threshold for maximizing ASE
From (13), it is obvious that there exists an optimal SIR threshold which maximizes the area spectral efficiency of the UC-RAN. This follows from the fact that the link rate is a logarithmically increasing function of the SIR threshold (log2(1 +γth)) while the success probability is exponentially
decreasing in terms of γth. Consequently both these effects
[image:11.612.345.528.82.179.2]should balance out at a certain SIR threshold which will maximize the area spectral efficiency of the C-RAN. Notice that the rate at which the link success probability decreases
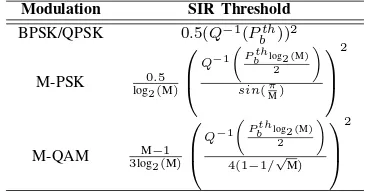
TABLE I: Selection of SIR threshold γth for fixed BEP
thresholdPth b
Modulation SIR Threshold
BPSK/QPSK 0.5(Q−1(Pth
b ))2
M-PSK log0.5
2(M)
Q−1 P thb log2 (M) 2
!
sin(πM)
2
M-QAM M−1
3log2(M)
Q−1 P thb log2 (M) 2
!
4(1−1/ √
M)
2
depends on the path loss exponent α(through the term γδ th).
Hence the optimal SIR is coupled with the path loss exponent. Fig. 5 plots the area spectral efficiency curve of the UC-RAN with a varying SIR threshold when an optimal cluster radius is employed, i.e., Rcl = R∗cl. It corroborates our
argument about the existence of an optimal SIR threshold which maximizes the spectral performance and its dependence on the path loss exponent. Consider a scenario where each UC-RAN user’s QoS is determined by the maximum supportable rate subject to a certain bit error probability (BEP) experienced at a downlink. BEP of an arbitrary user is further coupled with the employed modulation scheme. Consequently, for a certain desired BEP threshold, the corresponding SIR threshold can be determined from the BEP expressions of the modulation scheme.
Table I summarizes the relation between the SIR threshold (γth) and desired BEP (Pbth) for M-PSK and M-QAM schemes
[28]. From a SON perspective, the optimal SIR threshold is coupled with the user density, cluster radius and density of the RRHs. Hence the SIR threshold or equivalently the modulation scheme must be adapted to cater for changes in these parameters. Effectively, this indicates the necessity of rate adaptation (by adapting value of the modulation index M for M-PSK/QAM) to maximize the attainable spectral performance at a certain BEP.
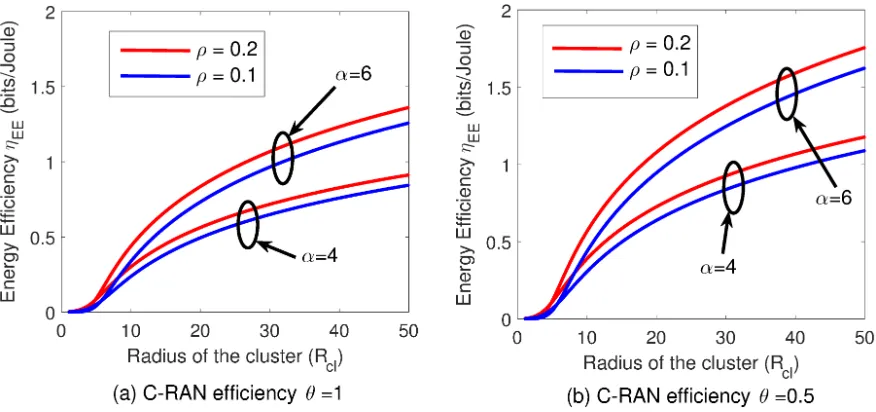
D. Optimal Cluster Radius for Energy Efficiency
Fig. 6 depicts the energy efficiency of the UC-RAN with varying cluster radii for the power consumption parameters summarized in Table II. As shown in Fig. 6, the energy efficiency is maximized by selecting Rcl as large as
possi-ble. However, the area spectral efficiency is maximized by selecting a lower ASE-optimal R∗
cl. Hence there exists a
trade-off between maximizing ηEE andTCLR.R∗cl,ee > R∗cl
implies that in order to maximize the energy efficiency, the area spectral efficiency must be sacrificed. The reason for this disparity in optimal cluster sizes can be attributed to the fact that ηEE scales differently, as compared to TCLR,
with respect to Rcl. Hence the optimal cluster radii with
(a) Area spectral efficiency of the UC-RAN with varying cluster radius, desired SIR threshold and user density forλCLR = 5×
10−3 andα= 4.
[image:12.612.61.543.57.228.2](b) Area spectral efficiency of the UC-RAN with varying path loss exponent and user density forλCLR= 10−2 andγth= 10dB.
Fig. 3: Impact of Parametric variations on the area spectral efficiency of the UC-RAN. The red markers in (a) correspond to the Monte-carlo simulation results.
(a) Area spectral efficiency of the UC-RAN with λU SR= 10−3,
α= 4andγth= 0dB.
[image:12.612.53.546.310.490.2](b) Area spectral efficiency of the UC-RAN withλU SR= 10−2,α= 4 andγth= 0dB.
Fig. 4: Area spectral efficiency of the UC-RAN with varying cluster radius and RRH density.
should be selected. On the other hand, if minimizing energy consumption across the network is the main objective, some throughput can be sacrificed by selecting an optimal cluster radius from the energy efficiency analysis. It is feasible for the operator to define different modes of operation, i.e., the energy efficient mode (for instance at night time) and the throughput efficient mode (for instance in day time) as proposed in [19]. The SON engine can then configure the optimal cluster radius in accordance with the desired mode.
Another observation from Fig.6 is the down scaling of ηEE under high θ values. This is due to the fact that
ωCRAN(M, θ) ≈ θ in (23) for Rcl ≥ 5 m and the range
of RRH densities considered for this work. The insensitivity of ωCRAN(M, θ) with respect to Rcl andλCLR allows high
θ values to increase the power consumption and consequently
TABLE II: Power Consumption Parameters
Parameter Description Value
Pu Transmit power of MU 1 W
Po Fixed Power consumption of RRH 6.8 W ∆u Radio Frequency dependent power consumption 4 W Pou Circuit power consumed at MU during discovery 4.3 W
decrease ηEE.
E. QoE Performance Analysis in a UC-RAN
Users’ QoE analysis is conducted through SINR distribution between MUs in an LTE like simulation tool with network parameters: λU SR = 10−2/m2, λCLR = 10−3/m2, α=4,
θ = 0.5, γth = 4 dB and bandwidth B=1 Hz. Both the
-20 -10 0 10 20 30 40 SIR Threshold (γth)
0 1 2 3 4 5 6 7 8
Area Spectral Efficiency (bits/s/Hz/m
2 ) ×10-4
α=6
α=4
[image:13.612.57.294.59.241.2]α=3
Fig. 5: Area spectral efficiency of the UC-RAN with varying desired SIR threshold with user density λU SR = 10−2,
λCLR = 10−3 andRcl=R∗cl.
simulations. We use two variants of the proposed user-centric approach: i) RRH cluster size deployment that maximizes ASE henceforth referred as UC(ASE), and ii) cluster size deployment that maximizes EE henceforth referred as UC(EE). To compare the performance with a standard non user-centric PPP deployment, we follow the approach in [29] and represent it as NUC. Results in Fig.7 show that even with the most data throughput efficient user-centric design, we obtain a SINR gain of over 20 dB for almost 50% of the users. The ruggedness in the CDF graph of UC(EE) in comparison to the other two CDFs is because of lower number of users in the thinned PPP Π′M U which is a direct consequence of the larger cluster sizes
in EE optimization. The 5 percentile SINR performance (for the cell-edge users with worst SINR in conventional networks) is also significantly improved for user-centric approaches with about 20 dB and 40 dB gain in UC(ASE) and UC(EE) respectively. Clearly, these results indicate that the user-centric approach eliminates cell-edge degradation and guaranteed high QoE for every user regardless of its physical location.
F. Efficiency performance evaluation of selective user-centric RRH Activation in a UC-RAN
Fig. 8 compares the system wide ASE and EE of the user-centric approaches with the baseline scheme at different RRH densities and λU SR = 10−2/m2,α=4,θ = 0.5 andγth = 4
dB. Fig. 8a reveals that as the RRH deployment density increases, UC(ASE) emerges as the most data efficient scheme. While NUC exhibits uniform ASE, UC(ASE) by virtue of increased Psuc exhibits highest system capacity. On the other hand, UC(EE), though not throughput efficient by any regards, yields more than 5 times power efficient network as compared to NUC approach (Fig. 8b). This observation highlights the inherent performance trade-off when the optimal cluster radius is adjusted according to objective function, i.e. when cluster size varies from R∗
cl toR∗cl,ee for maximizing theTCLR and
ηEE respectively.
VIII. SON FRAMEWORK FORRRH CLUSTERSIZE
OPTIMIZATION
Hitherto, we have demonstrated the superior efficiency per-formance in a UC-RAN with the user-centric RRH clustering. We also observed that the performance measures, i.e. ASE and EE require disparate RRH cluster sizes when maximized individually. Therefore, the key question of what should the optimal RRH cluster size be from a network design perspective remains unanswered. To address this research problem, we formulate a SON framework based on a two player cooperative bargaining game to investigate the cluster size estimation in a dynamic environment from the perspective of modeling the optimal trade-off between system wide ASE and EE. Both ASE and EE are modelled as virtual game players that inde-pendently estimate the best cluster size for maximizing their respective utility functions given by (13) and (23) respectively. In section VII, we observed the large dissimilarity in cluster size preferences of the players. However, both players can mutually benefit through the cooperative game where they negotiate for theRcl that achieves optimal ASE-EE trade-off.
Using Nashs axiomatic model, it is well known that the Nash bargaining solution (NBS) achieves a pareto-optimal solution, i.e. the optimal trade-off in the utilities of the players in such cooperative games [18].
LetN={1,2}be the set of the players, where playeri= 1 denotes ASE (or TCLR), player i = 2 denotes EE (or ηEE)
and Si denotes the set of all feasible payoffs to an arbitrary
MUi as
Si={Ui|Ui =Ui(Rcl), Rcl∈R:Rcl>0}. (24)
The achievable utilities for our virtual players can be repre-sented by the spaceS which is the set of all feasible payoffs that players i ∈N can achieve as they cooperate for cluster radius selection, i.e.
S={U = (u1, u2)|u1∈S1, u2∈S2}, (25)
where u1(x1) is the utility of the first player and u2(x2) is the utility of the second player such that
s1 = u1(x1) = [TCLR(Rcl)]β, (26)
s2 = u2(x2) = [ηEE(Rcl)]1−β (27)
and x1 = x2 = Rcl ∈ R : Rcl > 0. β ∈ [0,1] is the
exponential bias factor in the NBS that defines the bargaining power (or the trade-off) division between the two players. We also define the disagreement space D ∈ S as the set of the two disagreement points d = (d1, d2) where d1 = u1(D) andd2 =u2(D) represent the payoffs for each player if the bargaining process fails and no outcome is reached. For our game, we set d = (0,0) thus giving both players uniform leeway to improve their utilities. Analysis in [30] has shown that the optimal trade-off in such parametric cooperative games can be obtained via Nash’s axiomatic approach through the solution of a convex optimization problem which for our model can be given by (28), where PCRAN is the average
Fig. 6: Energy Efficiency of the UC-RAN with varying cluster radius forλCLR= 10−1 andλU SR= 10−2.
-40 -20 0 20 40 60 80
SINR (dB)
0 0.2 0.4 0.6 0.8 1
cdf
UC(ASE) UC(EE) NUC
Fig. 7: Downlink SINR CDF comparison between user-centric and non user-centric approaches
solution (Nash equilibrium) that maximizes the Nash product in (28).
Notice that the computational complexity of the SON op-timization problem in (28) for determination of Roptcl is a function of the cluster size granularity, i.e. O(NCLR) where
NCLR denotes the number of distinct cluster sizes over which
the optimization in (28) is performed. Since processing times are independent of MU or RRH densities, the optimal RRH cluster size estimation and subsequent deployment of user-centric scheduling through selective RRH activation is practi-cally realizable and scalable throughout the network. Similar to other SON solutions [31] [32], the proposed optimization framework can be implemented in centralized BBU pools for dynamic adjustment of Roptcl with variation in network statistics and operator’s preference (β).
A. Simulation Results for SON Optimization Framework in a UC-RAN
In this part of the paper, we will analyze and discuss the simulation results for determining the optimal cluster radii as network parameters and the exponential weightage parameter β fluctuate. We also look at the scheduling probability for an arbitrary MU under the RRH clustering mechanism explained in Algorithm 1. For simulation, we consider a two tier HetNet with a tri-sector hexagonal MBS of radius 500 m. We consider a single sector of the MBS covering an area of 73850 m2 where MUs and small cell RRHs are uniformly distributed according to their independent SPPPs. Without loss of gen-erality, the channel power gains between all MUs and RRHs are assumed unity. We assume uniform transmit power of 30 dBm for all RRHs. Other power consumption parameters are taken from table II. Simulation results are averaged over 1000 Monte Carlo trials.
1) Impact of network parameters and β on ASE, EE in a UC-RAN: Simulation results in Fig.9 depict how λCLR
and θ impact the utilities of the virtual players with a set of exponential biases β = [0,0.5,1] which denote the ASE-optimal, non-biased NBS and EE-optimal modes respectively. The results in Fig. 9 consolidate the established fact that there exist different cluster sizes that maximize the ASE and EE of the UC-RAN. As we would expect, the ASE is higher for dense RRH deployment and insensitive to θ. A non-biased (β= 0.5) trade-off yields mean losses of 89.5% and 62.5% to the utility functions output as compared to peak ASE (β= 1) and EE (β = 0) values respectively. Through appropriate β adjustment, the optimization framework yields an Roptcl between 5 m and 100 m (or the maximum allowable cluster size). Consequently, this allows the network operator to adjust the ASE and EE gains by 100x and 1000x respectively. Note that any gain in one efficiency parameter is accompanied by some degradation in the other.
[image:14.612.65.287.299.487.2]0 0.02 0.04 0.06 0.08 0.1
CLR 0
0.01 0.02 0.03 0.04 0.05 0.06
ASE (bits/s/Hz/m
2
)
UC(ASE)
UC(EE)
NUC
0 0.02 0.04 0.06 0.08 0.1 CLR
0.5 1 1.5 2
EE (bits/s/J)
UC(ASE)
UC(EE)
NUC
(b)
(a)
Fig. 8: (a) ASE and (b) EE comparison of UC(ASE), UC(EE) and NUC approaches with different RRH densities
Roptcl = max
Rcl
"
λ{U SREF}log2(1 +γth)Psuc(γth, R2cl)
βlog
2(1 + ΓICRAN)
PCRAN
1−β#
[image:15.612.82.524.76.268.2]. (28)
Fig. 9: ASE and EE v/s Rcl when varying theλCLR andθ. The optimal RRH cluster size Roptcl for each use case is shown
separately atβ values of 0, 0.5 and 1 and denoted by,⋆andrespectively.
number of concurrent DL transmissions between RRHs and MUs. We also notice significant reduction in Roptcl as λCLR
increases particularly atβ = 0.5. Since in actual networks, the cluster density may dynamically vary over time, a SON placed within the centralized BBU pools can dynamically expand or shrink the RRH cluster sizes to maximize the utility in (28).
B. Scheduling rate under varyingλCLR/λU SR
In order to study the impact of dense RRH deployment, Fig. 10 depicts the mean scheduling success rate for the MUs under different β and deployment density (λCLR
λU SR) scenarios. For each scenario, we simulate 1000 consecutive transmission time intervals (TTIs) forλU SR= 4x10⁻⁴. Using user-centric
RRH clustering (Section II), we update the pU SR and RRH
clusters for each TTI which allows us to estimate the mean number of MUs that are scheduled for DL transmission under each simulation scenario. The results in Fig. 10 show rapid increase in the scheduling probability as we move towards ASE regime. However, we notice that as RRH deployment density increases toλU SR/2, the scheduling success doubles
to 48% as compared to 24% in case ofλU SR/4andλU SR/8
[image:15.612.63.558.295.529.2]Fig. 10: Mean scheduling success rate versusβunder different λCLR/λU SR.
IX. CONCLUSION
In this article, we developed a comprehensive statistical framework for computation of the area spectral and energy efficiency of a large-scale user-centric cloud radio access network (UC-RAN). We proposed a user-centric RRH clus-tering algorithm which enables dynamic coverage extension and shrinkage by activating a single remote radio head within a specified demarcation around a scheduled user based on max SIR gain criteria. The user-centric architecture ensures uniform coverage and no cell-edge degradation for all the users irrespective of their physical location.We demonstrated that there exists an optimal cluster radius which maximizes the area spectral efficiency of the UC-RAN. It was also demonstrated that this optimal cluster radius is coupled with the user density and hence must be adapted by a self-organization mechanism. The link level performance was then employed to perform cost-benefit analysis of the proposed protocol. More specifi-cally, the amount of power dissipated in the association process under the proposed protocol is considered as the cost of obtaining the throughput gains. The throughput-cost ratio is hence essentially the energy efficiency of the UC-RAN. It was shown that there exists another optimal cluster radius which maximizes the energy efficiency of the UC-RAN. However, this is larger to the one obtained under area spectral efficiency criterion. Consequently, the throughput-energy consumption trade-off manifests itself in terms of dimensioning of the cluster radius in UC-RAN. Using a game theoretic framework, we demonstrated that a SON engine within the centralized BBU pools may be employed to dynamically configure the optimal cluster size. Simulation results indicated that: i) the SON mechanism allows more than 100x efficiency variation through real-time adjustment in the NBS bias parameter, ii) in comparison to current always-ON RRH deployments, selective RRH activation in UC-RAN offers high area spectral and energy efficiency gains, particularly whenλCLR> λU SR, and
iii) significant SINR gains can be realized in both ASE and EE operating modes by virtue of interference-free RRH cluster zones around each scheduled user.
ACKNOWLEDGEMENT
This material is based upon work supported by the National Science Foundation under Grant Numbers 1619346, 1559483, 1718956 and 1730650. For more details about these projects, please visit www.bsonlab.com. A portion of this work has been accepted for presentation at IEEE International Conference on Communications (ICC) 2018.
REFERENCES
[1] CISCO, “Cisco visual networking index: Mobile data traffic forecast update, 2013 to 2018,”San Jose, CA, USA, 2014.
[2] J. Research, “Press release: Mobile network op-erator revenues,” June 2011. [Online]. Available: http://juniperresearch.com/viewpressrelease.php?pr=245
[3] R. Wang, H. Hu, and X. Yang, “Potentials and Challenges of C-RAN Supporting Multi-RATs Toward 5G Mobile Networks,” IEEE Access, vol. 2, pp. 1187–1195, 2014.
[4] A. Checko, H. L. Christiansen, Y. Yan, L. Scolari, G. Kardaras, M. S. Berger, and L. Dittmann, “Cloud RAN for Mobile Networks: A Tech-nology Overview,”IEEE Communications Surveys Tutorials, no. 1, pp. 405–426, Firstquarter 2014.
[5] Y. Zhang and Y. J. Zhang, “User-centric virtual cell design for Cloud Radio Access Networks,” in Signal Processing Advances in Wireless Communications (SPAWC), 2014 IEEE 15th International Workshop on, June 2014, pp. 249–253.
[6] S. Chen, F. Qin, B. Hu, X. Li, and Z. Chen, “User-centric ultra-dense networks for 5G: challenges, methodologies, and directions,” IEEE Wireless Communications, vol. 23, no. 2, pp. 78–85, April 2016. [7] D. Huang, T. Xing, and H. Wu, “Mobile cloud computing service
models: a user-centric approach,” Network, IEEE, vol. 27, no. 5, pp. 6–11, September 2013.
[8] S. Zaidi, S. Affes, U. Vilaipornsawai, L. Zhang, and P. Zhu, “Wireless Access Virtualization Strategies for Future User-Centric 5G Networks,” in2016 IEEE Globecom Workshops (GC Wkshps), Dec 2016, pp. 1–7. [9] S. Zaidi, A. Imran, D. McLernon, and M. Ghogho, “Characterizing Coverage and Downlink Throughput of Cloud Empowered HetNets,”
Communications Letters, IEEE, vol. PP, no. 99, pp. 1–1, 2015. [10] B. Dai and W. Yu, “Sparse Beamforming and User-Centric Clustering
for Downlink Cloud Radio Access Network,”IEEE Access, vol. 2, pp. 1326–1339, 2014.
[11] H. Zhang, Z. Yang, Y. Liu, and X. Zhang, “Power Control for 5G User-Centric Network: Performance Analysis and Design Insight,”IEEE Access, vol. 4, pp. 7347–7355, 2016.
[12] C. Li, J. Zhang, M. Haenggi, and K. B. Letaief, “User-Centric Intercell Interference Nulling for Downlink Small Cell Networks,”IEEE Trans-actions on Communications, vol. 63, no. 4, pp. 1419–1431, April 2015. [13] A. Awad, A. Mohamed, and C. F. Chiasserini, “Dynamic Network Selection in Heterogeneous Wireless Networks: A user-centric scheme for improved delivery,” IEEE Consumer Electronics Magazine, vol. 6, no. 1, pp. 53–60, Jan 2017.
[14] S. Bassoy, M. Jaber, M. A. Imran, and P. Xiao, “Load Aware Self-Organising User-Centric Dynamic CoMP Clustering for 5G Networks,”
IEEE Access, vol. 4, pp. 2895–2906, 2016.
[15] C. Mobile, “C-RAN: the road towards green RANs,”White Paper, ver, vol. 2, 2011.
[16] J. M. D. Stoyan, W. S. Kendall and L. Ruschendorf,Stochastic geometry and its applications. Wiley Chichester, 1995, vol. 2.
[17] O. Aliu, A. Imran, M. Imran, and B. Evans, “A Survey of Self Organisation in Future Cellular Networks,” Communications Surveys Tutorials, IEEE, vol. 15, no. 1, pp. 336–361, First 2013.
[18] Z. Han, D. Niyato, W. Saad, T. Baar, and A. Hjrungnes,Game Theory in Wireless and Communication Networks: Theory, Models, and Appli-cations. Cambridge University Press, 2012.
[19] A. Imran, M. Imran, and R. Tafazolli, “A novel Self Organizing framework for adaptive Frequency Reuse and Deployment in future cel-lular networks,” inPersonal Indoor and Mobile Radio Communications (PIMRC), 2010 IEEE 21st International Symposium on, Sept 2010, pp. 2354–2359.