This is a repository copy of The benefits of sequential testing: Improved diagnostic accuracy and better outcomes for failing students.
White Rose Research Online URL for this paper: http://eprints.whiterose.ac.uk/123870/
Version: Accepted Version
Article:
Homer, MS orcid.org/0000-0002-1161-5938, Fuller, R and Pell, G (2018) The benefits of sequential testing: Improved diagnostic accuracy and better outcomes for failing students. Medical Teacher, 40 (3). pp. 275-284. ISSN 0142-159X
https://doi.org/10.1080/0142159X.2017.1404561
© 2017 Informa UK Limited, trading as Taylor & Francis Group. This is an Accepted
Manuscript of an article published by Taylor & Francis in Medical Teacher on 24 Nov 2017, available online: http://www.tandfonline.com/10.1080/0142159X.2017.1404561. Uploaded in accordance with the publisher's self-archiving policy.
[email protected] https://eprints.whiterose.ac.uk/
Reuse
Items deposited in White Rose Research Online are protected by copyright, with all rights reserved unless indicated otherwise. They may be downloaded and/or printed for private study, or other acts as permitted by national copyright laws. The publisher or other rights holders may allow further reproduction and re-use of the full text version. This is indicated by the licence information on the White Rose Research Online record for the item.
Takedown
If you consider content in White Rose Research Online to be in breach of UK law, please notify us by
Page 1 of 35
The benefits of sequential testing: improved diagnostic accuracy
and better outcomes for failing students
Matt Homer, Richard Fuller and Godfrey Pell
Leeds Institute of Medical Education School of Medicine,
University of Leeds Leeds LS2 9JT
0113 343 4303
Short title
The benefits of sequential testing.
Abstract
Introduction
In recent decades, there has been a move towards standardised models of assessment where all students sit the same test (e.g. OSCE). By contrast, in a sequential test the examination is in two parts, a ‘screening’ test (S1) that all
Page 2 of 35
Methods
Using recent undergraduate knowledge and performance data, we compare S1
‘decisions’ to S2 overall pass/fail decisions to assess diagnostic accuracy in a sequential model. We also evaluate the longitudinal performance of failing students using changes in percentile ranks over a full repeated year.
Findings
We find a small but important improvement in diagnostic accuracy under a
sequential model (of the order 2- 4% of students misclassified under a traditional model). Further, after a resit year, weaker students’ rankings relative to their peers improve by 20 to 30 percentile points.
Discussion
Page 3 of 35
Introduction
The past 20 years have seen the establishment of ‘assessment massification’ in
healthcare education, through the growth of standardised test models where all candidates take the same test, often at the same time. This move to large scale, outcomes based testing has generated established benefits for learners, faculty, testing institutions and patients (American Educational Research Association, 2014). In major knowledge and performance test formats (Single Best Answer questions (SBA) and the Objective Structured Clinical Examination (OSCE)), pass and
promotion/progression decisions are typically based on the outcomes of these large scale, competency-based tests (Cizek and Bunch, 2007; Harden et al., 2015;
Patrício et al., 2013; Case and Swanson, 2001). Wide sampling across multiple stations/items coupled with structured/standardised designs is argued to generate sufficient measures of whole test and station/item level quality that then support robust and defensible high stakes decision-making (Pell et al., 2010; Pell et al., 2015; Fuller et al., 2013).
Alongside these significant advances in assessment design, practice and implementation, there is growing body of literature that explores the problems associated with our existing single test models. The reliance on psychometric measures of quality to ensure defensible decision making has led to complex, large scale, standardised assessments which can limit ‘authenticity’ and generate logistical challenges, particularly in the OSCE (Brannick et al., 2011; Gormley et al., 2016). It is argued in the wider literature that this has resulted in a relative degree of ‘over
Page 4 of 35
Furthermore, under more traditional single-test assessment models, failing students usually have a short period of remediation, followed by retesting via a ‘resit’
examination (Pell et al., 2009; Ricketts, 2010). Whilst those that pass the assessment progress as normal to the next stage, the evidence indicates that students who initially fail under a test-remediate-retest model are usually successful in the resit (and hence progress), but that in the longer term their weak performance remains or even deteriorates (Pell et al., 2012; Arnold, 2016; Scott, 2012). In short, these traditional models of assessment do not always seem to identify weaker students who are ‘at risk’ of further failure or provide them the time, resources and support they might need to improve their long-term performance.
These considerations have resulted in the exploration of sequential assessment,
best defined as ‘shorter tests with an adaptive stopping rule’ (Wainer and Feinberg, 2015; Pell et al., 2013). In these models, all students undertake a screening ‘main’ test (S1), often associated with a higher passing threshold; those students not achieving this threshold have not failed the test at this point, but are required to take
Page 5 of 35
Several potential benefits are suggested from the sequential model – including a lower burden of assessment overall, and better test reliability in the critical pass/fail region, based on additional assessment of weaker students than would be seen in a more traditional, single-test model. Whilst resource issues should not necessarily be the primary determinant of assessment formats, modelling of sequential testing has highlighted financial benefits, particularly for complex and expensive performance tests such as the OSCE (Cookson et al., 2011; Pell et al., 2013; Walsh, 2011; Smee et al., 2003; Muijtjens et al., 2000). Similar cost effectiveness should also be
realisable with large-scale SBA formats, with the generation of a single SBA test item costed, for example, at approximately US $ 2400 in a licensure examination (Wainer and Feinberg, 2015).
The majority of sequential testing literature is based on largely theoretical studies, post-hoc modelling of decisions based on existing test outcomes or (cautiously)
advocating the use of psychometric indicators of quality to create the ‘ideal’
Page 6 of 35
To contribute to the evidence base in this area, our research uses empirical data to evaluate the impact of four years’ experience of a fully sequential testing model for finals assessment in a UK Medical School. This paper explores two key issues following the move to a sequential model of assessment:
1) The diagnostic accuracy of a sequential testing model in terms of improving pass/fail decisions on learner outcomes.
2) The impact of failing a fully sequential model on future test performance after a remediated full year of repeat study.
We set out to determine whether there is evidence that a move to a sequential testing model is both successful for the whole student cohort in terms of assessment quality, whilst also providing sustained long term benefits in terms of assessment outcomes for the critical group of weakest students.
Setting the Scene: The Leeds context and this study
This study takes place in a UK based medical school, which delivers a five-year undergraduate medical degree. A typical cohort is in the order of 250-280 students, with the majority of students entering after high school study with graduate entrants making up approximately 10% of any cohort.
Page 7 of 35
2015; Garner, 2014; AMEE, 2017). Summative performance tests (OSCEs) are taken towards the end of each of the third, fourth and fifth years, and knowledge tests are taken in all years. To progress, students must pass both the knowledge test and OSCE having already performed satisfactorily across a range of in-course
assessments, and work-based placements. Standards are set using criterion-based methods, namely borderline regression for OSCEs (Kramer et al., 2003; McKinley and Norcini, 2014), and Ebel for the knowledge test supported by additional Rasch analysis (Skakun and Kling, 1980; Cizek and Bunch, 2007; Homer and Darling, 2016). To avoid false positives, cut-scores are adjusted by the addition of a multiple of the standard error of measurement (SEM) (Hays et al., 2008; McManus, 2012) – more details on this are given later in the paper.
A sequential testing model of assessment for both OSCE and knowledge test was first introduced in Year 5 in 2010-2011 as a pilot, with full implementation from 2011-12. There is a gap of up to 15 working days between the two parts of the
assessment, in part to permit quality control analysis, and also to allow sufficient time for logistical arrangements to be made. During this time there is no attempt made to remediate poor performance as the two parts of the sequence are regarded as part of the same assessment. In other words, the second part is not a resit, but rather its purpose is to gather additional information to facilitate a more accurate pass/fail decision for those students in the critical region.
Page 8 of 35
students (Pell et al., 2012). Following successful implementation, sequential testing was introduced into Year 4 of the programme from 2012. An overview of the 2016 sequential model for the two years in question is illustrated in Table 1 which includes numbers of stations/items in the two parts of the sequence. The designs for the two years are different as the Year 4 assessment is based around five separate
specialties, whereas in Year 5 all specialties are combined in an integrated
assessment – see Pell et al. (2013) for more detail on the respective assessment designs.
TABLE 1 HERE
Students who do not meet the required standard on the full sequence in either Year 4 or Year 5 are required to repeat the full year, followed by resit assessment in the same sequential format, taken alongside their new peer group. This model uses the academic principle of grade retention, best described as the mandatory repetition of study/assessment as a result of insufficient performance (Tafreschi and Thiemann, 2016). The broader literature surrounding grade retention shows mixed effects (positive effects in primary education but not in high school) but has recently been associated with sustained improvements in Grade Point Average (GPA) in a major study tracking repeating students at a European University (Jacob and Lefgren, 2004; Jacob and Lefgren, 2009; Tafreschi and Thiemann, 2016).
Page 9 of 35
medical faculty who have themselves failed high stakes tests. The latter is intended to provide ‘currency’ with students (role modelling from junior doctors who have failed but ultimately succeeded) and ‘safety’ as these doctors are heavily engaged in education informed teaching practice, supported by senior faculty. This scheme makes major use of in-training/workplace assessment tools to deliver a model of continuous assessment and feedback.
Methods
Identification of students
We identified all students who failed either the knowledge test or OSCE in Years 4 (2013 – 2015 inclusive), or 5 (2012 – 2015 inclusive), and had to then repeat the year as a consequence of the implementation of a sequential testing model of assessment. As a marker of longitudinal impact on learners, we also identified a subset of students who had failed and then successfully repeated Year 4 and
progressed ‘normally’ into Year 5. This allowed an exploration of the key issue as to
whether any ‘learning gains’ in terms of student performance in the repeat year 4 were sustained into a further year of study (Year 5).
This schema generates three distinct categories of students for us to investigate in terms of changes in performance following a repeat year of study and resit
examination:
Page 10 of 35
2. Year 4 repeat/resit who progress into Year 5 (Y4RRY5) – these are students who have repeated Year 4 and then progress successfully into Year 5. We are interested in the extent to which any improvement in performance following the repeated Year 4 is sustained into Year 5. (Note this group is a sub-group of those in category 1).
3. Year 5 repeat/resit (Y5RR) - these are students who failed the full sequence in Year 5 and had to then repeat the year as a consequence.
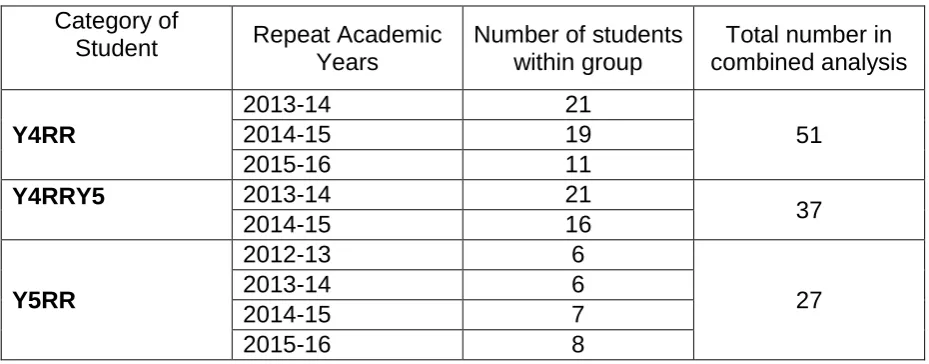
The numbers in each of these three groups are relatively small and shown as a composite in Table 2 below.
TABLE 2 HERE
Diagnostic Accuracy
Using our 2016 dataset, we have used methods previously outlined in Pell et al. (2013), to indicate hypothetical false classifications. For each examination, these are false positive and false negative student-level ‘decisions’ based on comparing
sequence 1 ‘decisions’ (pass or S2) to S2 overall pass/fail decisions. We have repeated this analysis for both Years 4 and 5, under the (mature) 2016 sequential model.
Markers of Student Performance
We use aggregate OSCE checklist marks and total knowledge test scores on the first ‘screening’ part of the sequence (‘S1’) to measure student performance. However, since we have varying content year-on-year in both modes of
Page 11 of 35
facilitate this study, we have assumed that the full group of 250+ students varies little in its overall ‘ability’ year-on-year, thereby allowing the use of percentile ranks to compare individual relative changes in year-on-year performance. Whilst this
assumption of a constant overall ability may not hold precisely for every year-on-year comparison (Homer and Darling, 2016), the differences are unlikely to be large and will even themselves out over a number of cohorts when rankings are compared. Note also that rankings are largely unaffected by variation in assessment difficulty.
We calculate percentile ranks in S1 for each mode of assessment and compare this with percentile ranks on the corresponding S1 assessment a year later following the full year repeat and resit. Lower ranks correspond to higher performance (i.e. rank 1 is highest) and we calculate the change in percentile ranks as:
Change in rank = rank in previous year – rank in subsequent year.
So, a student who improves their performance during their repeat year and examination will have a positive change in percentile ranks.
We have provided descriptive and graphical descriptions of these changes across the groups shown in Table 2. As the sample sizes are small (often in the order of <2.5% of total cohort (e.g. 6/250 students repeating) and given the ordinal nature of the data, significance testing was felt to be inappropriate and unnecessary.
Finally, we note that there is a complication to the ranking analysis in that the
Page 12 of 35
Regression to the mean occurs when scores (or ranks) have a degree of
measurement error in them. Repeating students are a poorly performing sub-group by definition and some of their initial poor performance is due to the random effect of error in the measurement working against them as a sub-group. Under a retest, such as repeating the year and then resitting the exam, the scores/ranks for this sub-group will tend to be better just because of differences in measurement error
compared to the first time around. There is a simple formula for the typical size of the regression to the mean effect on an individual test score based on the reliability of the test and the distance of the score from the mean (McManus, 2012):
Correction to score = (1 – reliability) × (distance of score from mean score) We will estimate the size of this effect for scores and then ranks, and take account of the implications in our discussion.
Results
What is the diagnostic accuracy of a sequential testing model in terms of
improving pass/fail decisions on learner outcomes?
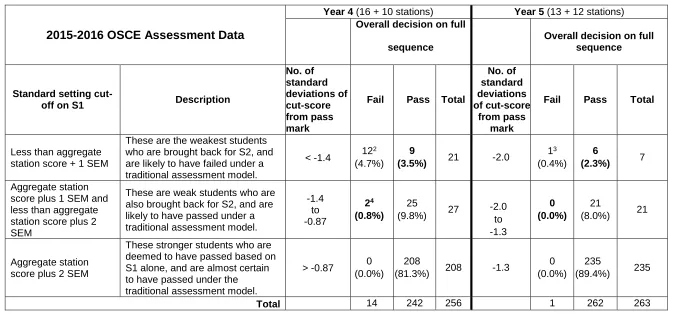
For the most recent data available (Year 4 and Year 5 data from 2015-2016), Table 3 estimates the diagnostic accuracy of the sequential model in comparison with that of the first part of the sequence. This analysis is intended to be illustrative of the misclassification apparent (but unknown) in more traditional models of assessment (i.e. one single test for all candidates).
Page 13 of 35
degree, these particular students may then be regarded as hypothetical false negatives under the traditional assessment model.
The second data row of Table 3 gives the number of students who would probably have passed the traditional assessment model, but under the sequential model have been called back to undertake S2 in order to provide additional evidence of
competence over a wider range of topics. In Year 4, two of these students actually failed the full assessment. Whilst there were no such students in Y5 in this particular cohort, our analysis indicates that these do occur at an approximate rate of 1 every two or so years. These students maybe may be considered as hypothetical false positives under the traditional assessment model.
In Table 3, we have also calculated the number of standard deviations from the mean mark1 for each cut-score in the assessments. We note that for Year 4 these
are closer to zero than in Y5. This is important, as theoretically one would expect a higher rate of false classifications the closer the cut scores are to the mean score (in essence, error in the measurement captures more students in the centre of the distribution than at the tails, even if the absolute measurement error in the latter case is more pronounced). These observations are supported by the empirical data in Table 6, where Year 4 has 11 such false classifications as opposed to six in Year 5. We conclude that the benefit of the sequential model of assessment on diagnostic accuracy becomes more pronounced when the ‘pass/fail’ cut-score and the mean of the checklist score are closer together.
TABLE 3 HERE
Page 14 of 35
What is the impact of failing a fully sequential model on future test
performance after a remediated full year of repeat study?
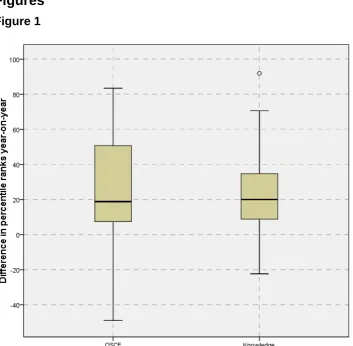
1. Impact of Year 4 repeat and resit: Change in percentile ranks (Y4RR)
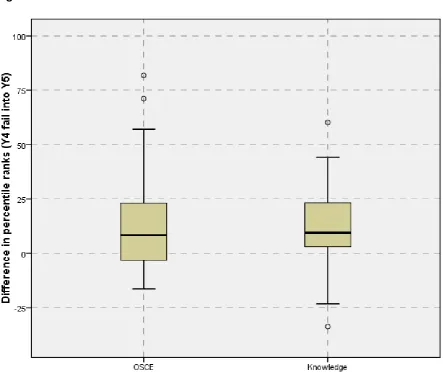
The box-plot in Figure 1 summarises changes in percentile ranks when comparing before and after the resit year for this group of 51 students across three cohorts combined (see Table 2: Y4RR). It is clear that there is a substantial change across both assessment types – the median OSCE rankings improved by 19 percentile points, and in the knowledge test by 20 percentile points. Figure 1 also shows that the changes in OSCE performance tend to be more variable than those for the knowledge part of the assessment –the spread of the ‘boxes’ is larger for the OSCE than it is for the knowledge test.
FIGURE 1 HERE
Page 15 of 35
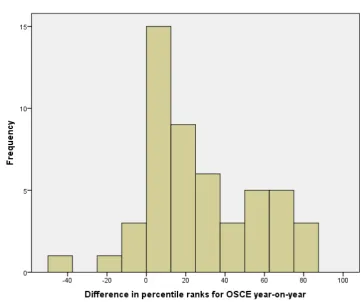
There is also tentative evidence in this analysis (Figure 2) that the change in OSCE performance bifurcates – with two groups emerging – a larger group (n=38) of those that typically improve a little (by a median of 11 percentile points), and a smaller group (n=13) those that improve more substantially (by a median of 67 percentile points). This latter group is roughly in the same proportion as those under the old model of test-remediate-retest who improved their grade (Pell et al., 2012).
FIGURE 2 HERE
For the sub-group of these students we currently have data on, we now consider whether those gains in student performance throughout Year 4 are sustained into Year 5.
2. Is the change in percentile ranks for Year 4 repeat/resit students progressing into
Year 5 sustained? (Y4RRY5)
There are 37 students who did a full Year 4 repeat/resit and then progressed into Year 5, and were examined at the end of Year 5 with their new peer cohort (see Table 2: Y4RRY5). Figure 3 summarises how this group of students subsequently performed on progression into Year 5 relative to their performance when failing Year 4. It is clear that improvement in relative ranking in Year 5 compared to initial Year 4 ranking is considerably smaller than it was at the end of the Year 4 resit year
Page 16 of 35
that of earlier research based on the traditional, single-test assessment model (Pell et al., 2012). We will return to these important issues in the Discussion, although would highlight here that direct comparisons with this earlier work are to an extent problematic as the methods and approaches taken are quite different. Finally, we also note that two students from this group failed Year 5 and appear in our third group (Y5RR).
FIGURE 3 HERE
3. Impact of Year 5 repeat and resit: change in percentile ranks. (Y5RR)
The box plot summary of changes in percentile ranks for Year 5 students repeating (n=27 across four year groups, see Table 2: Y5RR) is given in Figure 4. Typically, students improve by 23 percentile ranks in the OSCE and by 21 in the knowledge test. Four of the 27 (15%) students in this group deteriorated over the year in the OSCE, and two (7%) did so in the knowledge test.
Comparing with the corresponding results for Year 4 (Figure 1) we see that, whilst the magnitude of the changes are similar, the figures for Y5 are slightly higher than for Y4 (19 and 20 percentile ranks respectively). We have not included an equivalent of Figure 2 for this group as we see no particular evidence of bifurcation in Y5, and the number of cases is quite small (n=27).
Page 17 of 35
Impact of the effect of regression towards the mean on changes in percentile
ranks
We have investigated this effect across our student cohorts. Calculations, using reliability measures and deviations of scores from the mean, indicate that this is typically of the order of 5% in the score (Barnett et al., 2005). In other words, without any intervention, we estimate that those students repeating the year would be
expected to increase their score by an average of 5%. Further calculations indicate that the corresponding effect on the ranks is of the order of 5 percentile points, so students repeating the year would be expected to increase their ranking by around 5 percentile points just as consequence of regression to the mean.
The magnitude of this effect is relatively small compared to most of our earlier findings. We conclude that all our main findings remain broadly unchanged in substantive terms once regression to the mean is taken into account, but are a little smaller in magnitude. As already highlighted, the corrected findings still contrast with that of earlier research based on the traditional, single-test, assessment model (Pell et al., 2012) where weak students tend to decline in performance longitudinally.
Discussion
Page 18 of 35
(Dijkstra et al., 2010; Schuwirth and van der Vleuten, 2012; Schuwirth et al., 2017), and is thus of major importance to postgraduate and licensing examinations.
Previous research (Currie and Cleland, 2016b; Currie et al., 2015; Jalili and Hejri, 2016; Muijtjens et al., 2006) has attempted to explore the ‘quality’ of sequential testing using whole test, largely psychometrically-driven, analyses (e.g. selecting stations to maximise reliability and decision-making). However, we would argue such approaches are necessarily limited as they are hypothetically modelled, and tend to focus on selecting the number (and type) of station to create the ‘ideal’ test, rather than an approach centred on effective blueprinting across the assessment. By contrast, the current study is the first to our knowledge focusing on the diagnostic accuracy of sequential testing using ‘live’ cohorts of candidates (i.e. genuine outcomes of the assessment as sat), and to track future student performance.
To summarise, in this study we find that the key overall benefits of a sequential model of assessment, followed by extended remediation and retesting, are two-fold when compared to traditional, single large-scale assessment:
i. enhanced diagnostic accuracy, and,
ii. the sustained, strong improvement in student performance (‘learner gain’) when personalised remediation sits alongside this approach to testing.
Analysis of multiple student cohorts has identified a number of hypothetical
Page 19 of 35
inherent in the traditional model of assessment. Whilst such candidates are relatively small in number, it is important to note that diagnostic inaccuracy for each one will result in potential harm – failure to progress for those false negatives, and for the false positives, potential harm to patients. We cannot claim that the false negatives and false positives exactly represent the true (but unknowable) figures since some traditional OSCE models may use up to 15 stations or more. However, with between 13-16 high quality stations for our screening test, we would argue these are broadly equivalent, or larger in size, than many single test formats (Harden et al., 2015; McKinley and Norcini, 2014). Of particular importance, we note that the benefit of the sequential model of assessment on diagnostic accuracy becomes more
pronounced if the S1 cut-score and the mean score of the student score distribution are closer together. Thus, application of sequential testing formats is particularly of value to less ‘selected’ candidate cohorts - for example, in entry to medical school, or in international exams where there is a wider range of candidate ability compared to, say, the typical examination within an undergraduate program where most
candidates are highly able.
Turning to the impact on repeating students, during the resit year there is generally a strong improvement in student performance, typically moving in broad terms from
Page 20 of 35
targeted support to ensure that their improved performance is sustained into (and beyond) Year 5.
These findings both complement and contrast existing work that indicates that the majority of weak students’ deteriorate in performance over the course of the later years of medical school (Pell et al., 2012). In this study, we do not find this
deterioration in any of the groups investigated. Even the group with the weakest
‘gain’ in performance (Y4 resitters into Y5), still do actually improve in their Year 5 performance on average compared to their original Year 4 performance even after taking regression to the mean into account. This triangulates well with work from the wider higher education literature exploring the impact of grade retention (Tafreschi and Thiemann, 2016) which finds that under such policies students generally boost their performance in subsequent years. Further work is underway to delineate the effects of remediation and the impact of undertaking a sequential (rather than test-remediate-retest) model on students’ self-regulated learning behaviours and resilient mindsets (Yeager and Dweck, 2012).
In terms of limitations, we comment that this study is situated in a single UK medical school, and the number of students in some of the groups is relatively small.
However, we justify the need for this study given that this is a relatively new
assessment model, and there is little or no similar extant research into its impact on weak and failing students in the literature. Other limitations are that successive
cohorts are not necessarily of exactly the same average ‘ability’, and the
assessments can and do vary, even though ‘test’ standards are theoretically
Page 21 of 35
However, we would argue that the relatively large changes in percentile ranks evidenced in the study across two year groups and in multiple cohorts suggest that the overall findings are secure. In other words, even if the year-on-year comparisons are not exact, the large effects seen are not due to methodological flaws in the analysis.
We acknowledge that this study only uses assessment outcomes to measure changes in student performance. There is clearly scope for additional mixed
methods approaches to investigate perceptions of students’ change in ‘’identity’ as a result of sitting the whole sequence test, and in any subsequent impact on future learning, performance and career trajectories (Cleland et al., 2013; White et al., 2009). Similarly, there are clearly emerging research questions focusing on how and why performance changes, the extent to which such changes can be sustained, and to better understand how the experience in the resit year can be further improved for the weakest students. There is also scope to investigate differences between
performance tests and knowledge tests when it comes to the impact of ‘failing’ the first sequence. Current work is underway to explore the outcomes for students who appear to underperform during the first sequence, but pass overall as a result of a stronger performance in sequence 2. This will give important insights into the impact of performance anxiety on assessment outcomes, and on changes in student
self-perceptions of their ‘ability’.
Sequential testing models provide a key opportunity to rethink assessment. By
‘personalising’, or ‘adapting’ assessment better to the individual (Wainer and
Page 22 of 35
in comparison to single large-scale test models. Whilst the numbers of students whose ultimate pass/fail decision is changed by the result of sitting a second
sequence is arguably quite small (Table 3), the model does reduce harm through the minimisation of false positive and false negative student outcomes. Of equal
importance is our finding of students’ sustained improved outcomes on repeated testing. This generates a range of critical research questions about sustainable assessment and to what extent sequential models with personalised remediation
may change learners’ behaviour (Boud and Soler, 2016).
Using ‘live’ rather than ‘modelled’ data, we have been able to demonstrate that the focussed investment our assessment model affords leads to better diagnostic decision-making through additional testing for the weakest students. Moreover, the subsequent support and remediation over the course of a full year resit for those who fail has positive and sustained impact on learner gain.
References
AMEE 2017. Aspire - Recognition of Excellence in Education. [Accessed 28 June 2017]. Available from: https://www.aspire-to-excellence.org/.
American Educational Research Association 2014. Standards for Educational and Psychological Testing. Washington, D.C: American Educational Research Association.
Arnold, I. 2016. Resitting or compensating a failed examination: does it affect subsequent results? Assessment & Evaluation in Higher Education.
0(0),pp.1–15.
Barnett, A.G., Pols, J.C. van der and Dobson, A.J. 2005. Regression to the mean: what it is and how to deal with it. International Journal of Epidemiology.
Page 23 of 35
Bland, J.M. and Altman, D.G. 1994a. Statistic Notes: Regression towards the mean. BMJ. 308(6942),p.1499.
Bland, J.M. and Altman, D.G. 1994b. Statistics Notes: Some examples of regression towards the mean. BMJ. 309,p.780.
Boud, D. and Soler, R. 2016. Sustainable assessment revisited. Assessment & Evaluation in Higher Education. 41(3),pp.400–413.
Brannick, M.T., Erol-Korkmaz, H.T. and Prewett, M. 2011. A systematic review of the reliability of objective structured clinical examination scores. Medical
Education. 45(12),pp.1181–1189.
Case, S. and Swanson, D. 2001. Constructing Written Test Questions for the Basic and Clinical Sciences [Online]. Philadelphia: NBME. [Accessed 3 July 2013]. Available from:
http://www.heacademy.ac.uk/resources/detail/resource_database/SNAS/Cons tructing_Written_Test_Questions_for_the_Basic_and_Clinical_Sciences. Cizek, G.J. and Bunch, M.B. 2007. Standard setting a guide to establishing and
evaluating performance standards on tests [Online]. Thousand Oaks, Calif.: Sage Publications. [Accessed 21 August 2013]. Available from:
http://SRMO.sagepub.com/view/standard-setting/SAGE.xml.
Cleland, J., Leggett, H., Sandars, J., Costa, M.J., Patel, R. and Moffat, M. 2013. The remediation challenge: theoretical and methodological insights from a
systematic review. Medical Education. 47(3),pp.242–251.
Cookson, J., Crossley, J., Fagan, G., McKendree, J. and Mohsen, A. 2011. A final clinical examination using a sequential design to improve cost-effectiveness. Medical Education. 45,pp.741–747.
Currie, D.G.P. and Cleland, P.J. 2016a. Sequential objective structured clinical examinations: Number of stations. Medical Teacher. 38(8),pp.857–858. Currie, D.G.P. and Cleland, P.J. 2016b. Sequential objective structured clinical
examinations: Number of stations. Medical Teacher. 0(0),pp.1–1.
Currie, G.P., Sivasubramaniam, S. and Cleland, J. 2015. Sequential testing in a high stakes OSCE: Determining number of screening tests. Medical Teacher.
0(0),pp.1–7.
Dijkstra, J., Vleuten, C.P.M.V. der and Schuwirth, L.W.T. 2010. A new framework for designing programmes of assessment. Advances in Health Sciences
Education. 15(3),pp.379–393.
Fuller, R., Homer, M. and Pell, G. 2013. Longitudinal interrelationships of OSCE station level analyses, quality improvement and overall reliability. Medical Teacher. 35(6),pp.515–517.
Page 24 of 35
https://www.leeds.ac.uk/forstaff/news/article/4348/excellence_in_medical_edu cation_recognised.
Gormley, G.J., Hodges, B.D., McNaughton, N. and Johnston, J.L. 2016. The show must go on? Patients, props and pedagogy in the theatre of the OSCE. Medical Education. 50(12),pp.1237–1240.
Harden, R., Lilley, P. and Patricio, M. 2015. The Definitive Guide to the OSCE: The Objective Structured Clinical Examination as a performance assessment., 1e
1 edition. Edinburgh ; New York: Churchill Livingstone.
Harden, R.M. and Roberts, T.E. 2015. ASPIRE: international recognition of excellence in medical education. The Lancet. 385(9964),p.230.
Hays, R., Gupta, T.S. and Veitch, J. 2008. The practical value of the standard error of measurement in borderline pass/fail decisions. Medical Education.
42(8),pp.810–815.
Hejri, S.M., Yazdani, K., Labaf, A., Norcini, J.J. and Jalili, M. 2016. Introducing a model for optimal design of sequential objective structured clinical
examinations. Advances in Health Sciences Education. 21(5),pp.1047–1060. Homer, M. and Darling, J.C. 2016. Setting standards in knowledge assessments:
Comparing Ebel and Cohen via Rasch. Medical Teacher. 38(12),pp.1267– 1277.
Jacob, B.A. and Lefgren, L. 2004. Remedial Education and Student Achievement: A Regression-Discontinuity Analysis. The Review of Economics and Statistics.
86(1),pp.226–244.
Jacob, B.A. and Lefgren, L. 2009. The Effect of Grade Retention on High School Completion. American Economic Journal: Applied Economics. 1(3),pp.33–58. Jalili, M. and Hejri, S.M. 2016. What is an optimal sequential OSCE model? Medical
Teacher. 0(0),pp.1–1.
Kramer, A., Muijtjens, A., Jansen, K., Düsman, H., Tan, L. and Van Der Vleuten, C. 2003. Comparison of a rational and an empirical standard setting procedure for an OSCE. Medical Education. 37(2),pp.132–139.
McKinley, D.W. and Norcini, J.J. 2014. How to set standards on performance-based examinations: AMEE Guide No. 85. Medical Teacher. 36(2),pp.97–110. McManus, I.C. 2012. The misinterpretation of the standard error of measurement in
medical education: a primer on the problems, pitfalls and peculiarities of the three different standard errors of measurement. Medical teacher.
34(7),pp.569–576.
Muijtjens, A.M., van Vollenhoven, F.H., van Luijk, S.J. and van der Vleuten, C.P. 2000. Sequential testing in the assessment of clinical skills. Academic Medicine: Journal of the Association of American Medical Colleges.
Page 25 of 35
Muijtjens, A.M.M., Luijk, S.J. and Vleuten, C.P.M. 2006. ROC and Loss Function Analysis in Sequential Testing. Advances in Health Sciences Education.
11,pp.5–17.
Patrício, M.F., Julião, M., Fareleira, F. and Carneiro, A.V. 2013. Is the OSCE a feasible tool to assess competencies in undergraduate medical education? Medical Teacher. 35(6),pp.503–514.
Pell, G., Boursicot, K. and Roberts, T. 2009. The trouble with resits …. Assessment & Evaluation in Higher Education. 34,pp.243–251.
Pell, G., Fuller, R., Homer, M. and Roberts, T. 2013. Advancing the objective structured clinical examination: sequential testing in theory and practice. Medical Education. 47(6),pp.569–577.
Pell, G., Fuller, R., Homer, M. and Roberts, T. 2010. How to measure the quality of the OSCE: A review of metrics - AMEE guide no. 49. Medical Teacher.
32(10),pp.802–811.
Pell, G., Fuller, R., Homer, M. and Roberts, T. 2012. Is short-term remediation after OSCE failure sustained? A retrospective analysis of the longitudinal
attainment of underperforming students in OSCE assessments. Medical teacher. 34(2),pp.146–150.
Pell, G., Homer, M. and Fuller, R. 2015. Investigating disparity between global grades and checklist scores in OSCEs. Medical Teacher. 37(12),pp.1106– 1113.
Ricketts, C. 2010. A new look at resits: are they simply a second chance? Assessment & Evaluation in Higher Education. 35(4),pp.351–356.
Rothman, A.I., Blackmore, D.E., Dauphinée, W.D. and Reznick, R. 1997. Tests of
sequential testing in two years’ results of Part 2 of the Medical Council of Canada Qualifying Examination. Academic Medicine: Journal of the Association of American Medical Colleges. 72(10 Suppl 1),pp.S22-24. Schuwirth, L., Vleuten, C. van der and Durning, S.J. 2017. What programmatic
assessment in medical education can learn from healthcare. Perspectives on Medical Education. 6(4),pp.211–215.
Schuwirth, L.W.T. and van der Vleuten, C.P.M. 2012. Programmatic assessment and
Kane’s validity perspective. Medical Education. 46(1),pp.38–48.
Scott, E.P. 2012. Short-term gain at long-term cost? How resit policy can affect student learning. Assessment in Education: Principles, Policy & Practice.
19(4),pp.431–449.
Senn, S. 2011. Francis Galton and regression to the mean. Significance.
8(3),pp.124–126.
Page 26 of 35
Smee, S.M., Dauphinee, W.D., Blackmore, D.E., Rothman, A.I., Reznick, R.K. and Des Marchais, J. 2003. A sequenced OSCE for licensure: administrative issues, results and myths. Advances in Health Sciences Education: Theory and Practice. 8(3),pp.223–236.
Tafreschi, D. and Thiemann, P. 2016. Doing it twice, getting it right? The effects of grade retention and course repetition in higher education. Economics of Education Review. 55,pp.198–219.
Wainer, H. and Feinberg, R. 2015. For want of a nail: Why unnecessarily long tests may be impeding the progress of Western civilisation. Significance.
12(1),pp.16–21.
Walsh, K. 2011. Sequential testing: costs and cost savings may be greater. Medical Education. 45(12),pp.1262–1262.
White, C.B., Ross, P.T. and Gruppen, L.D. 2009. Remediating students’ failed OSCE
performances at one school: the effects of self-assessment, reflection, and feedback. Academic Medicine: Journal of the Association of American Medical Colleges. 84(5),pp.651–654.
Page 27 of 35
Tables
Table 1
Year Mode of assessment
Sequence 1 (S1) – the
‘screening’ test
that all students take
Sequence 2 (S2) – the
‘additional’ test
that only the weakest students have to take
The full
sequence To progress
4
OSCE 16 stations 10 stations 26 stations
Both OSCE and
knowledge tests must be passed.
For those doing S2, this decision is based on performance in the full sequence Knowledge 200 items 150 items 350 items
5
OSCE 13 stations 12 stations 25 stations
Knowledge 160 items 160 items 320 items
[image:28.595.66.531.551.733.2]Table 1: Overview of sequential testing arrangements in 2015
Table 2
Category of
Student Repeat Academic Years
Number of students within group
Total number in combined analysis
Y4RR
2013-14 21
51
2014-15 19
2015-16 11
Y4RRY5 2013-14 21
37
2014-15 16
Y5RR
2012-13 6
27
2013-14 6
2014-15 7
2015-16 8
Page 28 of 35
Table 3
2015-2016 OSCE Assessment Data
Year 4 (16 + 10 stations) Year 5 (13 + 12 stations)
Overall decision on full
sequence
Overall decision on full sequence
Standard setting
cut-off on S1 Description
No. of standard deviations of cut-score from pass mark
Fail Pass Total
No. of standard deviations of cut-score from pass mark
Fail Pass Total
Less than aggregate station score + 1 SEM
These are the weakest students who are brought back for S2, and are likely to have failed under a traditional assessment model.
< -1.4 12
2
(4.7%)
9
(3.5%) 21 -2.0
13
(0.4%)
6
(2.3%) 7
Aggregate station score plus 1 SEM and less than aggregate station score plus 2 SEM
These are weak students who are also brought back for S2, and are likely to have passed under a traditional assessment model.
-1.4 to -0.87 24 (0.8%) 25
(9.8%) 27 -2.0 to
-1.3
0 (0.0%)
21
(8.0%) 21
Aggregate station score plus 2 SEM
These stronger students who are deemed to have passed based on S1 alone, and are almost certain to have passed under the traditional assessment model.
> -0.87 0 (0.0%)
208
(81.3%) 208 -1.3
0 (0.0%)
235
(89.4%) 235
Total 14 242 256 1 262 263
Table 3: End of Year OSCE pass fail decisions (figures in bold type represent hypothetical false classifications based on S1 alone when compared to
actual full sequence decisions)
2Two of these students failed to pass the requisite number of stations in the full sequence.
3 This student failed to pass the requisite number of stations in the full sequence.
Page 29 of 35
Figures
Figure 1
Page 30 of 35
Figure 2
Figure 2: Change in OSCE percentile ranks following Y4 repeat year and
Page 31 of 35
Figure 3
Page 32 of 35
Figure 4
Page 33 of 35
Notes on Contributors
Matt Homer BSc, MSc, PhD, CStat, is an Associate Professor, working in both the Schools of Medicine and Education. His medical education research focuses on psychometrics and assessment quality, particularly related to OSCEs and knowledge tests.
Richard Fuller, MA, MBChB, FRCP, FAcadMed is a consultant physician, Professor of Medical Education and Director of the undergraduate degree programme at Leeds
Institute of Medical Education. His research interests focus on the ‘personalisation’ of
assessment, to support individual learner journeys, through application of intelligent assessment design in campus and workplace based assessment formats, assessor behaviours, mobile technology delivered assessment and the impact of sequential testing methodologies.
Godfrey Pell, BEng, MSc, C.Stat, C.Sci, is principal research fellow emeritus at Leeds Institute of Medical Education, who has a strong background in management. His research focuses on quality within the OSCE, including theoretical and practical applications. He acts as an assessment consultant to a number of medical schools.
Funding
Page 34 of 35
Practice points
Sequential testing, alongside a scheme of personalised remediation, improves the longitudinal outcomes for failing students when compared to
within-academic-year test-remediate-retest models of assessment.
Sequential testing improves the diagnostic accuracy for students in the critical pass/fail region.
Acknowledgments
None.
Ethics
The University of Leeds gave permission for this anonymised data to be used for research. The co-chairs of the University of Leeds School of Medicine ethics
committee confirmed to the authors that formal ethics approval for this study was not required as it involved the use of routinely collected student assessment data which were fully anonymised prior to analysis.
Competing interests
None.
Word count
5200
Declaration of interests
Page 35 of 35
Glossary
Sequential testing
In a sequential test (Pell et al., 2013), the examination is in two parts, beginning with
a ‘screening’ test that all candidates take often associated with a higher passing threshold to avoid false positive decisions. Those students not achieving this threshold have not failed the test at this point, but are required to take a further
‘additional’ test to provide more evidence as to their ‘true’ performance. The full
sequence must be blueprinted collectively, and careful consideration should be given to those selection of topics/domains assessed in the first part of the sequence.