www.drink-water-eng-sci.net/10/1/2017/ doi:10.5194/dwes-10-1-2017
© Author(s) 2017. CC Attribution 3.0 License.
Review of applications for SIMDEUM, a stochastic
drinking water demand model with a small temporal
and spatial scale
Mirjam Blokker1, Claudia Agudelo-Vera1, Andreas Moerman1, Peter van Thienen1, and Ilse Pieterse-Quirijns2
1KWR Watercycle Research Institute, 3433 PE Nieuwegein, the Netherlands
2Amsterdam University of Applied Science, Faculty of Technology, Hogeschool van Amsterdam,
Amsterdam, the Netherlands
Correspondence to:Mirjam Blokker (mirjam.blokker@kwrwater.nl)
Received: 25 January 2017 – Discussion started: 27 January 2017 Accepted: 3 April 2017 – Published: 26 April 2017
Abstract. Many researchers have developed drinking water demand models with various temporal and spatial scales. A limited number of models is available at a temporal scale of 1 s and a spatial scale of a single home. The reasons for building these models were described in the papers in which the models were introduced, along with a discussion on their potential applications. However, the predicted applications are seldom re-examined. SIMDEUM, a stochastic end-use model for drinking water demand, has often been applied in research and prac-tice since it was developed. We are therefore re-examining its applications in this paper. SIMDEUM’s original purpose was to calculate maximum demands in order to design self-cleaning networks. Yet, the model has been useful in many more applications. This paper gives an overview of the many fields of application for SIMDEUM and shows where this type of demand model is indispensable and where it has limited practical value. This overview also leads to an understanding of the requirements for demand models in various applications.
1 Introduction
Many researchers have developed drinking water demand models with various temporal and spatial scales. Several models are available at a temporal scale of 1 s and a spa-tial scale of a single home (Creaco et al., 2017). The mod-els were introduced in papers, along with a discussion on their potential applications. For the small temporal and spa-tial scale models, the main application was assumed to be in water quality modelling (Blokker et al., 2008b) related to discolouration, chlorine decay and contaminant propagation. However, the predicted applications are rarely re-examined. The applications are reported in papers, but an overview of which applications are of interest and which are not has not yet been described.
An example of a drinking water demand model is SIMDEUM (Blokker et al., 2011b, 2010c). SIMDEUM dif-fers from traditional demand models in various aspects:
firstly, SIMDEUM is based on parameters with a physical meaning instead of statistical parameters determined from measurements. Secondly, SIMDEUM is a stochastic model, while traditional models are deterministic (for an overview, see Donkor et al., 2012). Third, SIMDEUM has a small spa-tial scale (the customer tap). Fourth, SIMDEUM has a small temporal scale (1 s). There are some other non-traditional de-mand models that are stochastic and have a small spatial and temporal scale (see e.g. Creaco et al., 2017). However, these models usually only go as far as the household connection, and they rely on extensive demand measurements.
Figure 1.A basic explanation of how SIMDEUM DW works.
different applications. This paper gives an overview of the many fields of applications for SIMDEUM and shows where this type of demand model is indispensable and where it is of limited practical value for the use of the full details of SIMDEUM. In these applications, it is always possible to use SIMDEUM at a higher aggregation level.
This paper is structured as follows. Section 2 ex-plains how SIMDEUM works and discusses the valida-tion of the SIMDEUM results with measurements. Each of SIMDEUM’s unique modelling aspects provides a dif-ferent modelling opportunity and leads to a difdif-ferent field of application. Section 3 gives an overview of the various SIMDEUM applications. Section 4 reviews the various as-pects and the areas in which they are particularly valid or useful. Some applications are relevant for multiple aspects, which means that previous studies may be mentioned multi-ple times in Sects. 3 and 4.
2 Introduction of SIMDEUM
2.1 Basic description of SIMDEUM
SIMDEUM (Blokker et al., 2010c; Blokker, 2010) is a stochastic model based on input parameters with a physi-cal meaning that is related to water-using appliances (typi-cal flows and volumes) in the home, the household composi-tion (number of people, ages) and consumer water-using be-haviour (number of toilet flushes, duration of showers, pref-erence over the day for water-using activities). SIMDEUM is not based on flow measurements, but on surveys of
household occupancy, household appliances and people’s be-haviour with respect to water (Foekema and Engelsma, 2001; Van der Broek and Breedveld, 1995). SIMDEUM generates demand patterns for cold and hot water use at the tap. Fig-ure 1 shows some examples of the inputs and outputs of SIMDEUM. Its spatial scale is the tap, and it can be aggre-gated to the scale of a single household and an apartment building or street, e.g. by applying a bottom-up approach of demand allocation in a hydraulic model where each node has its own unique set of stochastic demand patterns. Its temporal scale is 1 s and can also be aggregated. SIMDEUM thus has some unique aspects in which it differs from traditional de-mand models. These include its physical basis, its stochastic nature, its small spatial scale (the customer tap) and its small temporal scale (1 s). SIMDEUM leads to realistic demands and realistic variations in those demands, over the day as well as between days and between demand nodes (see Sect. 2.2), at various aggregation levels from 1 s to 1 h and from a single household to a small town.
(Pieterse-0 6 12 18 24 0 0.2 0.4 0.6 0.8 1 1.2 1.4 1.6 1.8 Qday (m 3h -1) Measured SIMDEUM
00:000 06:00 12:00 18:00 00:00
0.5 1 1.5 2 2.5 3 3.5 4 Qday (m 3h -1) Measured SIMDEUM Time (h)
Figure 2.A comparison between the average measured demand pattern and the pattern generated by SIMDEUM DW.(a)The 5 min demands of the sum of 45 homes (Blokker et al., 2010c), and(b)the 15 min demands of a nursing home (Blokker et al., 2011b).
Water age (h)
0 1 2 3 4 5 6 7 8 9 10 0 2 4 6 8 10 12 14 16 Time
Water age (h)
00:000 06:00 12:00 18:00 00:00 2 4 6 8 10 12 14 16 18 20 Time
00:000 06:00 12:00 18:00 00:00 5 10 15 20 25 30 35 40 45 50
ModelBU (95 % c.i.) ModelBU (μ) ModelTD
Measurements
(a) (b)
(c) (d)
Figure 3. The measured and modelled water age at four loca-tions. ModelTD is the model with top-down demand allocation, and ModelBUis the model with bottom-up demand allocation of SIMDEUM patterns. The 95 % confidence interval is due to varia-tion, not to uncertainty (Blokker et al., 2010a).
Quirijns et al., 2015). SIMDEUM HW takes into account heat losses in the pipes and hot water devices and can show the benefits of a shower heat recovery system. A last de-velopment was SIMDEUM WW for waste water discharge patterns (Pieterse-Quirijns et al., 2012). SIMDEUM WW in-cludes the thermal energy of the waste water and the nutrient load, which are also determined by the end use.
2.2 SIMDEUM validations
SIMDEUM has been validated on several of its unique as-pects in various studies over the years. The maximum de-mand in various time steps (per second, per minute, per hour, per day), the number of pulses per day and the number of clock hours per day when there is water use was compared to
the measurements for a single household and an aggregation of 30–45 homes for the Netherlands (Blokker et al., 2010c) and Ohio, USA (Blokker et al., 2008a; Sect. 5 in Blokker, 2010; Buchberger et al., 2003). For the aggregated levels, the diurnal patterns and the variability over the day (by using the cumulative frequency distribution of flows and flow changes between one time step and the next) were also compared to the measurements. A validation was also done for apartment buildings (hot and cold water) of up to 200 units (Pieterse-Quirijns and Beverloo, 2013) and for several streets where a limited set of demand measurements was available off the shelf (Blokker, 2006). Specific validation measurements were also done for the total and hot water use in offices, ho-tels and nursing homes (Pieterse-Quirijns et al., 2013b). In these specific validation measurements, some of the assump-tions in the input variables, such as number of toilets per of-fice employee, were also validated. All of these validations showed the power of the physically based model in generat-ing realistic demand patterns with a realistic variability over the day and between days, as well as a realistic prediction of the maximum flows (see Fig. 2). The ninimum flows were predicted less well with the original SIMDEUM version. In the SIMDEUM drinking water (SIMDEUM DW) version of 2015 (Blokker and Agudelo-Vera, 2015), the night flow was improved as was the midday evening demands for rural and urban residents. This was done by adding new specific data on the time of use for showers, washing machines and dish-washers and a different use of the time budget data. Hot wa-ter demand in residences (SIMDEUM HW) and waste wawa-ter discharge (SIMDEUM WW) patterns have not yet been val-idated with specific measurements.
combi-Figure 4.The fraction of time that the flow reverses in a model with
(a)bottom-up allocated SIMDEUM demands (Blokker, 2010) and
(b)top-down demand allocations. The 50 % value means that 50 % of the time the flow is in one direction and 50 % in the other.
nation with annual water metre readings. More specifically, with SIMDEUM the variation in the demand between days was taken into account by analysing multiple (stochastic) model runs. The results showed that the SIMDEUM model approach gives a much better insight into the actual residence time, especially in the periphery of the DWDS (drinking wa-ter distribution system), and also in the variability of the res-idence time (Fig. 3).
3 Discussion of SIMDEUM applications
3.1 Water quantity modelling
SIMDEUM is used to generate realistic drinking water de-mand patterns, and these are able to provide insight into the various aspects related to water quantity, such as hydraulic network modelling, leakage modelling and transient mod-elling.
Hydraulic network models are used to study the effects on network pressures and flows through the DWDS. The re-sults heavily depend on the demand patterns that are used. The bottom-up approach to (SIMDEUM) demand allocation and the comparison to the traditional top-down demand al-location (Blokker et al., 2011a, 2010a) allowed for the study of how more realistic demands lead to different maximum flow velocities, flow direction reversals (Fig. 4) and resi-dence time in the network (Sect. 8 in Blokker, 2010). In a transition between a fully stochastic bottom-up demand al-location and a fully deterministic top-down demand alloca-tion (see Sect. 2.2), it was found that the use of specific (deterministic) demand patterns for a total of 20 different types of users, such as hotels, schools and restaurants, was a good approach. SIMDEUM was used to generate these spe-cific patterns (Pieterse-Quirijns, 2014), and a model study showed that using this demand pattern library in a hydraulic model leads to a better understanding of water quality in the network (Pieterse-Quirijns and van de Roer, 2013). The study showed many differences between the standard model
and the model with the multiplier patterns from the library, such as different residence times, the hour of maximum flow, flow direction reversals, routes of water flow and contam-inant propagation. The effect of changing demands on the robustness of a DWDS was also studied; Agudelo-Vera et al. (2016) showed that although there can be a significant ef-fect on head, maximum flow velocities and residence times, the studied networks are able to cope.
Another important aspect of water quantity is leakage. Leakage is not usually one of the end uses that is modelled in SIMDEUM. By comparing the measured and SIMDEUM-generated night flows, it may be possible to assess leakage in a DWDS (van Thienen et al., 2012). Depending on the accu-racy of the SIMDEUM-generated night flow (which was im-proved in the 2015 version; see also Sect. 2.2) and the relative amount of leakage compared to total demand, this approach helps to identify the actual leakage, while most traditional water balancing approaches (based on comparing measure-ments over time) will only give insight into the change in leakage over time. The night flow in SIMDEUM is modelled by setting a certain expected total night flow percentage as an input parameter. This input parameter, however, is still only known with a high level of uncertainty and should be studied further.
The effects of transients in the DWDS from changes in wa-ter demand on a small temporal scale (1 s) and a small spa-tial scale (household level) were studied (Pothof and Blokker, 2012). The study showed that the effect on the discolouration risk was limited. The effect of transients on other water qual-ity aspects should be studied further. This requires a large computational capacity when each demand node has 86 400 multipliers in a diurnal pattern.
3.2 Water quality modelling
On top of the hydraulic network modelling, some water qual-ity modelling was done. This involved residence time in the DWDS, chlorine decay, the interpretation of water quality sensor data, the temperature of the drinking water and bac-terial growth, which are all potentially influenced by the dy-namics of the hydraulics in the DWDS.
It was expected that one of the main applications for SIMDEUM would be in modelling water quality in the DWDS (Blokker et al., 2008b). Added value was shown in residence time modelling (Blokker et al., 2010a, 2011a), es-pecially in the periphery of the DWDS (Fig. 3; see also Sect. 2.2), and also in the saddle points where the flow direc-tions change constantly. This also suggested a large effect by bottom-up demand allocation in modelling chlorine residue. There was some effect, again in the periphery of the network, but a much larger effect was notable from the uncertainty in the temperature in relation to chlorine decay (Blokker et al., 2013).
Figure 5.A stacked origin map for a single-sample node (upper right, green circle) for five different sets of stochastic demand pat-terns in the reticulation part of a medium-sized city network, illus-trating the effect of the stochastic nature of water demand on the flow patterns in the network and its impact on calculations. Red nodes occur in each of the five backtraces for the respective de-mand pattern sets. The other colours indicate a lower (but non-zero) number of occurrences (van Thienen et al., 2013).
(van Thienen et al., 2013), specifically at locations that can receive water through multiple paths and where many flow inversions occur (Fig. 5). With SIMDEUM, the uncertainty in backtracing a contaminant becomes evident for some loca-tions; for other locations, the variability in the demand is less influential. This correlates to e.g. the changes in flow direc-tions (Fig. 4). With the help of SIMDEUM, these potential sensor locations may be determined with more certainty.
The drinking water temperature is largely influenced by the temperature of the soil surrounding the DWDS. For most locations, the residence time in the DWDS is long enough for the drinking water temperature to be equal to the soil temperature (Blokker and Pieterse-Quirijns, 2013). For loca-tions where the residence time is relatively short, the
temper-ature at the tap has not yet reached the soil tempertemper-ature. For these locations, the stochastic variation in residence time (in a street, over the day, between days) means that the temper-ature of the tap samples may vary a lot, and the tempertemper-ature model developed by KWR would be difficult to validate in this case (Blokker et al., 2014a). In contrast, the temperature in the drinking water installation (DWI) is heavily influenced by the demand pattern, and not mainly by the ambient tem-perature (Moerman et al., 2014). In this study, SIMDEUM enabled the setting of specific demand patterns for toilet cis-terns, washing machines and hot and cold water for show-ering on the respective faucets in an EPANET model of the drinking water installation. The model study showed that in the winter when the home is heated, the difference between the temperature of the drinking water at the entrance of the home (the water metre) and at the kitchen tap may be as much
as 2–4◦C during the withdrawal of water.
A very preliminary attempt to model bacterial growth in the DWDS showed that validating such a model with tap samples may be very difficult as the variation between loca-tions within a street, the variation over time in a day and the variation between days could be quite significant (Blokker et
al., 2014b). ForAeromonas, this variation was indeed found
in tap samples (van der Wielen, 2015).
3.3 Design of drinking water distribution systems and drinking water installations
SIMDEUM was originally developed for an accurate predic-tion of the maximum drinking water demand and hot water demand. These parameters can then be used in the design of drinking water distribution systems (DWDSs) and (domes-tic and non-domes(domes-tic) drinking water installations (DWIs). This application requires a small temporal scale; the maxi-mum flow per minute can be 80 % of the maximaxi-mum flow per second for a demand of 100 homes.
SIMDEUM has been used for the design of self-cleaning networks (Vreeburg et al., 2009), which are designed in such a way that any particulate material that accumulates over the day is regularly resuspended due to high flow velocities dur-ing (mostly) the morndur-ing peak in demand. The resuspended material then leaves the system through the customer taps by ensuring a unidirectional flow in the network. Note that this design is only applied to isolated areas of approximately 150–200 (residential) connections. SIMDEUM provides in-sight into the maximum daily demands that, together with a certain maximum diameter, ensure regular resuspension. SIMDEUM also provides insight into the maximum yearly demands that, together with a certain minimum diameter, en-sure enough presen-sure at the taps (Blokker et al., 2010b; Buch-berger et al., 2008). Several Dutch water companies now use SIMDEUM as the basis for designing their self-cleaning net-works.
(Pieterse-Figure 6.The maximum design flow for hotels depending on the number of rooms for(a)cold water and(b)hot water. The old de-sign rule was officially the upper limit of the coloured area, but in practice the line in the middle or even the lower limit of the coloured area was used depending on the design expertise. The new design rule is based on SIMDEUM (ISSO-kontaktgroep, 2015). The mea-surements fit the new design rule well (graph based on data from Pieterse-Quirijns et al., 2013a).
Quirijns et al., 2013b; Agudelo-Vera et al., 2013a; Pieterse-Quirijns and Beverloo, 2013) for which insight into the max-imum daily drinking water demand and the maxmax-imum daily hot water demand, together with a requirement for the mini-mum and maximini-mum flow velocities, leads to a certain pipe diameter; the maximum demand for hot water in 10 min, 1 h or 1 day is used to determine the most appropriate hot water device. The design rules following from SIMDEUM were validated (see Sect. 2.2, Fig. 6) and are now in the of-ficial Dutch guidelines for the design of DWIs in apartment buildings and non-domestic buildings (ISSO-kontaktgroep, 2015). A research project was also conducted for the design of hot water devices in residential DWIs (Pieterse-Quirijns et al., 2015). This study showed that hot water devices can be designed much smaller, thus reducing the waste of en-ergy, when realistic water demands are taken into account. The current Dutch building regulation is based on floor space only; SIMDEUM can complement this as it can also take into account the presence and behaviour of the residents.
With SIMDEUM WW, it is also possible to determine the discharge of (non-) domestic waste water. In studying sus-tainability concepts for water saving by using light grey wa-ter and rainwawa-ter for flushing toilets and doing the laundry, SIMDEUM was used to balance the supply and demand at both the level of a single home and an apartment building (Agudelo-Vera et al., 2013b, 2014b; Pieterse-Quirijns et al., 2012). The study showed that the adaptation of water-saving appliances is the most sustainable option compared to rain-water harvesting. It also showed that the design of systems for the reuse of grey water or rainwater is highly sensitive to the demand pattern. The use of realistic patterns simulated
Figure 7.The range of simulated daily water consumption for a selection of end uses and household sizes for 12 future demand sce-narios used in a stress test (Agudelo-Vera et al., 2016).
with SIMDEUM can lead to a smaller tank size or to a better estimation of the harvesting potential. It also showed that in the Netherlands, the size of the necessary storage tank can be much smaller when light grey water is used than when only rainwater is used as an alternative water source. SIMDEUM was used to simulate the water cycle at the block level and the neighbourhood level (Sects. 6 and 7 in Agudelo-Vera, 2012), showing that the building type related to different neighbour-hoods has an influence on the urban water cycle, the effi-ciency of decentralised reuse and rainwater systems.
3.4 Prediction of future water demand
Figure 8.(a)The EPANET hydraulic model of a DWI (Moerman et al., 2014).(b)A detailed view of one tap in the DWI experimental set-up. From left to right: the sampling tap, solenoid valve, temperature sensor, flow sensor and PVC drainage pipe (below in the picture, behind the bend). The solenoid valves in the DWI were electronically operated through the use of SIMDEUM demand patterns; this one is the washing machine (Vreeburg et al., 2012).
3.5 Research in the DWDS
SIMDEUM has also proven to be of use in research. It is impossible to measure flows at all times at all locations in the DWDS, but with the use of SIMDEUM, a hydraulic model can provide this information. This type of modelling has provided insight into the self-cleaning effect and shown that the self-cleaning velocity that has to be reached at 50 %
of the days is 0.20 to 0.25 m s−1 in the tertiary network
(Blokker et al., 2010b, 2011c; Schaap and Blokker, 2011). With SIMDEUM, a better prediction of the residence time will be available, and the study of the relation between the residence time and the water quality may also improve (Mounce et al., 2016; Blokker et al., 2016).
3.6 Application of SIMDEUM outside the developers’ research group
So far, SIMDEUM has mainly been used by the developers, as can be noted by the references in the previous sections. Others outside the developers’ research group have applied SIMDEUM, but this has not always been published.
The Dutch installation sector does not use SIMDEUM directly, but the design rules that were derived from SIMDEUM are in the official Dutch guidelines for the design of DWIs for apartment buildings and non-domestic buildings (ISSO-kontaktgroep, 2015). Several Dutch drinking water companies also use the design rules that were derived from SIMDEUM to develop self-cleaning networks.
MSc and PhD students in the Netherlands, the UK and Germany have used SIMDEUM with limited help from the developers, and some have published their results (Agudelo-Vera, 2012, before she joined KWR; Agudelo-Vera et al., 2013b; Blok, 2016; Fischer, 2008). In Italy, a student devel-oped her own version of a SIMDEUM model (Spina et al., 2014). Other students have used the SIMDEUM results in the hydraulic networks of drinking water installations (Mo-erman, 2013, when he did his internship with KWR;
Mali-novskis, 2013; Zlatanovic, 2017). Most students have strug-gled to collect country-specific or case study SIMDEUM in-put data and have used generic Dutch data for some of the parameters that they could not find. For the Milford, Ohio case, we were able to determine approximately 80 % of US or Milford data from a multitude of publications (Sect. 5. in Blokker, 2010). SIMDEUM input data are taken from infor-mation on (1) household occupancy, (2) household presence (3) and household appliances and people’s behaviour with re-spect to water. With rere-spect to the first type of information, the Dutch bureau of statistics publishes this on their website (CBS); many countries have this kind of data (or census data) available. With respect to the second type of information, a three-yearly survey on domestic water use has been available since 1992 in the Netherlands (van Thiel, 2014); elsewhere this type of data is often collected on a more irregular and ad hoc basis by alternating researchers. With respect to the third type of information, a five-yearly survey on time use is performed in the Netherlands; many countries have similar surveys that are publicly available (Centre for Time Use Re-search, University of Oxford). We believe that various input parameters can be used from the Dutch situation (as e.g. the same washing machines are sold in the whole of Europe) and that country-specific SIMDEUM input data are available, but they are not always easy to find or very recent. In order to val-idate a country-specific SIMDEUM result, some flow mea-surements must be taken, typically in a small DMA (district metered area). These are not always available to students, but water companies can help with that.
SIMDEUM is available in Matlab® (MathWorks,
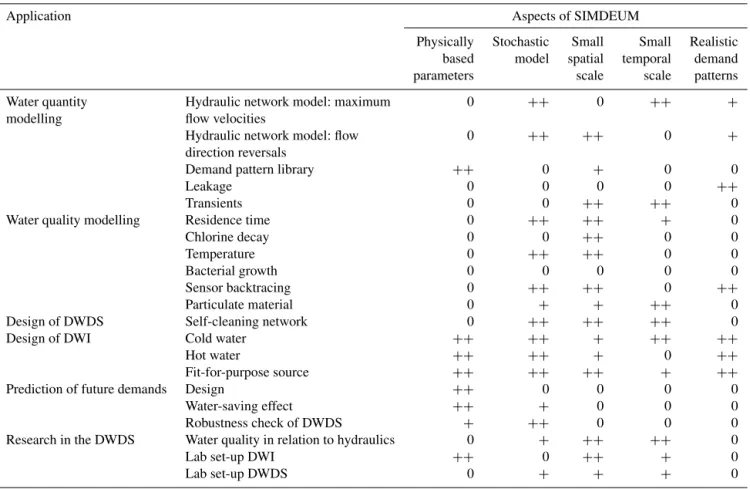
Table 1.The importance of SIMDEUM aspects for various types of applications:++/+indicates that this aspect is either of great importance for the application or that SIMDEUM can be used for this aspect of the application,++indicates that the aspect is essential and+indicates that the aspect is important, but not to its full extent. A “0” means that this aspect has a lesser influence.
Application Aspects of SIMDEUM
Physically Stochastic Small Small Realistic based model spatial temporal demand
parameters scale scale patterns
Water quantity Hydraulic network model: maximum 0 ++ 0 ++ +
modelling flow velocities
Hydraulic network model: flow 0 ++ ++ 0 +
direction reversals
Demand pattern library ++ 0 + 0 0
Leakage 0 0 0 0 ++
Transients 0 0 ++ ++ 0
Water quality modelling Residence time 0 ++ ++ + 0
Chlorine decay 0 0 ++ 0 0
Temperature 0 ++ ++ 0 0
Bacterial growth 0 0 0 0 0
Sensor backtracing 0 ++ ++ 0 ++
Particulate material 0 + + ++ 0
Design of DWDS Self-cleaning network 0 ++ ++ ++ 0
Design of DWI Cold water ++ ++ + ++ ++
Hot water ++ ++ + 0 ++
Fit-for-purpose source ++ ++ ++ + ++
Prediction of future demands Design ++ 0 0 0 0
Water-saving effect ++ + 0 0 0
Robustness check of DWDS + ++ 0 0 0
Research in the DWDS Water quality in relation to hydraulics 0 + ++ ++ 0
Lab set-up DWI ++ 0 ++ + 0
Lab set-up DWDS 0 + + + 0
4 Discussion of SIMDEUM aspects
4.1 The physically based input
The fact that SIMDEUM is based on knowledge of water-using behaviour and water appliances instead of water flow measurements means that it can be used to describe in de-tail and even predict the total and hot water demands, and can thus be used in the design phase. SIMDEUM provides insight into the influence of changes in the technical speci-fications or the water-using behaviour on the total and max-imum demand, and thus provides information on where to focus water-saving campaigns.
Furthermore, SIMDEUM generates customised drinking water demand patterns that can be revised or updated reg-ularly without the need to perform extended demand mea-surements. The regular survey of Dutch residential drinking water use suffices.
4.2 The stochastic aspect
The stochastic aspect of SIMDEUM provides the user with multiple possible demands. This is essential in designing the DWDSs and DWIs to determine the maximum demands that
occur only once per year and has much added value in mod-elling water quality in the DWDS to determine the true resi-dence times and flow direction reversals (including the varia-tion between days) and how these may influence the interpre-tation of sensors. The important conclusion of these studies is that the variability in the demand adds extra understanding which is not reached with deterministic demand models.
4.3 The small spatial and temporal scale
Table 2.A summary of the requirements for the demand models for various types of applications.
Applications Temporal
scale
Spatial scale Need for re-semblance to real-time data
Does variabil-ity need to be in-cluded (i.e. stochastic de-mand patterns)?
Is a model based on
historical data ac-ceptable? Water quan-tity mod-elling Hydraulic network model: maximum flow velocities Hydraulic network model: flow direc-tion reversals
1–5 min End pipes: single home Loops: 10
Depends on whether a general or specific view is required.
Yes, over time (day, season) and type (home, school).
Only if available at a suitable timescale and with variation over time. Demand pattern library
15–60 min > 500 homes Can be lim-ited.
No Yes
Leakage 15–60 min > 500 homes Must be high during night flow.
Yes, in order to discern natural variation from leaks.
Only if leak-free historical data are available.
Transients 1 s 1–200 homes Can be
lim-ited, as long as variation is there.
No Only if available
at a suitable timescale. Water quality modelling Residence time Chlorine decay Temperature Bacterial growth Sensor backtracing Particulate material
5 min 1–20 homes Depends on whether a general or specific view is required.
Yes, over time (day, season) and type (home, school).
Only if available at a suitable timescale and with variation over time. Design of DWDS Self-cleaning net-work
1–10 s 1–200 homes Must be high during peak hours.
Yes, 50th per-centile or 99th percentile of maximum flows.
No, during the design phase no historical data are available. Also, the design is for future demand. Design of DWI Cold water Hot water Fit-for-purpose source
The tap; dis-cern cold and hot water Prediction of future demands Design Water-saving ef-fect Robustness check of DWDS
15–60 min The tap; to see trend breaks
Unknown by definition.
Recommended to aim for a band-width around pre-diction.
Possibly, but not when trend breaks need to be consid-ered.
Research in the DWDS
Water quality in relation to hydraulics Lab set-up
DWI Lab set-up DWDS
1–10 s Tap and water metre
Can be lim-ited, as long as variation is there.
Yes, for sensitiv-ity studies.
temporal scale of less than 5 min (Sect. 2 in Blokker, 2010). It does not seem to make sense to model with a small temporal scale in a DWDS when the spatial scale is large.
SIMDEUM can provide insight into when a bottom-up ap-proach of demand allocation in a hydraulic network is re-quired and when a top-down approach is good enough. It was shown that, depending on the number of household connec-tions that a pipe feeds, the bottom-up approach can lead to differences in the (maximum) residence time, in the num-ber of flow direction reversals, in the amount of stagnant wa-ter and laminar flows and in the maximum flow velocities (Sect. 8 in Blokker, 2010). This type of model is required in the extremities (dead-end pipes) of the DWDS when water quality (residence time, sensor interpretation, etc.) is mod-elled.
The spatial scale of SIMDEUM is actually the tap level, which is even smaller than what is used in modelling the DWDS. This mean that hydraulics and water quality in the DWI can also be simulated in a hydraulic network model. The design of DWI pipes and hot water devices can be im-proved.
SIMDEUM can provide insight into the best temporal scale for different applications (Sect. 2 in Blokker, 2010). To determine the maximum demand for the network design, a 1 s time step is required; this, however, depends on the require-ments for the design (Buchberger et al., 2008). It was shown that for modelling residence time in the DWDS, the standard time step of 1 h is too coarse, and a time step of 15 min or less is required to accurately predict the residence time at lo-cations in the DWDS with several homes connected to it. For the locations where only a few homes are connected, a 5 min time step seems a better choice. The fact that a model with a 1 s time step was available allowed for the study of the effect of transients on discolouration issues.
4.4 The realistic results
All of the above aspects are only valid when SIMDEUM leads to realistic results. The validation of the demand pat-terns, the maximum demand values and the resulting res-idence times shows that the SIMDEUM results are real-istic. The advantage is that this allows for the use of the SIMDEUM patterns in laboratory set-ups, such as the DWI lab set-up at TU Delft (Vreeburg et al., 2012) or the Vitens scale model of a DWDS (KWR, 2015).
Realistic results also enable the use of the model results instead of expensive measurements to estimate maximum flows when studying the effect of hydraulics over time on the discolouration risk, to estimate contact times when studying microbial growth or to have a theoretical reference for night use when detecting leakage.
4.5 Summary
Table 1 summarises the importance of these aspects for vari-ous applications. In modelling residence time in the DWDS, the small spatial scale is where the SIMDEUM bottom-up
demand allocation will make a difference (++). The
tempo-ral scale required is 5 min, which is smaller than with con-ventional demand models, but the very small time step of 1 s
is not needed (+). Of course, all applications need realistic
demand patterns, but the table shows where SIMDEUM has added value compared to other demand models; for example, this is the case in leakage modelling as conventional models often do not provide leak-free reference demand patterns. At the same time, Table 1 provides an overview of the require-ments on demand models in various applications, which are made even more explicit in Table 2.
5 Conclusions
SIMDEUM, with its stochastic approach to demand simula-tion and the physical basis of its input parameters at a small temporal and spatial scale, has contributed added value to un-derstanding and simulating current and future water demand. A decade after its first introduction, the use of SIMDEUM has allowed for a better simulation of the processes in the DWDS, improvement in the design of DWIs and support for decision-making by playing a role in the development of new design guidelines. This paper provides an overview of which aspects are required for the various applications. Some appli-cations rely on the physical basis of SIMDEUM, and others rely on the stochastic nature and small temporal and spatial scale that SIMDEUM provides. This overview leads to an understanding of the requirements for demand models in var-ious applications (Table 1).
SIMDEUM is a versatile model that has been used in vari-ous fields of application, and it is expected that more is still to come. The fields of application are not restricted to the water cycle and extend to the water–energy nexus and the circular economy concept.
Data availability. No data sets were used in this article.
Competing interests. The authors declare that they have no conflict of interest.
Edited by: Abraham
Reviewed by: two anonymous referees
References
Agudelo-Vera, C. M.: Dynamic water resource management for achieving self-sufficiency of cities of tomorrow, PhD, Wageinin-gen University, 2012.
Agudelo-Vera, C., Pieterse-Quirijns, E. J., Scheffer, W., and Blokker, E. J. M.: New method to design domestic water sys-tems, REHVA Journal, 2013a.
Agudelo-Vera, C. M., Keesman, K. J., Mels, A. R., and Rijnaarts, H. H. M.: Evaluating the potential of improving residential water balance at building scale, Water Res., 47, 7287–7299, 2013b. Agudelo-Vera, C., Blokker, E. J. M., Büscher, C. H., and en
Vree-burg, J. H. G.: Analysing the dynamics of transitions in residen-tial water consumption in the Netherlands, Water Science and Technology: Water Supply, 14.5, 717–727, 2014a.
Agudelo-Vera, C., Blokker, E. J. M., Pieterse-Quirijns, E. J., and Scheffer, W.: Water and energy nexus at the building level, RE-HVA European RE-HVAC Journal, January, 2014b.
Agudelo-Vera, C., Blokker, M., Vreeburg, J., Vogelaar, H., Hil-legers, S., and van der Hoek, J. P.: Testing the Robustness of Two Water Distribution System Layouts under Changing Drinking Water Demand, J. Water Res. Pl.-ASCE, 142, 05016003, 2016.
Blok, M. M. J.: Spatio-temporal modelling of drinking water con-sumption in Amsterdam, MSc, Laboratory of Geo-Information Science and Remote Sensing, Wage
Blokker, E. J. M.: Stochastic water demand modelling for a better understanding of hydraulics in water distribution networks, PhD, Delft University of Technology, 212 pp., 2010.
Blokker, E. J. M.: Modelleren van afnamepatronen; beschrijv-ing en evaluatie van simulatiemodel SIMDEUM, Kiwa N.V., Nieuwegein, 2006. iningen University, 81 pp., 2016.
Blokker, E. J. M. and Agudelo-Vera, C. A.: Doorontwikkeling SIMDEUM, KWR, NieuwegeinBTO 2015.210(s), 2015. Blokker, E. J. M. and Pieterse-Quirijns, E. J.: Modeling temperature
in the drinking water distribution system, Journal – American Water Works Association, 105, E19–E29, 2013.
Blokker, E. J. M., Buchberger, S. G., Vreeburg, J. H. G., and van Dijk, J. C.: Comparison of water demand models: PRP and SIMDEUM applied to Milford, Ohio, data, WDSA 2008, Kruger National Park, South Africa, Augsut 2008, 2008a.
Blokker, E. J. M., Vreeburg, J. H. G., Buchberger, S. G., and van Dijk, J. C.: Importance of demand modelling in network wa-ter quality models: a review, Drink. Wawa-ter Eng. Sci., 1, 27–38, doi:10.5194/dwes-1-27-2008, 2008b.
Blokker, E. J. M., Vreeburg, J. H. G., Beverloo, H., Klein Arfman, M., and van Dijk, J. C.: A bottom-up approach of stochastic de-mand allocation in water quality modelling, Drink. Water Eng. Sci., 3, 43–51, doi:10.5194/dwes-3-43-2010, 2010a.
Blokker, E. J. M., Vreeburg, J. H. G., Schaap, P. G., and van Dijk, J. C.: The self-cleaning velocity in practice, WDSA 2010, Tuscon, AZ, 2010b.
Blokker, E. J. M., Vreeburg, J. H. G., and van Dijk, J. C.: Simulating residential water demand with a stochastic end-use model, J. Wa-ter Res. Pl.-ASCE, 136, 19–26, doi:10.1061/(ASCE)WR.1943-5452.0000002, 2010c.
Blokker, E. J. M., Beverloo, H., Vogelaar, A. J., Vreeburg, J. H. G., and van Dijk, J. C.: A bottom-up approach of stochastic demand allocation in a hydraulic network model; a sensitiv-ity study of model parameters, J. Hydroinform., 13, 714–728, doi:10.2166/hydro.2011.067, 2011a.
Blokker, E. J. M., Pieterse-Quirijns, E. J., Vreeburg, J. H. G., and van Dijk, J. C.: Simulating Nonresidential Water Demand with a Stochastic End-Use Model, J. Water Res. Pl.-ASCE, 137, 511– 520, 2011b.
Blokker, E. J. M., Schaap, P. G., and Vreeburg, J. H. G.: Comparing the fouling rate of a drinking water distribution system in two different configurations, CCWI 2011 Urban Water Management: Challenges and Opportunities, Exeter, 2011c.
Blokker, E. J. M., Vreeburg, J., and Speight, V.: Residual chlorine in the extremities of the drinking water distribution system: the in-fluence of stochastic water demands, 12th International Confer-ence on Computing and Control for the Water Industry, Perugia, Italy, 2013.
Blokker, E. J. M., Horst, P., Moerman, A., Mol, S., and Wennekes, R.: Haalbaarheid van maatregelen tegen ongewenste opwarming van drinkwater in het leidingnet – TKI Project Calorics, KWR, NieuwegeinKWR 2014.057, 63, 2014a.
Blokker, E. J. M., Büscher, C., Palmen, L. J., and Agudelo-Vera, C.: Strategic planning of drinking water infrastructure: a conceptual framework and building blocks for drinking water companies, KWR, NieuwegeinBTO 2015.048, 2015.
Blokker, E. J., Furnass, W., Machell, J., Mounce, S., Schaap, P., and Boxall, J.: Relating Water Quality and Age in Drinking Wa-ter Distribution Systems Using Self-Organising Maps, Environ-ments, 3, 10, 2016.
Blokker, M., Vloerbergh, I., and Buchberger, S.: Estimating peak water demands in hydraulic systems II – Future trends, WDSA 2012, Adelaide, Australië, 2012, 1138–1147, 2012.
Buchberger, S. G., Carter, J. T., Lee, Y. H., and Schade, T. G.: Random demands, travel times, and water quality in dead ends, AWWARF, Denver, Colorado, 2003.
Buchberger, S. G., Blokker, E. J. M., and Vreeburg, J. H. G.: Sizes for Self-Cleaning Pipes in Municipal Water Supply Systems, WDSA 2008, Kruger Park, South Africa, August 2008, 2008. Creaco, E., Blokker, M., and Buchberger, S.: Models for Generating
Household Water Demand Pulses: Literature Review and Com-parison, J. Water Res. Pl.-ASCE, 04017013, 2017.
Donkor, E. A., Mazzuchi, T. A., Soyer, R., and Alan Roberson, J.: Urban water demand forecasting: review of methods and models, J. Water Res. Pl.-ASCE, 140, 146–159, 2012.
Fischer, C.: Stochastische Simulation des Wasserbedarfs in Trinkwasserverteilungsnetzen mit SIMDEUM, Diplomarbeit, Fakultät Forst-, Geo- und Hydrowissenschaften Institut für Siedlungs- und Industriewasserwirtschaft, Professur Wasserver-sorgung, Techische Universität Dresdem, 2008.
Foekema, H. and Engelsma, O.: Een ander consumptiepatroon (het waterverbruik thuis 2001), TNS NIPO, Amsterdam, 2001. ISSO-kontaktgroep: ISSO-Publicatie 55 Leidingwaterinstallaties
voor woon- en utiliteitsgebouwen, herziene versie 2013, 2e druk 2015 Edn., Stichting ISSO, Rotterdam, 2015.
Jacobs, H. E.: A conceptual end-use model for residential water de-mand and return flow, RAU, Johannesburg, Zuid-Afrika, 2004. KWR: Hands over a scientific scale model of
the Leeuwarden distribution network to Vitens: https://www.kwrwater.nl/en/actueel/kwr-hands-over-a-, (last access: 30 June 2016), 2015.
Malinovskis, K.: Development and application of an innovative concept of domestic fire sprinkler systems, B.Sc., Institute of Heat, gas and water technologies, RIGA TECHNICAL UNI-VERSITY, 74 pp., 2013.
Moerman, A.: Drinking water temperature modeling in domestic systems, KWR/ TU-Delft, Nieuwegein, 84, 2013.
Moerman, A., Blokker, E. J. M., Vreeburg, J., and van der Hoek, J. P.: Drinking water temperature modelling in domestic sys-tems, 16th Conference on Water Distribution System Analysis, WDSA, 2014.
Mounce, S. R., Blokker, E. J. M., Husband, S. P., Furnass, W. R., Schaap, P. G., and Boxall, J. B.: Multivariate data mining for esti-mating the rate of discolouration material accumulation in drink-ing water distribution systems, IWA Journal of Hydroinformat-ics, 18, 96–114, 2016.
Pieterse-Quirijns, E. J.: Manual SIMDEUM Pattern Generator: Tool for water demand and discharge patterns for residential and non-residential buildings, KWR, NieuwegeinKWR 2014.075, 99, 2014.
Pieterse-Quirijns, E. J. and Beverloo, H.: Validatie rekenregels voor waterverbruik woontorens, KWR, NieuwegeinKWR 2013.016, 56, 2013.
Pieterse-Quirijns, E. J. and van de Roer, M.: Verbruikspatronenbib-liotheek, KWR, NieuwegeinBTO 2013.058, 106, 2013. Pieterse-Quirijns, E. J., Agudelo-Vera, C. M., and Blokker, E.
J. M.: Modelling sustainability in water supply and drainage with SIMDEUM®, CIB W062 Water supply and drainage for buidlings, Edinburgh, GB, 2012.
Pieterse-Quirijns, E. J., Beverloo, H., and van Loon, A.: Validatie rekenregels voor waterverbruik hotels, KWR, NieuwegeinKWR 2013.018, 84, 2013a.
Pieterse-Quirijns, E. J., Blokker, E. J. M., van der Blom, E., and Vreeburg, J. H. G.: Non-residential water demand model vali-dated with extensive measurements and surveys, Drink. Water Eng. Sci., 6, 99–114, doi:10.5194/dwes-6-99-2013, 2013b. Pieterse-Quirijns, I., Moerman, A., Slingerland, E., de Groote, W.,
and Blokker, E. J. M.: Sustainable design of building’s installa-tions by taking into account real drinking water use, Proc. of the 32nd CIB Conference, Eindhoven, the Netherlands, 2015. Pothof, I. W. M. and Blokker, E. J. M.: Dynamic hydraulic
mod-els to study sedimentation in drinking water networks in detail, Drink. Water Eng. Sci., 5, 87–92, doi:10.5194/dwes-5-87-2012, 2012.
Schaap, P. G. and Blokker, E. J. M.: Carefully designed measure-ments provide insight into sediment build-up in drinking wa-ter distribution systems, CCWI 2011 Urban Wawa-ter Management: Challenges and Opportunities, Exeter, 2011.
Spina, S., Sbaraglia, M., Magini, R., Russo, F., and Napolitano, F.: Studying a Hospital Distribution Network with a Stochastic End-uses Demand Model, Procedia Engineering, 89, 909–915, 2014. Van der Broek, A. and Breedveld, K.: Tijdsbestedingsonderzoek 1995 – TBO’95 [computer file], Sociaal en Cultureel planbureau, SCP, Den Haag, 1995.
van der Wielen, P.: Waarde Aeromonas en KG22 als wettelijke pa-rameters nagroei, 2015.
van Thiel, L.: Watergebruik thuis 2013, TNS NIPO, Amsterdam, 2014.
van Thienen, P., Pieterse-Quirijns, I., van de Roer, M., and Vree-burg, J.: A two-way approach to leakage determination: sophisti-cated demand modelling and discriminative demand pattern anal-ysis, WDSA conference, Adelaide, Australia, 2012.
van Thienen, P., Vries, D., de Graaf, B., van de Roer, M., Schaap, P., and Zaadstra, E.: Probalilistic backtracing of drinking water contamination events in a stochastic world, 12th International Conference on Computing and Control for the Water Industry, CCWI, Perugia, Italy, 2013.
Vreeburg, J. H. G., Blokker, E. J. M., Horst, P., and van Dijk, J. C.: Velocity based self cleaning residential drinking wa-ter distribution systems, Wawa-ter Sci. Technol., 9, 635–641, doi:10.2166/ws.2009.689, 2009.