whales: sex differences and the importance of resource abundance
.
White Rose Research Online URL for this paper:
http://eprints.whiterose.ac.uk/122200/
Version: Published Version
Article:
Ellis, Samuel, Franks, Daniel Wayne orcid.org/0000-0002-4832-7470, Nattrass, Stuart et
al. (4 more authors) (2017) Mortality risk and social network position in resident killer
whales: sex differences and the importance of resource abundance. Proceedings of the
Royal Society B: Biological Sciences. ISSN 1471-2954
https://doi.org/10.1098/rspb.2017.1313
[email protected]
https://eprints.whiterose.ac.uk/
Reuse
This article is distributed under the terms of the Creative Commons Attribution (CC BY) licence. This licence
allows you to distribute, remix, tweak, and build upon the work, even commercially, as long as you credit the
authors for the original work. More information and the full terms of the licence here:
https://creativecommons.org/licenses/
Takedown
If you consider content in White Rose Research Online to be in breach of UK law, please notify us by
rspb.royalsocietypublishing.org
Research
Cite this article:
Ellis S, Franks DW, Nattrass
S, Cant MA, Weiss MN, Giles D, Balcomb KC,
Croft DP. 2017 Mortality risk and social
network position in resident killer whales:
sex differences and the importance of resource
abundance.
Proc. R. Soc. B
284: 20171313.
http://dx.doi.org/10.1098/rspb.2017.1313
Received: 12 June 2017
Accepted: 29 September 2017
Subject Category:
Behaviour
Subject Areas:
behaviour
Keywords:
Orcinus orca
, social networks, life history,
survival analysis, fitness, sociality
Author for correspondence:
S. Ellis
e-mail: [email protected]
Electronic supplementary material is available
online at https://dx.doi.org/10.6084/m9.
figshare.c.3904918.
Mortality risk and social network position
in resident killer whales: sex differences
and the importance of resource
abundance
S. Ellis
1, D. W. Franks
2, S. Nattrass
2, M. A. Cant
3, M. N. Weiss
1, D. Giles
4,
K. C. Balcomb
4and D. P. Croft
11
Centre for Research in Animal Behaviour, University of Exeter, Exeter EX4 4QG, UK
2Department of Biology, University of York, York YO10 5GE, UK 3
Centre for Ecology and Conservation, University of Exeter in Cornwall, Penryn, Cornwall TR10 9FE, UK
4Center for Whale Research, 355 Smugglers Cove Road, Friday Harbor, WA 98250, USA
SE, 0000-0001-9019-6040; MAC, 0000-0002-1530-3077
An individual’s ecological environment affects their mortality risk, which in turn has fundamental consequences for life-history evolution. In many species, social relationships are likely to be an important component of an individual’s environment, and therefore their mortality risk. Here, we examine the relation-ship between social position and mortality risk in resident killer whales (Orcinus orca) using over three decades of social and demographic data. We find that the social position of male, but not female, killer whales in their social unit predicts their mortality risk. More socially integrated males have a significantly lower risk of mortality than socially peripheral males, par-ticularly in years of low prey abundance, suggesting that social position mediates access to resources. Male killer whales are larger and require more resources than females, increasing their vulnerability to starvation in years of low salmon abundance. More socially integrated males are likely to have better access to social information and food-sharing opportunities which may enhance their survival in years of low salmon abundance. Our results show that observable variation in the social environment is linked to variation in mortality risk, and highlight how sex differences in social effects on survival may be linked to sex differences in life-history evolution.
1. Introduction
An individual’s mortality risk, their chance of dying at a given time, has funda-mental evolutionary consequences [1]. Many aspects of life history have been shown to be linked to mortality risk such as age at first reproduction, parental care strategy and senescence [2]. Interestingly, males and females of the same species often have differing mortality risks due to their differing reproductive strat-egies [3]. For example, costly displays and intrasexual aggression increase the risk of male mortality in many mammal and bird species [4–6]. This has in turn been linked to life history; for example, higher rates of senescence have been reported in males of some polygynous species [7]. Understanding factors that govern the mor-tality risk of individuals has the potential to explain many important aspects of life history and behaviour, and why they vary between the sexes.
Social behaviour is important for many species and may affect individual mortality risk. In humans, for example, mortality risk has been linked to a variety of aspects of sociality (e.g. [8–10]). Social behaviours are usually direct, occurring between pairs or groups of individuals. However, an important feature of social behaviour is that these direct interactions form part of a complex network of inter-actions. An individual’s position within this network, their social position,
depends partly on their own interactions and partly on the interactions of others. An individual’s social position will determine in part its access to resources and social information (information that can be learnt by observation of, or inter-action with, other individuals [11–16]) and may therefore have implications for their mortality risk. Indeed, in several species social position has been linked to early life mortality risk [17–20]. However, the difficulty in collecting long-term dynamic social data means that the proximate mechanism by which sociality can affect mortality risk over the lifetime of individuals are largely unknown. To understand the ultimate processes driving the evolution of life-history strategies, and why these strategies may differ between the sexes, it is impor-tant to understand the link between social position and mortality risk.
Killer whales (Orcinus orca) are a particularly interesting species in which to study the relationship between sociality, sex, ecology and mortality risk. They are highly social: resident killer whales off the Pacific Northwest coast of the USA and Canada live in hierarchical societies [21], the social structure of which changes in different ecological conditions [22]. Social information is important to allow whales to find food, especially when resources are scarce [23], and family relationships also have important effects on the survival of individuals [24,25]. Male killer whales differ from females in their body mass [26], feeding habits [27] and likelihood of responding to social infor-mation [23]. In addition, resident killer whales have sexually divergent lifespans, with females who reach maturity predicted to live to 53, whereas males who reach maturity are unlikely to survive past 29 [25]. Killer whales are also one of only three mammals where females are known to have an evolutionary significant post-reproductive lifespan [28]. The importance of social relationships, their sexually divergent lifespans and their unusual life histories make killer whales a good species in which to study the relationship between sociality and mortality risk.
Here, we test the hypothesis that social position is linked to mortality risk in resident killer whales using 34 years of social and demographic data. Specifically, we (i) quantify the relationship between social position and survival in male and female resident killer whales and (ii) link this to resource abun-dance, to give an insight into the proximate mechanisms driving the relationship between sociality and mortality.
2. Methods
(a) Study site
This study was conducted on the southern resident killer whales inhabiting the waters off the coast of Washington State, USA and British Colombia, Canada. The population has been studied by annual photographic census undertaken by Orca Survey since 1976. In the summer, the southern residents inhabit the area around the San Juan islands, feeding almost exclusively on Chinook salmon (Oncorhynchus tshawytscha) [29,30]. The abun-dance of salmon in a given year has a significant impact on the mortality risk of resident killer whales [29,30]. The southern resi-dents are a closed population of 71–98 individuals (between 1976 and 2010), with no social or genetic exchange with other sympatric killer whale populations [31,32]. Resident killer whales inhabit a hierarchical society. The smallest unit is the matriline consisting of the offspring and grand offspring of a female [21] and neither sex disperse, staying in close association with their matriline their whole life [21]. Higher levels include
pod, community and clans, sharing broadly similar dialects and movement patterns [21].
(b) Data
Social associations were taken from the annual photographic census of whales between 1976 and 2010. Whales photographed within three body lengths (or within three body lengths of another group member) were considered to be part of the same group (elec-tronic supplementary material, S1). Association groups were defined within an encounter (an observation of a group/groups of whales; see electronic supplementary material, S1). Group sizes ranged from single individuals to aggregations of 24 whales, with a mean of 2.5 whales per group. Each whale was observed a mean (+standard error) of 31.3+0.67 times per year. Pairs of whales were observed together from 1 to 149 times per year with a mean (+standard deviation) of five (+7.9) observations per dyad. We use these association groups to construct a social network based on the ‘gambit of the group’ paradigm with the strength of association between two individuals calculated based on simple ratio indices [33,34] (see electronic supplementary material, S1). Whales in close association have the opportunity to hunt together and share food [27]. Our association measure therefore indicates the frequency with which individuals hunt, travel and socialize together. For the years 1990–2010, all data from a given year were used to calculate a single social network for each year. Between 1976 and 1989, there was a comparatively lower sampling effort and photographic data were sparser than in later years. To ensure that we had sufficient data to reliably infer social structure [33], in these early years we combined data into 2-year sampling periods to construct the social networks. The southern resident killer whales are monitored when they are inshore during the salmon runs in the summer. Over winter, they are usually further offshore and not observed. Most deaths occur over the winter. A whale is considered to have died in a given sampling period if they are not observed in the next summer (electronic supplementary material, S1).
Salmon abundance in the Pacific Northwest varies greatly between years based on the El Nin˜ o–Southern Oscillation and, more recently, fishing activity [35,36]. We use the salmon index cal-culated from test fisheries (begun in 1979) taken in the summer range of the southern resident killer whales as an estimate of salmon abundance ([37]; also used in [22,23]). The absence of data means that data from 1976 to 1978 are not included in the analysis including salmon abundance. Approximately half of all whale deaths occur in years with the lowest quartile of salmon abundance (34 of 65 deaths). For analysis, we classify the years with this lowest quartile of abundance as low salmon years, and the other years as high salmon years.
(c) Social communities
Resident killer whales preferentially associate with a small number of individuals [21]. This is reflected in the distribution of social association strength in the community [38], which is characterized by some strong bonds and many weaker bonds (mean+s.d. social differentiation, S¼1.09+0.18; electronic supplementary
material, S1). The biologically relevant social position for a whale with regard to survival and ecology is most likely to be within these smaller groups of important associates, rather than over the whole population. In this study, we therefore concen-trate on an individual’s social position within these networks of preferential associates.
We use community analysis to allow the groups of preferential associations to emerge from the patterns of social interaction. Communities were detected in each weighted annual social struc-ture using a random walk algorithm [39]. Communities were defined independently in each network (example: figure 1). These communities are a good representation of the social struc-ture of the population as a high proportion of social associations
rspb.r
oy
alsocietypublishing.org
Pr
oc.
R.
Soc.
B
284
:
20171313
are within, rather than between, communities: modularity was in the range 0.63–0.84. The killer whale population is significantly more modular than random (1000 data-stream permutations [see below], p,0.001 in all years; median modularity of per-muted datasets was 0.13 [interquartile range¼0.07–0.23]).
The assignment of individuals to communities is robust. Individ-uals assigned to the same community in the original dataset are consistently grouped together in 1000 bootstrapped replicates:
rcom¼0.81+0.01 (mean+standard deviation; electronic
sup-plementary material, S1; [40,41]). As a measure of confidence in our calculated within-community network structure, we estimated the correlation between our observed association indices and the ‘true’ association indices [38]. Our within-community association indices are a good (greater than 0.4, [38]) reflection of the ‘true’ association pattern: mean (+standard deviation) annual
r¼0.75+0.09 (electronic supplementary material, S1; [38]).
Annually, the population contained a median of six large (greater than five whales; see below) communities (range 5–9). Each large community contained an average of 11+5.9 (mean+
standard deviation) whales. Communities tend to consist of a matri-line, extended matriline or group of regularly associating matrilines. Throughout this study we use ‘community’ to refer to the small units derived from the social associations, rather than the larger separation between the northern and southern resident populations, which have also sometimes been referred to as communities [21].
(d) Quantifying social position
Social centrality is perhaps the most commonly used measure of social position. In essence, social centrality describes how well con-nected an individual is to others in their social system [33]. Social centrality therefore describes how well positioned an individual is to receive, for example, information, resources or disease from other members of their society [11–15]. In practice, an individual’s likelihood of accessing resources or information held by other indi-viduals will depend on two factors: (i) their direct connections to others, governed partly by their own social decisions, and (ii) their indirect connections to others in their community, which
partly depend on the social choices of others [42]. We use two measures to capture the indirect and direct aspects of social central-ity: closeness and degree. Closeness is the inverse of the average path length: the (weighted) number of steps from one individual to all others in the community. A high closeness indicates small number of weighted steps to all other individuals in the commu-nity and therefore a high social centrality. Degree is a simple unweighted count of a whale’s associates. This can be seen as a measure of the number of social partners an individual has and hence their potential access to information and resources held by other members of the community [33]. Closeness depends on an individual’s social position in the network and the indirect inter-actions, and the strength of the interinter-actions, it has with other individuals. In contrast, degree depends only on an individual’s direct associations. In this study, we are interested in an individ-ual’s social position within their network of close associates, their community. We therefore calculated centrality measures (community closeness and community degree) within an individ-ual’s local social community. To account for differing sizes of communities and annual populations, both measures were normalized for analysis. Measures were not calculated on commu-nities with fewer than five whales, as patterns of social connection are limited in such small groups. Additionally, as closeness is highly skewed, it was also ranked within the network before nor-malization. These two measures quantify different but related aspects of social centrality. As would be expected, the measures are correlated, but the correlation is weak and highly variable (see electronic supplementary material, S2).
(e) Statistical analysis
We use survival analysis to investigate the social factors affecting the mortality of whales over their observed lifetime. Survival analysis describes an individual’s probability of surviving beyond a specified time [43]. We analyse mortality risk using Cox proportion hazard (Cox PH) models which describe how the instantaneous risk (hereafter risk) of death occurring at a given time is affected by covariates. We use extended Cox PH
F
F
F
F
F
F
F F
M M
M M
M
M F
F
F
F
F M
F
F
F F M
M
M F F
F
F
F
F F
M M
M
F
F
M
F F
F
F
F F
F M
F F
F F
F M
M M
F
F
F
F F
F M
M
M M F
F F
M F
F
F
F M M
M
M M M
M
F F
M M
F
M
M F
F
M M
F
[image:4.595.116.484.40.325.2]F
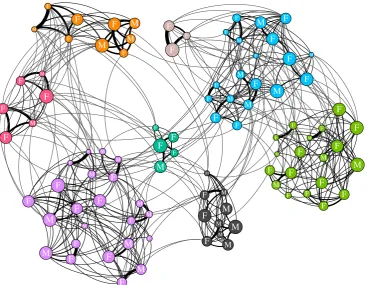
Figure 1.
An example annual social network for the southern resident killer whale population (1996). Node colour shows community membership. Node size is
scaled by a whale’s normalized rank indirect centrality (within-community closeness). Node labels represent sex: M
¼
male, F
¼
female. Edge width is based on
the simple rate index between two whales. Network visualized in Gephi.
rspb.r
oy
alsocietypublishing.org
Pr
oc.
R.
Soc.
B
284
:
20171313
models to investigate how a whale’s probability of survival is affected by their position within the social network, which can change with time. For each Cox PH model we report the estimated hazard ratio (Haz.: calculated as the exponential of the model coeffi-cient). A hazard ratio of exactly 1 indicates no differences in risk of mortality as the variable changes; a hazard ratio of less than 1, there-fore, indicates a decreasing risk of mortality with a higher value of the variable. The hazard ratio is directly equivalent to increases (or decreases) in mortality risk per unit of variable i.e. a hazard ratio of 0.25 indicates a 75% decrease in the risk of mortality per unit of variable. Generalized linear mixed-effect models (GLMMs) were used for analyses not investigating survival. All GLMMs have a binomial error structure with whale identity as a random effect.
To account for the inherent autocorrelation in network data, we used permutations to produce a null distribution to compare to the observed data. Unless indicated otherwise, analyses presented here are based within social communities. For this within-community analysis, we used 10 000 within-community node permutations to produce the null models (see electronic supplementary material, S1). When analysing at the population level (rather than the within-community level), we used 10 000 data-stream permu-tations to produce the null models (indicated by superscriptd.s.by the test name; see electronic supplementary material, S1). Addition-ally within each permutation, for whales of unknown sex we assigned a sex at random with 1000 imputations per null model. The mean network statistic of these 1000 sex imputations was used as the network statistic for that iteration of the broader network permutation. Permuted null models were created for all Cox PH models [15], and GLMMs analysing networked data. For each per-mutation of the data the model (Cox PH or GLMM) is applied to the randomized data. These permuted data are used to create a null distribution of the test statistic which is then compared to the observed value [33]. For permuted analyses, reportedpvalues indi-cate the number of times the simulated test statistic was greater than or equal to the observed test statistic (sample included in the numer-ator and denominnumer-ator [44]). For analysis not including network statistics, permutations were not used (indicated by the superscript
n.pby the test name). All analyses were performed in R using the
igraph, ggplot2, lme4 and survival packages.
3. Results
(a) Sex, centrality and survival
Within social communities, both direct and indirect social cen-trality significantly relates to the survival probability of male,
but not female killer whales. Males with a higher community closeness (a measure of indirect centrality) have a significantly lower mortality risk than whales with a lower community clo-seness (Haz.¼0.33+0.2; Cox PH,z¼21.67, events (e)¼41,
p¼0.0366; figure 2a). In contrast, the survival of female killer
whales is unrelated to their closeness centrality (Haz.¼
1.06+0.72; Cox PH,z¼0.03, e¼40, p¼0.6924; figure 2b).
Similarly, males associating with a larger number of individ-uals in their community (within-community degree) have a significantly lower mortality risk than individuals with fewer associates (Haz.¼0.21+0.14; Cox PH, z¼21.95, e¼41,
p¼0.0009). In contrast, female within-community degree
does not significantly influence survival (Haz.¼0.85+0.66;
Cox PH,z¼20.005,e¼40,p¼0.112). The effect of social
cen-trality on survival is not simply an artefact of social group size: network community size does not influence the survival of either sex (male, Haz.¼0.99+0.02, Cox PHd.s., z¼20.42,
n¼860, e¼41, p¼0.8529; female, Haz.¼0.406+0.26,
z¼21.76,n¼1410,e¼39,p¼0.7999).
(b) Centrality, survival and salmon
We find that both male (Haz.¼0.10+0.09; Cox PHn.p.,
z¼22.7,n¼825,p¼0.001) and female (Haz.¼0.03+0.03;
Cox PHn.p.,z¼24.16,n¼1335,p,0.001) survival is
signifi-cantly related to salmon abundance. Salmon abundance has an important influence on the relationship between social position and male survival; in years of low salmon abundance, males with high social centrality have a lower mortality risk (community degree: Haz.¼0.002+0.006; Cox
PH, z¼23.24, e¼41, p¼0.0001; community closeness:
Haz.¼0.02+0.038; Cox PH, z¼22.28, e¼41, p¼0.014;
figure 3). In contrast, in years of higher salmon abundance, social centrality does not significantly relate to male morta-lity risk (community degree: Haz.¼0.641+0.72; Cox
PH, z¼20.24, e¼41, p¼0.06; community closeness:
Haz.¼1.03+0.92, Cox PH, z¼20.10, e¼41, p¼0.4706;
figure 3). The survival of females is not significantly related to their social centrality in years of either low salmon abun-dance (community degree: Haz.¼0.36+0.42; Cox PH,
z¼20.72, e¼39, p¼0.215; community closeness: Haz.¼
0.51+0.52; Cox PH,z¼20.53, e¼39, p¼0.3046) or high
salmon abundance (community degree: Haz.¼0.95+1.2,
1.00
male female
0.75
0.50
survi
v
al
0.25
0
0 20 40
age (years)
60 80 0 20 40
age (years)
60 80 (b)
(a)
direct centrality
1st quartile (0.6) maximum (1.0)
direct centrality
1st quartile (0.61)
[image:5.595.119.478.42.217.2]maximum (1.0)
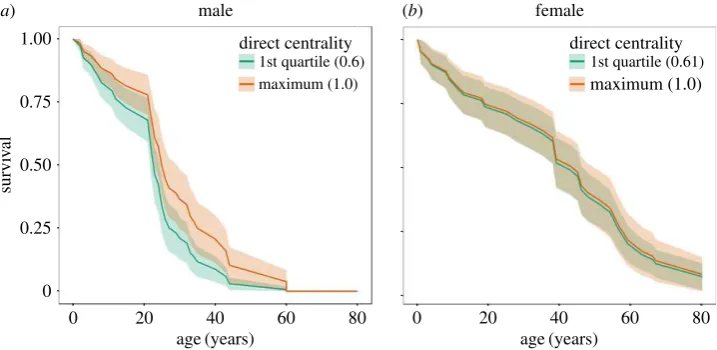
Figure 2.
The survival of male (
a
) and female (
b
) killer whales based on their network centrality predicted by Cox PH survival models. The two curves represent the
predicted survival of whales with the first quartile and maximum direct centrality (degree) of whales observed in the study. The survival of male whales is
sig-nificantly related to their centrality within their social community (Haz.
¼
0.21
+
0.14; Cox PH,
z
¼
2
1.95,
e
¼
41,
p
¼
0.0009), whereas female survival is not
(Haz.
¼
0.85
+
0.66; Cox PH,
z
¼
2
0.005,
e
¼
40,
p
¼
0.112).
rspb.r
oy
alsocietypublishing.org
Pr
oc.
R.
Soc.
B
284
:
20171313
Cox PH, z¼0.09, e¼39, p¼0.1168; community closeness:
Haz.¼1.54+1.77, Cox PH,z¼0.17,e¼39,p¼0.4706).
Interestingly, males do not have a higher degree in years of low salmon abundance (GLMM:b¼0.14,z¼0.46,
n¼742,p¼0.2449). This suggests that even though degree
is important for survival in years when salmon are scarce, males do not appear to increase their direct centrality by associating with more individuals.
4. Discussion
Our results show that the survival of male, but not female, southern resident killer whales is significantly related to their social position in their local community. Males in the most central social positions (indirect centrality) have one-third of the mortality risk of those in the least central social positions. This is linked to salmon abundance: social position is only related to male survival in years of low salmon abundance.
Social position could affect the survival of males by mediat-ing their access to resources via a number of mechanisms. For example, social information about the location of salmon has been shown to be important for resident killer whales who often follow post-reproductive females during collective move-ment, particularly during years of low salmon abundance [23]. A central social position may also increase a male’s likelihood of receiving food from other whales. Resident killer whales, particularly females, often share fish that they catch with close associates [27]. An individual with more associates may be more likely to be the recipient of these food-sharing events, increasing their food intake, and in turn increasing their probability of survival. Other social factors may affect both social position and access to resources directly. Domi-nance, for example, could mediate both an individual’s social position (e.g. [45–47]) and access to resources (e.g. [48,49]).
Social mechanisms will be most important when resources are scarce in years of low salmon abundance. Male killer whales may be more reliant than females on socially mediated resources because male resident killer whales are substantially larger than females: adult female southern resident killer whales are estimated to weigh up to 3338 kg, whereas adult males are estimated to weigh up to 4434 kg [26]. Males are
estimated to require a 25% higher energetic intake to maintain this body size [26,50]. This higher energetic requirement of males will make them more vulnerable to starvation (e.g. [51–53]). A higher reliance on social information and food sharing may explain why the survival of males, but not females, depends on their position within the social structure. Given the importance of the number of associates to the survival of male killer whales, it is interesting that they do not appear to increase their number of associates in response to low salmon abundance. There are possible behavioural and social explanations for this lack of social flexibility. Behav-iourally, animals are time-limited, and face a trade-off between behaviours, including social and foraging behaviours [54]. In times of low resource availability, foraging pressures may reduce time available for social interactions, preventing males from increasing their social centrality, even when it would increase their probability of survival. The presence of such a trade-off is supported by observations of the behaviour of resi-dent killer whales which have a lower rate of association in years of low salmon abundance [55] and a less interconnected social network [22], suggesting that they are engaging in less social behaviour. Competition for resources could also prevent males increasing their social centrality in years of low salmon abundance. Smaller group sizes in low resource conditions have been observed in a range of species (e.g. [56,57]). In a similar process, individuals may choose not to associate with a given male in times of low salmon abundance to reduce resource competition for themselves or their closer relatives. These non-exclusive mechanisms may explain why males appear unable to increase their social centrality in times of low salmon abundance.
Sociality can decrease an animal’s mortality risk in a variety of ways. By living in groups animals can, for example, decrease their risk of predation or increase their foraging efficiency [58]. Recently the importance of heterogeneity in sociality has been highlighted, and a body of work shows that animals within a population can have a wide variety of social positions and social roles [59]. The heterogeneity of social bonds can have important fitness consequences. In several species, an individ-ual’s social bonds and affiliation (rather than social position) have been shown to affect their survival [60–62], reproductive success [18,63,64] and the survival of their offspring [17,18]. In addition, infant survival has been linked to social position in
1.00
low salmon years high salmon years
0.75
0.50
survival
0.25
0
0 20
age (years)
40 60 0 20 40 60
age (years) direct centrality
1st quartile (0.6) maximum (1.0)
(b)
[image:6.595.118.481.42.219.2](a)
Figure 3.
The survival of male killer whales in years of low (
a
) and high (
b
) salmon abundance. Lines show the survival of males with different direct social
centrality as predicted by Cox PH models. Social centrality significantly relates to survival in years of low salmon abundance (Haz.
¼
0.002
+
0.006; Cox PH,
z
¼
2
3.24,
e
¼
41,
p
¼
0.0001) but not in years of high salmon abundance (Haz.
¼
0.641
+
0.72; Cox PH,
z
¼
2
0.24,
e
¼
41,
p
¼
0.06).
rspb.r
oy
alsocietypublishing.org
Pr
oc.
R.
Soc.
B
284
:
20171313
savannah baboons (Papio cynocephalus) [20]. However, to our knowledge, this is the first demonstration that social position is related to the survival of individuals in a complex society over their whole lifetime. In addition, we show that both the direct and indirect components of social position have survival implications and link these social effects to ecological con-ditions. Linking social structure and survival has many important evolutionary and ecological consequences [65]. For example, if fitness varies for different individuals within a group, we expect selection for individuals to move to these favourable social positions by changing their social strategy. However, an individual’s position in the broader social struc-ture is dependent on the behaviours and decisions of others in the population. Selection cannot, therefore, act directly on social position: it is difficult to imagine behavioural choices an individual could make to increase their indirect centrality. This highlights how behavioural phenotypes within a group interact to produce the fitness outcomes for the group members [66]. For male killer whales this means that their mortality risk partly depends on social factors outside their control which may contribute to their higher mortality rate in comparison to females. This may have fundamental life-history conse-quences, for example, by selecting for investment in reproduction in early life, and leading to an earlier onset of senescence [1,4].
In this study, we have shown that the survival of male resi-dent killer whales is related to their position within a complex social system, especially in years of low resource abundance. Most models of social and life-history evolution assume a
relatively constant and homogeneous social environment. In this study, we show that this may be an underestimation of the complexity of the evolutionary consequences of sociality, and that the heterogeneity and dynamics of social systems can have fundamental fitness consequences.
Ethics.Data were collected by the Center for Whale Research under federal permits (Marine Mammal Protection Act permit 532-1822 and/or Department of Fisheries and Oceans license 2006-08/ SARA-34) in both the United States and Canada.
Data accessibility.Data to replicate the statistical tests are available from the Dryad Digital Repository: https://doi.org/10.5061/dryad.654sm [67]. Requests for access to raw data can be directed to the authors or the Center for Whale Research (www.whaleresearch.com).
Authors’ contributions.S.E. and D.P.C. conceived the project in discussion with M.A.C., S.N. and D.W.F. S.E. conducted the analysis in discus-sion with D.W.F. and D.P.C. and with assistance from M.N.W., using data collected and managed by D.G. and K.C.B. S.E. made the figures and drafted the manuscript with input from all authors.
Competing interests.We have no competing interests.
Funding.Support for this research was provided by a grant from the NERC (NE/K01286X/1) awarded to D.P.C., D.W.F. and M.A.C., and data collection was supported by funding from Earthwatch Insti-tute and NOAA Fisheries.
Acknowledgements.We thank our colleagues for their important roles in data collection and analysis over the last four decades, particularly Michael Bigg, Dave Ellifrit, Erin Heydenrich, Astrid van Ginneken and Emma Foster. We also thank Lauren Brent and other colleagues in the Centre for Research in Animal Behaviour at the University of Exeter for useful discussions. In addition, we would like to thank the editor and three referees for their insightful and constructive comments which greatly improved the manuscript.
References
1. Hamilton WD. 1966 The moulding of senescence by natural selection.J. Theor. Biol.12, 12 – 45. (doi:10. 1016/0022-5193(66)90184-6)
2. Stearns SC. 1992The evolution of life histories. New York, NY: Oxford University Press. 3. Maklakov AA, Lummaa V. 2013 Evolution of sex
differences in lifespan and aging: causes and constraints.Bioessays35, 717 – 724. (doi:10.1002/ bies.201300021)
4. Promislow DEL. 1992 Costs of sexual selection in natural populations of mammals.Proc. R. Soc. Lond. B247, 203 – 210. (doi:10.1098/rspb.1992.0030) 5. Liker A, Sze´kely T. 2005 Mortality costs of sexual
selection and parental care in natural populations of birds.Evolution59, 890 – 897. (doi:10.1111/j.0014-3820.2005.tb01762.x)
6. Kruger DJ, Nesse RM. 2006 An evolutionary life-history framework for understanding sex differences in human mortality rates.Hum. Nat.17, 74 – 97. (doi:10.1007/s12110-006-1021-z)
7. Clutton-Brock TH, Isvaran K. 2007 Sex differences in ageing in natural populations of vertebrates.
Proc. R. Soc. B274, 3097 – 3104. (doi:10.1098/rspb. 2007.1138)
8. Berkman LF, Syme SL. 1979 Social networks, host resistance and mortality: a nine year follow-up study of Alameda County residents.
Am. J. Epidemiol.109, 186 – 204. (doi:10.1093/ oxfordjournals.aje.a112674)
9. House JS, Robbins C, Metzner HL. 1982 The association of social relationships and activities with mortality: prospective evidence from the Tecumseh Community health study.Am. J. Epidemiol.116, 123 – 140. (doi:10.1093/oxfordjournals.aje.a113387) 10. Pantell M, Rehkopf D, Jutte D, Syme SL, Balmes J,
Adler N. 2013 Social isolation: a predictor of mortality comparable to traditional clinical risk factors.Am. J. Public Health103, 2056 – 2062. (doi:10.2105/AJPH.2013.301261)
11. Aplin LM, Farine DR, Morand-Ferron J, Sheldon BC. 2012 Social networks predict patch discovery in a wild population of songbirds.Proc. R. Soc. B279, 4199 – 4205. (doi:10.1098/rspb.2012.1591) 12. Eames KTD, Tilston NL, Brooks-Pollock E, Edmunds
WJ. 2012 Measured dynamic social contact patterns explain the spread of H1N1v influenza.PLoS Comput. Biol.8, 1 – 8. (doi:10.1371/journal. pcbi.1002425)
13. Atton N, Hoppitt W, Webster MM, Galef BG, Laland KN. 2012 Information flow through threespine stickleback networks without social transmission.
Proc. R. Soc. B279, 4272 – 4278. (doi:10.1098/rspb. 2012.1462)
14. Craft ME. 2015 Infectious disease transmission and contact networks in wildlife and livestock.Phil. Trans. R. Soc. B370, 20140107. (doi:10.1098/rstb.2014.0107) 15. Ellis S, Franks DW, Robinson EJ. H. 2017 Ecological
consequences of colony structure in dynamic ant
nest networks.Ecol. Evol.7, 1170 – 1180. (doi:10. 1007/978-1-4614-6170-8_100727)
16. Hoppitt W, Laland KN. 2013Social learning: an introduction to mechanisms, methods, and models. Princeton, NJ: Princeton University Press. 17. Silk JB, Alberts SC, Altmann J. 2003 Social bonds of
female baboons enhance infant survival.Science 302, 1231 – 1235. (doi:10.1126/science.1088580) 18. Cameron EZ, Setsaas TH, Linklater WL. 2009 Social
bonds between unrelated females increase reproductive success in feral horses.Proc. Natl Acad. Sci. USA106, 13 850 – 13 853. (doi:10.1073/pnas. 0900639106)
19. Stanton MA, Mann J. 2012 Early social networks predict survival in wild bottlenose dolphins.PLoS ONE7, 1 – 6. (doi:10.1371/journal.pone.0047508) 20. Cheney DL, Silk JB, Seyfarth RM. 2016 Network
connections, dyadic bonds and fitness in wild female baboons.R. Soc. open sci.3, 160255. (doi:10.1098/rsos.160255)
21. Bigg MA, Olesiuk PF, Ellis GM, Ford JKB, Balcomb KC. 1990 Social organization and genealogy of resident killer whales (Orcinus orca) in the coastal waters of British Columbia and Washington State.
Reports Int. Whal. Comm.12, 383 – 405. 22. Foster EA, Franks DW, Morrell LJ, Balcomb KC,
Parsons KM, van Ginneken A, Croft DP. 2012 Social network correlates of food availability in an endangered population of killer whales,Orcinus
rspb.r
oy
alsocietypublishing.org
Pr
oc.
R.
Soc.
B
284
:
20171313
orca.Anim. Behav.83, 731 – 736. (doi:10.1016/j. anbehav.2011.12.021)
23. Brent LJN, Franks DW, Foster EA, Balcomb KC, Cant MA, Croft DP. 2015 Ecological knowledge, leadership, and the evolution of menopause in killer whales.Curr. Biol.25, 746 – 750. (doi:10.1016/j.cub. 2015.01.037)
24. Foster EA, Franks DW, Mazzi S, Darden SK, Balcomb KC, Ford JKB, Croft DP. 2012 Adaptive prolonged postreproductive life span in killer whales.Science 337, 1313. (doi:10.1126/science.1224198) 25. Croft DPet al.2017 Reproductive conflict and the
evolution of menopause in killer whales.Curr. Biol. 27, 298 – 304. (doi:10.1016/j.cub.2016.12.015) 26. Noren DP. 2011 Estimated field metabolic rates and
prey requirements of resident killer whales.Mar. Mammal Sci.27, 60 – 77. (doi:10.1111/j.1748-7692. 2010.00386.x)
27. Wright BM, Stredulinsky EH, Ellis GM, Ford JKB. 2015 Kin-directed food sharing promotes lifetime natal philopatry of both sexes in a population of fish-eating killer whales (Orcinus orca).Anim. Behav.115, 1 – 8. (doi:10.1016/j.anbehav.2016. 02.025)
28. Croft DP, Brent LJN, Franks DW, Cant MA. 2015 The evolution of prolonged life after reproduction.
Trends Ecol. Evol.30, 407 – 416. (doi:10.1016/j.tree. 2015.04.011)
29. Ford JK. B, Ellis GM. 2006 Selective foraging by fish-eating killer whalesOrcinus orcain British Columbia.
Mar. Ecol. Prog. Ser.316, 185 – 199. (doi:10.3354/ meps316185)
30. Ford JKB, Ellis GM, Olesiuk PF, Balcomb KC. 2010 Linking killer whale survival and prey abundance: food limitation in the oceans’ apex predator?Biol. Lett.6, 139 – 142. (doi:10.1098/rsbl.2009.0468) 31. Barrett-Lennard LG, Ellis GM. 2001 Population
structure and genetic variability in Northeastern Pacific killer whales: towards an assessment of population viability.DFO Can. Sci. Advis. Secr. Res. Document 2001/065.
32. Morin PAet al.2015 Geographic and temporal dynamics of a global radiation and diversification in the killer whale.Mol. Ecol.24, 3964 – 3979. (doi:10. 1111/mec.13284)
33. Whitehead H. 2008Analyzing animal societies: quantitative methods for vertebrate social analysis. Chicago, IL: University of Chicago Press. 34. Croft DP, Madden JR, Franks DW, James R. 2011
Hypothesis testing in animal social networks.Trends Ecol. Evol.26, 502 – 507. (doi:10.1016/j.tree.2011. 05.012)
35. Slaney TL, Hyatt KD, Northcote TG, Fielden RJ. 1996 Status of anadromous salmon and trout in British Columbia and Yukon.Fisheries21, 20 – 35. (doi:10.1577/1548-8446(1996)021,0020:SOA SAT.2.0.CO;2)
36. Lackey RT. 2003 Pacific Northwest salmon: forecasting their status in 2100.Rev. Fish. Sci.11, 35 – 88. (doi:10.1080/162265 10390856529)
37. PSC. 2010 Pacific Salmon Commission: test fishing. Pacific Salmon Commission. See http://www.psc.org/. 38. Whitehead H. 2008 Precision and power in the
analysis of social structure using associations.Anim. Behav.75, 1093 – 1099. (doi:10.1016/j.anbehav. 2007.08.022)
39. Pons P, Latapy M. 2005 Computing communities in large networks using random walks.Comput. Inf. Sci.10, 284 – 293. (doi:10.1007/11569596_31) 40. Lusseau D, Whitehead H, Gero S. 2008 Incorporating
uncertainty into the study of animal social networks.Anim. Behav.75, 1809 – 1815. (doi:10. 1016/j.anbehav.2007.10.029)
41. Shizuka D, Farine DR. 2016 Measuring the robustness of network community structure using assortativity.Anim. Behav.112, 237 – 246. (doi:10. 1016/j.anbehav.2015.12.007)
42. Brent LJN. 2015 Friends of friends: are indirect connections in social networks important to animal behaviour?Anim. Behav.103, 211 – 222. (doi:10. 1016/j.anbehav.2015.01.020)
43. Kleinbaum DG, Klein M. 2012Survival analysis: a self-learning text, 3rd edn. New York, NY: Springer. 44. Ruxton GD, Neuha¨user M. 2013 Improving the
reporting of P-values generated by randomization methods.Methods Ecol. Evol.4, 1033 – 1036. (doi:10.1111/2041-210X.12102)
45. Sade DS. 1972 Sociometrics ofMacaca mulatta
I. Linkages and cliques in grooming matrices.Folia Primatol.18, 196 – 223. (doi:10.1159/000155480) 46. Sueur C, Petit O, De Marco A, Jacobs AT, Watanabe
K, Thierry B. 2011 A comparative network analysis of social style in macaques.Anim. Behav.82, 845 – 852. (doi:10.1016/j.anbehav.2011.07.020) 47. Brent LJN, Heilbronner SR, Horvath JE,
Gonzalez-Martinez J, Ruiz-Lambides A, Robinson AG, Skene JHP, Platt ML. 2013 Genetic origins of social networks in rhesus macaques.Sci. Rep.3, 1042. (doi:10.1038/srep01042)
48. Schjelderup-Ebbe T. 1922 Beitra¨ge zur Sozialpsychologie des Haushuhns.Z. Psychol.88, 225 – 252.
49. Hawley PH. 1999 The ontogenesis of social dominance: a strategy-based evolutionary perspective.Dev. Rev.19, 97 – 132. (doi:10.1006/ drev.1998.0470)
50. Williams Ret al.2011 Competing conservation objectives for predators and prey: estimating killer whale prey requirements for chinook salmon.PLoS ONE6, e26738. (doi:10.1371/journal.pone.0026738) 51. Clutton-Brock TH, Albon SD, Guinness FE. 1985
Parental investment and sex differences in juvenile mortality in birds and mammals.Nature313, 131 – 133. (doi:10.1038/313131a0)
52. Nager RG, Monaghan P, Griffiths R, Houston DC, Dawson R. 1999 Experimental demonstration that offspring sex ratio varies with maternal condition.
Proc. Natl Acad. Sci. USA96, 570 – 573. (doi:10. 1073/pnas.96.2.570)
53. Le Galliard J-F, Ferrie`re R, Clobert J. 2005 Juvenile growth and survival under dietary restriction: are
males and females equal?Oikos111, 368 – 376. (doi:10.1111/j.0030-1299.2005.14163.x) 54. Cuthill IC, Houston A. 1997 Managing time and
energy. InBehavioural ecology: an evolutionary approach(eds JR Krebs, NB Davies), pp. 97 – 120. Oxford, UK: Blackwell Publishing.
55. Parsons KM, Balcomb KC, Ford JKB, Durban JW. 2009 The social dynamics of southern resident killer whales and conservation implications for this endangered population.Anim. Behav.77, 963 – 971. (doi:10.1016/j.anbehav.2009.01.018) 56. Jarman PJ. 1974 The social organisation of antelope
in relation to their ecology.Behaviour48, 215 – 267. (doi:10.1159/000155480)
57. Caraco T, Wold LL. 1975 Ecological determinants of groups sizes of foraging lions.Am. Nat.967, 343 – 352. (doi:10.1086/283001)
58. Krause J, Ruxton GD. 2002Living in groups. Oxford, UK: Oxford University Press.
59. Croft DP, Darden SK, Wey TW. 2016 Current directions in animal social networks.Curr. Opin. Behav. Sci.12, 52–58. (doi:10.1016/j.cobeha.2016.09.001) 60. Silk JB, Beehner JC, Bergman TJ, Crockford C,
Engh AL, Moscovice LR, Wittig RM, Seyfarth RM, Cheney DL. 2010 Strong and consistent social bonds enhance the longevity of female baboons.
Curr. Biol.20, 1359 – 1361. (doi:10.1016/j.cub.2010. 05.067)
61. Brent LJN, Platt ML. 2017 Family network size and survival across the lifespan of female macaques.
Proc. R. Soc. B284, 201710515. (doi:10.1098/rspb. 2017.0515)
62. Archie EA, Tung J, Clark M, Altmann J, Alberts SC. 2014 Social affiliation matters: both same-sex and opposite-sex relationships predict survival in wild female baboons.Proc. R. Soc. B281, 20141261. (doi:10.1098/rspb.2014.1261)
63. Weidt A, Hofmann SE, Ko¨nig B. 2008 Not only mate choice matters: fitness consequences of social partner choice in female house mice.Anim. Behav. 75, 801 – 808. (doi:10.1016/j.anbehav.2007.06.017) 64. Schu¨lke O, Bhagavatula J, Vigilant L, Ostner J. 2010 Social bonds enhance reproductive success in male macaques.Curr. Biol.20, 2207 – 2210. (doi:10.1016/ j.cub.2010.10.058)
65. Kurvers RHJM, Krause J, Croft DP, Wilson ADM, Wolf M. 2014 The evolutionary and ecological consequences of animal social networks: emerging issues.Trends Ecol. Evol.29, 326 – 335. (doi:10. 1016/j.tree.2014.04.002)
66. Farine DR, Montiglio PO, Spiegel O. 2015 From individuals to groups and back: the evolutionary implications of group phenotypic composition.
Trends Ecol. Evol.30, 609 – 621. (doi:10.1016/j.tree. 2015.07.005)