This is a repository copy of
Incentivizing universal safe delivery in Nepal: ten years of
experience
.
White Rose Research Online URL for this paper:
http://eprints.whiterose.ac.uk/116566/
Version: Accepted Version
Article:
Ensor, TRA orcid.org/0000-0003-0279-9576, Bhatt, H and Tiwari, S (2017) Incentivizing
universal safe delivery in Nepal: ten years of experience. Health Policy and Planning, 32
(8). czx070. pp. 1185-1192. ISSN 0268-1080
https://doi.org/10.1093/heapol/czx070
© The Author 2017. Published by Oxford University Press in association with The London
School of Hygiene and Tropical Medicine. This is a pre-copyedited, author-produced PDF
of an article published in Health Policy and Planning. The version of record, Tim Ensor,
Hema Bhatt, Suresh Tiwari; Incentivizing universal safe delivery in Nepal: 10 years of
experience, Health Policy and Planning, is available online at:
https://doi.org/10.1093/heapol/czx070.
eprints@whiterose.ac.uk https://eprints.whiterose.ac.uk/ Reuse
Items deposited in White Rose Research Online are protected by copyright, with all rights reserved unless indicated otherwise. They may be downloaded and/or printed for private study, or other acts as permitted by national copyright laws. The publisher or other rights holders may allow further reproduction and re-use of the full text version. This is indicated by the licence information on the White Rose Research Online record for the item.
Takedown
If you consider content in White Rose Research Online to be in breach of UK law, please notify us by
Title: Incentivising universal safe delivery in Nepal: ten years of experience
Authors:
*Tim Ensor PhD, University of Leeds, United Kingdom, t + 44 (0) 113 343 6908, f + 44 (0) 113 343 6997
t.r.a.ensor@leeds.ac.uk, Charles Thackrah Building , University of Leeds, 101 Clarendon Road, Leeds, LS2 9JZ
Hema Bhatt BSc, Aama Programme Adviser, NHSSP, Kathmandu, Nepal, hema.bhatt@opml.co.uk
Suresh Tiwari PhD, Country Director, OPM Nepal, Kathmandu, Nepal, Suresh.Tiwari@opml.co.uk
*Corresponding author
Keywords: maternal health; demand-side funding; maternal incentive scheme
Running title: Incentivising universal safe delivery in Nepal
Key messages:
An increase in utilisation of maternal health services is associated with the overall policy Individual elements of the policy have a differential impact on population groups and areas
The benefits of each programme are disproportionately absorbed by people living in the richer terai zone.
Demand-side payments appear to favour non-poor households while activity based supply side payments have encouraged access by poorer households
Continued improvement in access will require greater attention to access by the poor in the most remote areas.
Wordcount: 4,161
Funding: none received
Conflicts of interest: None
Acknowledgement: none
Incentivising universal safe delivery in Nepal: ten years of experience
Abstract
Background: Payments to users and providers of health services are an important ingredient in attempts to promote universal health coverage in low resource settings. The maternal health programme in Nepal explicitly recognises that ensuring universal access to safe delivery care requires policies that both ensure effective services and overcome demand-side barriers. The programme has used three innovative financing initiatives to stimulate an increase in the use of facility based delivery: the maternity incentive scheme (2005) reimbursing women for accessing a facility, activity payments in poor districts (2006) and universal free-delivery (2009). We examine the impact of these mechanisms on access to safe delivery services.
Methods: Multiple waves of the Demographic and Health Survey were merged to provide household-level cross-sectional data on maternity services. A multihousehold-level logit model was used to investigate the roll-out of the three policies across ecological zones assuming a district-wide treatment effect. An interrupted time-series approach that includes cross sectional data on deliveries at each period is used to detect the association between outcomes and policy.
Findings: The maternal Incentive programme was associated with an increase in service delivery in hill and tarai areas. A positive effect in mountain areas was detectable as a result of the supply-side payments made to facilities for delivery. While use among the non-poor increased across the country, a positive effect on the poorest population is was only present in mountain areas.
Conclusion: The beneficial impact of maternal financing policies in Nepal is skewed towards areas and households that are geographically more accessible and wealthy. Inferior services in remote areas reduce the impact of financing policies. Policy may need to be refocused on poorer, less accessible areas if improvements in access to maternal health services are to continue.
Acknowledgement
We thank two anonymous reviewers for their insightful comments on an earlier draft of this paper.
Introduction
Direct payments to users, through demand-side financing, and providers, performance based supply-side payments, through of health services forms an important ingredient of attempts to increase the uptake of health services and promote universal health coverage in low resource settings. Payments have had some success in incentivising service delivery although evidence on their cost-effectiveness is mixed (Murray et al., 2014, Witter et al., 2012).
The article is structured as follows. In the next section we describe the evolution of the scheme and published evidence on impact. The third and fourth sections describe the methods used and present findings. The final section discusses the implications of the findings for the future of the scheme.
Incentivising safe deliveries
From the late 1990s, the Nepal maternal health programme invested heavily in improving birthing facilities in the most disadvantaged areas through improvements in physical infrastructure, particularly birthing centres, training of nurse-midwives as anaesthetic assistants and strengthening blood banking (Rath et al., 2007). It was estimated that by 2004, met-need for care had reached 14% across the country (an increase from less than 5% in the mid-1990s). Differences in provision still persisted. The programme struggled to ensure that comprehensive obstetric care providing surgical and instrumental interventions, was provided across the country: according to the HMIS, in 2003 there were 2.5 hospital beds per 10,000 population in tarai and 1.27 in hills but only 0.98 in mountain areas (Ministry of Health and Population, 2004). Similarly, studies demonstrated huge differences in access to facilities. One survey found that women took on average 2.8 hours to reach a birthing facility in the tarai, 5.6 hours in hills and 8.3 hours in mountain areas (Borghi et al., 2006). Stimulating demand for services was also seen as a vital part of the strategy and some mechanisms, including loan schemes, were initiated. It was recognised, however, that further work to increase care seeking was key the overall success of the programme (Rath et al., 2007).
The maternity incentive scheme (MIS) was introduced from July 2005 following a study that suggested that costs associated with delivery were discouraging women from having a facility-based birth; reaching a facility accounted for around two-thirds of these costs (Borghi et al., 2006). A policy was quickly formulated and implemented with strong commitment from a government that was eager to use the policy to appeal to voters (Ensor et al., 2008). From July 2005, an incentive was introduced to be paid to all women delivering at public facilities. The payment to women was graduated: NPR 1,500 in mountain; NPR 1,000 in hill; and NPR 500 in tarai areas to reflect the higher costs in remoter areas (Family Health Division, 2005). Payment was designed to defray part of their costs but not fully compensate women for all expenditures incurred. .
From July 2006 the scheme, renamed the Safe delivery Incentive Programme (SDIP), facilities in the 25 districts with lowest human development (based on a district Human Development Index) were paid a flat fee of NPR 1,000 per delivery regardless of complexity or length of stay. All mountain and some of the hill districts were included. Health workers in these districts also received an incentive
payment of NPR 300 for carrying out deliveries in facilities and s own home. The latter
recognised that home deliveries were likely to continue for some time and that a priority was to make them safer. The payment was reduced to NPR 200 in January 2009 and NPR 100 in July 2012 amidst evidence of persistent but low level fraudulent claims (Family Health Division, 2005, Family Health Division, 2007, Family Health Division, 2009) . At first benefits were limited to women having two or
fewer ; this requirement was later
dropped (Family Health Division, 2007, Ministry of Health and Population Nepal et al., 2014). The scheme was broadened beyond the public sector to include community and teaching hospitals (2006), accredited NGO facilities and some for-profit private facilities (2009).
accreditation from the Ministry of Health and Population receive the same level of reimbursement (Ensor and Witter, 2008). Since government facilities receive the Aama reimbursement in addition to their usual budget while it is the only source of funding for deliveries in non-government facilities it has been argued that the scheme is biased against non-government provision (Suresh Tiwari et al., 2015). Aama was merged in 2012 with an existing but less successful incentive scheme for four antenatal care visits to capitalise on the high visibility of Aama and reduce the number of parallel schemes (Subedi et al., 2015, Adhikari et al., 2011).
A number of studies have looked at the impact of the MIS and SDIP schemes. Early evidence suggested that their implementation was slow with much variation across districts due to ignorance of schemes and delays with central level fund release (Powell-Jackson et al., 2009). There were also differences in local practice particularly around eligibility for incentives. Recent evidence suggests that knowledge of the scheme has increased substantially over time but with less impact in hard to reach areas (Bhusal et al., 2011). A quasi-experimental study that allocated women to matched treatment and control groups according to whether they knew about the scheme found that over the first three years the scheme was associated with a 4.2 percentage point increase in delivery with a skilled attendant (Powell-Jackson and Hanson, 2012). The non-poor appear to have benefited disproportionately reflecting the lack of physical accessibility to public services by poorer populations (Tim Powell-Jackson and Rebecca Wolfe, 2008).
Methods
We merged three rounds (2001, 2006 and 2011) of the NDHS to investigate the impact of the mechanisms. The programmes were rolled out in different ways across the country and we use this variation to investigate their differential impact. An interrupted time series approach that takes account of the monthly nature of births reported in the NDHS and adjusts for variation in characteristics at the individual level was used. The multivariate analysis was undertaken on NDHS data for the period 1999 to 2011, providing an analysis six years prior to the first policy (MIS) and six years afterwards. The model allows for two separate effects of each policy. First an immediate effect
- effect through a change in the slope on
the time variable. This formulation explicitly recognises that policy impact can be gradual and that its effect may not be fully felt for many months or years.
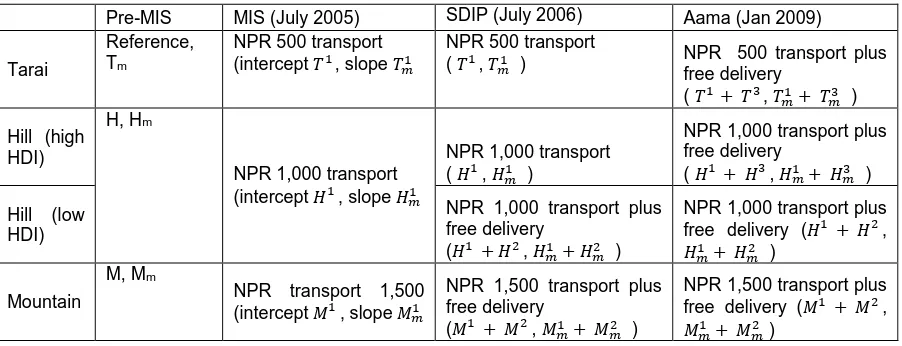
We focus on how three main outcome variables - facility based deliveries, delivery with a skilled health worker and by caesarean section - vary in response to the policies (Table 1). Skilled workers include doctors, midwives and nurses but not workers that have SBA training but no formal medical qualification.
<Table 1 about here>
The models separates the sample according to the groups in table one to examine the impact of each policy combination compared with base outcome levels that vary across ecological zones and adjusted for individual and household covariates as follows:
(1)
Where Oijm are the study outcomes for individual i in cluster j at month m; H and M are dummy
variables for hill and mountain areas (tarai is the reference category), Tm, Hm, Mm are underlying trend
outcomes in each ecological zone; the immediate effect of the introduction of the MIS is captured by
intercept variables ( ) while the gradual build-up effect are captured by trend slope-dummy
variables ( ) for periods after July 2005; similarly the effect of the SDIP intervention is
captured by intercept ( ) and trend variables ( ) for periods after July 2006 and the
effect of Aama is captured by intercept ( ) and trend variables ( ) for periods after
January 2009; Xijm is vector of covariates including asset index quintiles, parity, maternal and paternal
education, whether location of birth was rural or urban and religion. The roll-out of the programme was fragmented and uneven. This suggests that that potentially non-linear roll-out of the programme suggests that outcomes may follow linear trends. To incorporate the possibility of this non-linearity we include polynomial of degree two through five trend terms and compare with the base model using a log-likelihood test.
District specific random effects are ( ) are included to take account of area variation, a time specific
random effect term (zt) to account of correlation across time period specific variation and a
report more than one birth over the period and an individual random error ( ). The structure of the DHS, means that some births reported can occur up to five years after the actual delivery. Although an important and memorable event, it is possible that this delay could lead to a bias in reported outcome. We adjust this by incorporating a recall variable define as time period between interview and birth date into the model.
Marginal effects are calculated to assess the impact on the probability of each outcome at time of intervention in each zone and mean values of other covariates. They are computed for each intervention separately compared to a counterfactual of no intervention at the same point in time. For later interventions the counterfactual assumes the earlier, zone-specific, interventions have been applied. The overall effect, indicates the impact of all interventions combined in each zone compared to a counterfactual at the time of Aama introduction.
A necessary although not sufficient condition for a plausible causal relationship between policy and outcome in both models is that the breakpoint should occur after policy implementation. We independently test for an unknown structural breakpoint in the coefficients. This is undertaken using a series of likelihood ratio tests to identify the maximum value of the wald test statistic and implemented using the stata function estat sbsingle for a time-series in each zone separately.
Results
Descriptive statistics suggest that average outcome indicators have generally for each of the ecological zones improved over each of the main policy periods (Table 2). The improvement is most notable in the tarai and hill areas with higher human development. Caesarean section rates remain low by international standards across all periods although there is a noticeable increase in tarai areas.
<Table 2 about here>
Trends across the periods, suggest that the impact of policy builds up over time following policy implementation. Facility delivery in both tarai and hill areas is associate with a gradual increase following the start of the MIS (figure one) while there is no perceptible change in mountain areas until after the start of the SDIP. Modest increases in use of services between 2003 and 2005 may be attributed to earlier improvements on the supply side under the safer motherhood programme.
<figure 1 about here>
The multivariate analysis indicates that the starting value for facility delivery and sba outcomes were significantly lower in mountain compared to hill and tarai, while the secular increase in outcomes was significant in tarai (p<0.01) but not in other zones (Table 3).
Marginal effects examine the total percentage point impact of each policy combining the initial change in intercept with the policy-trend. Marginal effects are calculated 2 years after the initial introduction of the policy compared with a counterfactual of no policy only secular time-trend. For the MIS, a positive increase in facility delivery of 7 pp for facility delivery and between 5.2 and 10.2 pp for delivery with a skilled worker was found for hill and tarai areas. By contrast, the MIS is associated with a reduction in both outcomes in mountain areas. For the SDIP, large changes are recorded in mountain areas for all outcomes (p<0.001). No significant marginal effects are recorded for the Aama policy. A 25 pp effect for the effect of all policies combined was found in the tarai zone (p<0.001) and around 13 pp in hill (p<0.1) and mountain (p<0.001) zones. The policies appear to have had little or no effect on the rate of caesarean section.
<Table 3 about here>
Different effects of policy for the poor and non-poor are suggested by the marginal effects on facility delivery (Table 4). Outcomes for the non-poor in tarai and hill and improved largely as a result of the introduction of the MIS; the effects are large (around 30 pp), positive and significant (positive but not significant in mountain areas). For the poor, the main association was the SDIP policy in mountain areas which demonstrate a significant positive effect that underpins the overall cumulative positive effect on utilisation. For the poor in hill areas, the overall impact of the programme is slightly negative although the effects are not statistically significant.
<Table 4 about here>
The independent test for an unknown structural break in the data broadly supports the finding of structural breaks after policy implementation but at different times for each ecological zone. The test for tarai found the most likely break in April 2006 (wald=334, p<0.0001) and for hill areas in November 2006 (wald, p<0.0001), respectively 9 and 16 months after the introduction of the MIS. The most likely break in mountain areas was in December 2007 (wald 50.3, p<0.0001), 29 months after MIS and 17 months after SDIP implementation. The recall variable was found not to be significant (facility delivery p=0.87, sba p=0.393, c-section p=0.361). This suggests that any bias in reporting as a result of faded memories is relatively small. This is perhaps not surprising given that birth events including place and type of birth are likely to be extremely memorable. A log-likelihood ratio nested test suggests that inclusion of higher order polynomial trends do not add significantly to the explanatory power of the model (
Discussion
zones. While the programmes benefit all areas, the effect appears to be strongest in the tarai. This finding is likely to be underpinned by the much better transport links, concentration of referral hospitals and better retention of skilled birth attendants than in mountain and hill areas (Upreti SR et al., 2014). The most important policy in stimulating demand amongst the poor living in mountain areas are the supply-incentives introduced by the SDIP. In contrast, the MIS largely appear to benefit non-poor populations.
The uneven implementation of the programme through, for example, inadequate publicising of the scheme and problems in ensuring cash was available, suggests the effect of the policy could be gradual and possibly non-linear. The significance of the policy trend terms confirms the gradual impact. It is difficult to disentangle these effects from more complex long-term trends in outcomes. Tests of more complex non-linear time trends were not significant but we remain unsure whether the slow and sporadic pace of change is fully captured by the model parameters.
The 2009 Aama programme roll-out appears to have no significant effect on outcomes. The financing policy in Nepal combined universal demand-side payments with targeted supply-side payments in poorer areas. The latter was later rolled out as the Aama programme which forms part of the
T A
supply and demand-side interventions and so it is perhaps not surprising that no separate, significant effect of the programme could be isolated.
The Aama programme introduced higher reimbursement for provision of caesarean section. There was concern that this would incentivise surgical delivery beyond what is medically necessary. The results suggest no substantial effect of the policies on surgical delivery. A small positive overall impact is recorded for mountain areas (p=0.1) but from a very low base. Even in Tarai, the rates are not high by international standards although continue to be monitored. Costing studies suggest that reimbursement rates are not substantially higher than the costs of these services (Suresh Tiwari et al., 2015)
Reliance on retrospective NDHS survey data has a number of limitations. Perhaps the main one is the extent to which causation can be concluded from the associations. The consistency of policy association to change in outcomes was tested by running a test for a structural break. Breaks occurring before the policy suggests that changes associated with the policy are a coincidence. The test found a structural break for tarai areas early in 2006 (April) and November 2006 for hill areas. This appears to be consistent with policy changes which affected tarai areas most strongly after the MIS while in hill areas the effect was felt most strongly after SDIP began. In mountain areas, a break is not indicated until the end of 2007 reflecting the much weaker effects in these areas and the likelihood that the changes were contingent on gradual improvements on the supply side.
a finding supported in other reviews (Murray et al., 2014). Indeed we conjecture that the more modest overall improvement in mountain and hill areas was due to the lack of birthing services, trained health workers and life-saving surgical provision in these areas. The 2012 survey found that 50% of district hospitals did not provide all CEONC signal functions while 11% of health posts and 20% of sub health posts with birthing facilities had expired oxytocin (Ministry of Health and Population, 2013). It is also the case that, as suggested in the 2003 survey, although the payment in mountain areas is three times that in the tarai it only partly mitigates the financial burden on households and care remains prohibitively expensive for many (Borghi et al., 2006).
The international literature on maternal health financing mechanisms suggest a generally positive effect on use of services while the impact on quality, equity and outcomes is more equivocal (Murray et al., 2014, Morgan et al., 2013). This study reinforces these findings. Overall, the policies had a positive impact on utilisation but with variation by geography and wealth group. The Nepal mechanisms are a combination of targeted and universal. The consolidated Aama scheme is universal in focusing on all pregnant women yet differences in the scheme across areas of the country are allowed to reflect differences in utilisation barriers experienced. The positive effect on the overall and non-poor population of the policy package, particularly the MIS, in tarai and hill areas suggests that the demand-side incentives have enabled women to make use of existing services.
The effect of the policies in mountain areas is complex. While the MIS on its own had no significant effect, the SDIP exhibited a strong positive effect. Although we model these two policies separately, it is likely that the combination of the two policies was important in encouraging an increase in utilisation (with an initial negative effect of the MIS more than countered by the positive SDIP effect) and the overall impact on the poor is substantial. We conjecture, that the MIS alone was not sufficient to permit increased service uptake because of continued lack of services in health facilities. This was recognised in the assessment of the safer motherhood programme which suggested that while investments are relatively straightforward, ensuring the services are available requires a recurrent funding commitment (Rath et al., 2007). The SDIP provided a flow of funds into facilities to allow them deliver services. The non-poor also benefit from the policies but since the poor (bottom two quintiles based on national distribution) in mountain areas make up almost 60% of the population the benefits are reasonably pro-poor. More progress is still required since access by poor women to skilled birthing services in mountain areas still lag well behind access to services of those in other zones (table 2).
The lack of programme effect for the poor in hill areas is notable. Services in hill and tarai areas are generally quite crowded (HMIS suggests that bed-occupancy is double that in mountain areas) which may mean that it is more difficult for patients to receive service without additional payment. There is even some evidence that maternal patients displace other patients in the most crowded facilities (Adhikari et al., 2011). A rapid assessment of the programme suggested that despite the free provision health facilities still charge some patients for services (Mehata et al., 2012). Getting money for treatment is still mentioned by more than half of women as an impediment to obtaining maternal services (Ministry of Health and Population et al., 2012). Systems for monitoring quality remain weak with the result and long distances mean that women in many areas are unable to choose alternative providers.
of a commitment to universal health coverage. If service uptake improvements are to be maintained greater attention is required on the use of services in the poorest and most inaccessible areas, a direction that is currently being explored by policy makers. It is expected that governme N recent decision to upgrade all sub-health posts will contribute to offering delivery services closer to the poor and hard to reach areas. The trends also raise questions about the focus of demand-side interventions which have largely benefited the non-poor. Abolishing these payments because they benefit the non-poor runs the risk of making access to the poor even more unaffordable. Instead there seems to be a growing case to concentrate these incentives on the poor in poor areas in order to deliver on the promise of universal coverage.
.
References
ADHIKARI, S., PRASAI, D. & SHARMA, S. 2011. A review of demand-side financing schemes in the health sector of Nepal. Kathmandu: Nepal health Sector Support Programme.
BHUSAL, C. L., SINGH, S. P., BC, R. K., DHIMAL, M., JHA, B. K., ACHARYA, L., THAPA, P. & MAGAR, A. 2011. Effectiveness and efficiency of Aama Surakshya Karyakram in terms of barriers in accessing maternal health services in Nepal. J Nepal Health Res Counc, 9, 129-37. BORGHI, J., ENSOR, T., NEUPANE, B. D. & TIWARI, S. 2006. Financial implications of skilled
attendance at delivery in Nepal. Tropical Medicine & International Health, 11, 228-237. ENSOR, T., CLAPHAM, S. & PRASAI, D. P. 2008. What drives health policy formulation: Insights from
the Nepal maternity incentive scheme? Health Policy.
ENSOR, T. & WITTER, S. 2008. Proposed Revisions to The SDIP Strengthening a Major National Initiative for Safe Motherhood In Nepal. London: Options.
FAMILY HEALTH DIVISION 2005. Maternity Incentive Scheme Policy Guideline. Kathmandu, Nepal: Department of Health Services, Ministry of Health and Population.
FAMILY HEALTH DIVISION 2007. Safe Delivery Incentive Programme Policy Guideline. Kathmandu: Department of Health Services, Ministry of Health and Population.
FAMILY HEALTH DIVISION 2009. Aama Surakshya Programme Policy Guideline. Kathmandu: Department of Health Services, Ministry of Health and Population.
MEHATA, S., BARAL, S. C., CHAND, P. B., SINGH, D. R., POUDEL, P. & BARNETT S. 2012. Service Tracking Survey 2012. Kathmandu, Nepal MoHP.
MINISTRY OF HEALTH AND POPULATION 2004. Annual Report Department of Health Services 2059/60 (2003/04). Kathmandu: Ministry of Health and Population.
MINISTRY OF HEALTH AND POPULATION 2013. Nepal Household Survey 2012. Kathmandu, Nepal: Ministry of Health and Population, Government of Nepal.
MINISTRY OF HEALTH AND POPULATION, NEW ERA & MACRO INTERNATIONAL INC. 2012. Nepal Demographic and Health Survey 2011. Kathmandu, Nepal: Ministry of Health and Population, New ERA, and Macro International Inc.
MINISTRY OF HEALTH AND POPULATION NEPAL, PARTNERSHIP FOR MATERNAL, N. C. H., WHO &
‘ESEA‘CH W B A A F H P A S S
Nepal. Geneva: World Health Organisation.
MORGAN, L., STANTON, M. E., HIGGS, E. S., BALSTER, R. L., BELLOWS, B. W., BRANDES, N.,
COMFORT, A. B., EICHLER, R., GLASSMAN, A., HATT, L. E., CONLON, C. M. & KOBLINSKY, M. 2013. Financial incentives and maternal health: where do we go from here? J Health Popul Nutr, 31, 8-22.
MURRAY, S. F., HUNTER, B. M., BISHT, R., ENSOR, T. & BICK, D. 2014. Effects of demand-side financing on utilisation, experiences and outcomes of maternity care in low- and middle-income countries: a systematic review. BMC Pregnancy Childbirth, 14, 30.
POWELL-JACKSON, T. & HANSON, K. 2012. Financial incentives for maternal health: Impact of a national programme in Nepal. Journal of Health Economics, 31, 271-84.
POWELL-JACKSON, T., TIWARI, S., NEUPANE, B. D. & SINGH, M. 2010. An early evaluation of the Aama "Free Delivery Care" Programme. Nepal Safer Motherhood Programme.
RATH, A. D., BASNETT, I., COLE, M., SUBEDI, H. N., THOMAS, D. & MURRAY, S. F. 2007. Improving emergency obstetric care in a context of very high maternal mortality: the Nepal Safer Motherhood Project 1997-2004. Reprod Health Matters, 15, 72-80.
SUBEDI, S., KAPHLE, H. P., ACHARYA, S., GUPTA, N. & JAIN, V. 2015. Maternal incentive scheme in Nepal status of knowledge and financial benefits received by mothers on ANC incentive and safe delivery incentive program. Indian Journal of Cmmunity Health, 26, 273-277. SURESH TIWARI, HEMA BHATT, TIM ENSOR, BAL KRISHNA SUVEDI, TOMAS LIEVENS, CHRIS JAMES &
SHARAD KUMAR SHARMA 2015. Unit cost analysis of the health facility reimbursement made under the Aama Programme. . Kathmandu: Ministry of Health and Population/Family Health Division and Nepal Health Sector Support Programme.
TIM POWELL-JACKSON & REBECCA WOLFE 2008. Encouraging women to use professional care at childbirth. Does Nepal's Safe Delivery Incentive Programme work? . Institute of Child Health, London: Towards 4+5 Research Programme Consortium.
UPRETI SR, BARAL S, LAMICHHANE P, KHANAL MN, TIWARI S, TANDAN M, H, E., LEVINS & RAPIS, T. 2014. Assessment of the Demand Side Financing Scheme: Aama and 4 ANC programmes (The seventh Rapid Assessment). Kathmandu, Nepal: Ministry of Heath and Population; Nepal Health Sector Support Programme and Health Research and Social Development Forum.
WITTER, S., FRETHEIM, A., KESSY, F. L. & LINDAHL, A. K. 2012. Paying for performance to improve the delivery of health interventions in low- and middle-income countries. Cochrane Database Syst Rev, 2, CD007899.
Table 1: evolution of main policy changes (policy variables used in multivariate analysis in brackets)
Pre-MIS MIS (July 2005) SDIP (July 2006) Aama (Jan 2009)
Tarai
Reference, Tm
NPR 500 transport (intercept , slope
NPR 500 transport
( , ) NPR 500 transport plus
free delivery
( , )
Hill (high HDI)
H, Hm
NPR 1,000 transport (intercept , slope
NPR 1,000 transport ( , )
NPR 1,000 transport plus free delivery
( , )
Hill (low HDI)
NPR 1,000 transport plus free delivery
( , )
NPR 1,000 transport plus
free delivery ( ,
)
Mountain
M, Mm
NPR transport 1,500 (intercept , slope
NPR 1,500 transport plus free delivery
( , )
NPR 1,500 transport plus
free delivery ( ,
Table 2: Outcome indicators over the main policy periods (proportion of total births)
Full sample Bottom two quintiles
Pre-MIS
MIS (July 2005)
SDIP (July 2006)
Aama (Jan
2009)
Pre-MIS MIS (July 2005)
SDIP (July 2006)
Aama (Jan 2009)
Tarai Facility delivery 15.6% 26.6% 41.2% 56.1% 5.9% 11.3% 12.5% 27.5%
With skilled provider 17.2% 27.8% 43.3% 56.1% 6.8% 10.5% 12.5% 25.5%
Caesarean section 1.0% 1.8% 2.3% 4.5% 0.0% 1.2% 0.0% 0.0%
Hill (high
HDI) Facility delivery 18.3% 25.2% 33.8% 46.1% 5.8% 2.6% 12.6% 14.3%
With skilled provider 20.1% 26.3% 33.3% 43.1% 7.0% 3.4% 10.6% 11.8%
Caesarean section 1.7% 2.2% 3.0% 3.5% 0.7% 0.0% 0.5% 0.0%
Hill (low HDI) Facility delivery 5.0% 12.6% 20.7% 28.2% 2.9% 4.3% 11.6% 13.2%
With skilled provider 5.6% 13.5% 21.3% 27.0% 3.5% 5.2% 11.5% 12.4%
Caesarean section 0.4% 0.0% 0.3% 0.8% 0.2% 0.0% 0.0% 0.0%
Mountain Facility delivery 5.8% 12.7% 13.7% 29.6% 3.5% 7.8% 5.3% 16.0%
With skilled provider 6.5% 15.3% 15.0% 27.6% 4.1% 8.5% 5.7% 13.8%
Table 3: Pooled interrupted time series analysis of NDHS
Facility
delivery
Delivery with skilled worker
C-section
Coef. SE Coef. SE Coef. SE
Policy variables
Hill (dummy) - 0.157 0.241 - 0.287 0.231 1.165 0.53 **
Mountain (dummy) - 1.102 0.417 *** - 1.100 0.385 *** 1.063 0.97
Tarai (time-trend) 0.005 0.002 ** 0.000 0.002 0.013 0.01 **
Hill (time-trend) 0.003 0.003 0.003 0.003 - 0.005 0.01
Mountain (time-trend) 0.009 0.007 0.006 0.007 - 0.022 0.02
MIS-dummy (Tarai) 0.222 0.189 0.326 0.191 * - 0.572 0.49
MIS-dummy (hill) - 0.092 0.241 - 0.040 0.221 0.051 0.54
MIS-dummy (mountain) 1.329 0.591 ** 1.386 0.584 ** -10.755 873.28
MIS-slope (Tarai) 0.017 0.007 ** 0.022 0.007 *** - 0.007 0.02
MIS-slope (hill) 0.034 0.010 *** 0.021 0.009 ** 0.012 0.02
MIS-slope (mountain) - 0.165 0.079 ** - 0.146 0.079 * 0.052 110.29
SDIP-dummy (hill) 0.435 0.425 0.588 0.418 - 1.684 1.59
SDIP-dummy (mountain) 0.730 0.549 0.623 0.543 9.447 685.99
SDIP-slope (hill) - 0.018 0.014 - 0.014 0.013 0.023 0.05
SDIP-slope (mountain) 0.184 0.078 ** 0.158 0.078 ** 0.033 110.29
Aama-dummy (Tarai) 0.211 0.274 0.150 0.264 0.992 0.51 *
Aama-dummy (mountain) - 0.299 0.345 - 0.284 0.339 0.378 0.65
Aama-slope (Tarai) 0.004 0.015 - 0.005 0.017 - 0.030 0.03
Aama-slope (mountain) - 0.011 0.020 0.002 0.019 - 0.024 0.04
Observations (N) 14,214 14,453 14,007
Marginal effects (after 24 months, percentage point changes)
MIS
Tarai 7.70 0.02 *** 10.20 0.02 *** - 0.50 0.00 **
Hill 7.80 0.02 *** 5.20 0.02 *** 0.20 0.00
Mountain - 6.30 0.02 *** - 7.81 0.03 *** - 0.09 0.00
SDIP
Hill (low hdi areas) 0.02 0.03 2.20 0.04 - 0.34 0.00
Mountain 75.50 0.16 *** 70.00 0.22 *** 94.99 97.58
Aama
Tarai 3.00 0.04 0.20 0.04 0.50 0.02
Hill - 3.60 0.04 - 2.40 0.05 - 0.10 0.00
Cumulative effect
Tarai 25.50 0.04 *** 28.10 0.04 *** - 0.84 0.01
Hill 12.80 0.07 * 12.30 0.07 * 0.10 0.01
Mountain 13.30 0.06 ** 10.00 0.05 ** 1.97 0.01 *
Notes:
Mixed effects models: likelihood ratio test supported use of household, time period and district level
effects.
Statistically significant at: *** 1%, ** 5% and * 10% level
C -urban), wealth, religion, birth
Table 4: Marginal effects (percentage point changes) of policies on facility delivery for poor and non-poor (after 24 months)
Poor Non-Poor
Coef. SE Coef. SE
MIS
Tarai 1.60 0.026 11.20 0.027 ***
Hill 3.10 0.015 ** 13.10 0.039 ***
Mountain - 4.43 0.011 *** - 22.50 0.071 ***
SDIP
Hill (low hdi areas) - 0.50 0.018 - 9.90 0.056 *
Mountain 89.00 0.128 *** 75.10 0.099 ***
Aama -
Tarai 6.00 0.139 3.00 0.071
Hill - 4.40 0.014 *** - 0.50 0.095
Cumulative effect
Tarai 14.80 0.073 ** 30.10 0.049 ***
Hill - 3.10 0.019 * 29.80 0.112 ***
Mountain 8.10 0.045 * 17.60 0.184
Poor defined as bottom two and non-poor top two wealth quintiles.
Statistically significant at: *** 1%, ** 5% and * 10% level
F ig u re o n e : tr e n d s i n fac ilit y d e liv e ry b y z o n e 0 % 1 0 % 2 0 % 3 0 % 4 0 % 5 0 % 6 0 % 7 0 % 8 0 %
1, 1999 5, 1999
9, 1999
1, 2000 5, 2000
9, 2000 1, 2001
5, 2001 9, 2001
1, 2002
5, 2002 9, 2002
1, 2003 5, 2003
9, 2003
1, 2004 5, 2004
9, 2004 1, 2005
5, 2005 9, 2005
1, 2006
5, 2006 9, 2006
1, 2007 5, 2007
9, 2007
1, 2008 5, 2008
9, 2008 1, 2009
5, 2009
9, 2009 1, 2010
5, 2010 9, 2010
1, 2011
[image:18.595.447.766.65.514.2]