Blinded by the light: on the relationship between CO first overtone
emission and mass accretion rate in massive young stellar objects
J. D. Ilee,
1‹R. D. Oudmaijer,
2H. E. Wheelwright
3and R. Pomohaci
2 1Institute of Astronomy, Madingley Road, Cambridge CB3 0HA, UK2School of Physics and Astronomy, EC Stoner Building, University of Leeds, Leeds LS2 9JT, UK 3Max-Planck-Institut f¨ur Radioastronomie, Auf dem H¨ugel 69, D-53121 Bonn, Germany
Accepted 2018 April 3. Received 2018 April 3; in original form 2017 October 27
A B S T R A C T
To date, there is no explanation as to why disc-tracing CO first overtone (or ‘bandhead’) emission is not a ubiquitous feature in low- to medium-resolution spectra of massive young stellar objects (MYSOs), but instead is only detected towards approximately 25 per cent of their spectra. In this paper, we investigate the hypothesis that only certain mass accretion rates result in detectable bandhead emission in the near-infrared spectra of MYSOs. Using an analytic disc model combined with an LTE model of the CO emission, we find that high accretion rates (10−4Myr−1) result in large dust sublimation radii, a larger contribution to theK
-band continuum from hot dust at the dust sublimation radius, and therefore correspondingly lower CO emission with respect to the continuum. On the other hand, low accretion rates (10−6Myr−1) result in smaller dust sublimation radii, a correspondingly smaller emitting
area of CO, and thus also lower CO emission with respect to the continuum. In general, moderate accretion rates produce the most prominent, and therefore detectable, CO first overtone emission. We compare our findings to a recent near-infrared spectroscopic survey of MYSOs, finding results consistent with our hypothesis. We conclude that the detection rate of CO bandhead emission in the spectra of MYSOs could be the result of MYSOs exhibiting a range of mass accretion rates, perhaps due to the variable accretion suggested by recent multi-epoch observations of these objects.
Key words: accretion, accretion discs – circumstellar matter – stars: formation – stars: mas-sive – stars: pre-main-sequence.
1 I N T R O D U C T I O N
Massive stars play a central role in many areas of astrophysics. As a result, their formation has been the subject of intensive study. In the past, it was not clear whether massive stars could form via disc accre-tion like their lower mass counterparts (Zinnecker & Yorke2007). Recent radiation and hydrodynamic simulations have demonstrated that in fact, discs are a crucial ingredient of massive star formation (Krumholz et al.2009; Kuiper et al.2011; Klassen et al. 2016; Rosen et al.2016; Harries, Douglas & Ali2017). However, study-ing these discs is difficult due to the embedded nature of massive young stellar objects (MYSOs) and the fact that they are generally located at kilo-parsec distances.
There are many indirect indications of discs around MYSOs (see the review of Beltr´an & de Wit2016). Evidence of outflows driven by MYSOs, both in terms of ionized and molecular jets (Davis et al.2004; Guzm´an, Garay & Brooks2010; Purser et al.2016)
E-mail:[email protected]
and molecular outflows (Beuther et al.2002; Zhang et al.2005; Cunningham et al.2016), suggest that MYSOs are accreting ma-terial. On scales of 1000s of au and larger, there are suggestions of rotating structures that could be feeding a circumstellar disc (so called toroids, e.g. Cesaroni et al.2005; Beuther & Walsh2008; Beltr´an et al.2011; Maud et al.2017), but on smaller scales there are only a handful of objects that appear consistent with discs in Keplerian rotation (e.g. Johnston et al.2015; Ilee et al.2016). How-ever, examining the accretion processes that occur on au-scales towards massive young stars using spatially resolved observations is simply not possible with current instrumentation. Hence, indirect observational methods must be employed.
Using integral-field spectroscopy, Davies et al. (2010) found ev-idence that the MYSO W33A drives a bipolar wind traced by Brγ
cir-cumstellar discs (Follert et al.2010; Kraus et al.2010; de Wit et al. 2011; Grellmann et al.2011; Boley et al.2013).
Despite the accumulating evidence for the presence of discs around MYSOs, the properties of such discs, such as the accre-tion rate through them, remain largely unknown. This is in part because the interferometric observations mentioned above gener-ally trace the distribution of dust in the circumstellar environments of MYSOs, while accretion will occur through an inner gaseous disc. There are few direct tracers of such discs. MYSOs often ex-hibit Brγ emission, a tracer of ionized gas, but it has been shown that this can originate in outflows (Davies et al.2010), and thus does not provide a unique diagnostic of inner disc conditions. An-other emission feature that is seen in the spectra of MYSOs is the ro-vibrational CO v = 2–0 first overtone (or ‘bandhead’) emis-sion. This emission requires warm (T=2500–5000 K) and dense (n>1011cm−3) gas. These are the conditions expected in the inner
regions of circumstellar discs and thus this emission has often been used as a tracer of discs (Carr1989; Calvet et al.1991; Chandler, Carlstrom & Scoville1995; Najita et al.1996).
It has been shown that the appearance of the CO bandhead emis-sion of MYSOs can be reproduced using a model of emisemis-sion from a circumstellar disc in Keplerian rotation (Bik & Thi2004; Blum et al.2004; Wheelwright et al.2010; Ilee et al.2013). Such studies provided the first evidence of gaseous circumstellar discs surround-ing MYSOs. Furthermore, this emission allows us to probe the conditions of such discs for the first time. In Ilee et al. (2013), we demonstrate that the properties of the disc models that best fit the CO bandhead emission of MYSOs are generally those of discs of several au in size, interior to the dust sublimation radius and with temperature and surface density gradients approximately consistent with those expected of flat accretion discs. However, we found that simple models of accretion discs were unable to fit the bandhead profiles satisfactorily, instead requiring the freedom of an analytic model to adequately reproduce the emission. Furthermore, there is currently no explanation as to why CO bandhead emission is not a ubiquitous feature in the spectra of MYSOs. Instead, it is only present in the spectra of approximately 25 per cent of MYSOs (Cooper et al.2013; Pomohaci et al.2017). If CO bandhead emis-sion traces discs, it could be inferred that the MYSOs that do not exhibit this emission do not possess discs, contrary to expectations. It is conceivable that, in order for CO emission to be observed, the inclination of MYSOs is required to be close to face on. How-ever, the distribution of inclinations of MYSOs with CO bandhead emission reported in Ilee et al. (2013) exhibits no preference for low values. In addition, CO emission has been identified from objects that are known to be viewed close to edge-on (e.g. MWC 349, Kraus et al.2000). It is also possible that the objects with CO emission represent a different evolutionary stage of MYSOs than those with-out. However, Ilee et al. (2013) determined that the objects with and without CO emission appear no different in terms of their NIR and MIR colours, suggesting the objects with CO bandhead emission are representative of the MYSO population as a whole. Therefore, as yet, the properties of the MYSOs that possess CO bandhead emission do not indicate what dictates whether or not a particular MYSO will exhibit this emission in its spectrum.
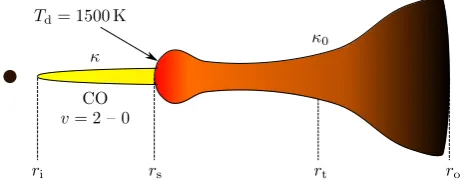
[image:2.595.313.545.61.154.2]Large-scale surveys of MYSOs have shown that their properties such as bolometric luminosity and surrounding extinction can be varied (Cooper et al.2013). This is suggestive that the MYSOs that comprise these surveys exhibit a range of stellar properties, and importantly, mass accretion rates. It has been predicted that models of circumstellar discs of MYSOs can be unstable (Krumholz, Klein & McKee2007) and that the accretion rate in these discs can be
Figure 1. A representative schematic diagram of the disc model considered for this work. The disc is split into three radial zones. The first radial zone (between the inner radiusriand the dust sublimation radiusrs) is considered to be purely gaseous with opacityκ(see equation 1). The second radial zone (betweenrs and the transition radiusrt) is dominated by viscous heating with opacityκ0. The final radial zone (betweenrtand the outer radiusro) is dominated by radiative heating, also with opacityκ0. Hot dust close to the sublimation radius is represented by a blackbody emitting at 1500 K. variable (Kuiper et al.2011). Such an interpretation is supported by recent observations of variability in MYSOs, observed at infrared (Caratti o Garatti et al.2017) and also submillimetre wavelengths (Hunter et al.2017). It is therefore reasonable to assume that any given MYSO can exhibit a range of accretion rates across its life-time.
In this paper, we assess the hypothesis that only certain accretion rates produce detectable CO bandhead emission, which could then explain the detection rate of CO bandhead emission in the spectra of MYSOs. We use an analytic model of an accretion disc coupled with our model of CO ro-vibrational emission to examine the effect of changing the accretion rate on CO bandhead emission from such a disc. Section 2 describes the disc model we utilize in this work. Section 3 details the application of this model to a situation repre-senting an accreting MYSO. We discuss our findings in Section 4 and conclude the paper in Section 5.
2 M O D E L L I N G A P P R OAC H
Since we aim to assess the continuum and CO bandhead for a range of stellar properties and accretion rates, the ideal model is one that requires minimal computing time. Consequently, we adopt the analytic model reported by Chambers (2009). The model describes a disc heated by viscous accretion and irradiation from a central star. The disc is assumed to be flared and its viscous nature is described by the standard alpha disc model (Shakura & Sunyaev1973). We use this model to predict disc mid-plane temperatures (Tmid), effective
temperatures (Teff), and surface densities (). These are then used
to predict the resulting continuum emission from the dust in this disc, and also the strength of CO first overtone line emission.
For a detailed description of the physical disc model, we refer the reader to the comprehensive paper of Chambers (2009), but here we briefly summarize the key characteristics and modifications made. The model describes a Keplerian disc with a decreasing mass accretion rate as a function of time. We utilize this to provide different accretion rates for various given model discs, but do not attach significance to the temporal differences between each model. The disc consists of three main radial zones (see Fig.1). The furthest zone from the central star (between the transition radiusrt
and the outer radiusro) is dominated by irradiation from the central
star (Qirr > Qvisc). The middle zone is located between the dust
sublimation radiusrsandrt, and is dominated by viscous heating
(Qvisc>Qirr). In the former two zones, we adopt a constant opacity
temperatures around MYSOs, see Vaidya, Fendt & Beuther2009). The zone closest to the central star is located between the inner disc radiusriand the dust sublimation radiusrs, and describes an inner
gaseous disc. Within this zone, dust is entirely sublimated and the opacity is assumed to be dependent on temperature, following
κ=κ0
T Te
n
, (1)
whereTe=1380 K andn= −14, based on the analytic opacity fits of Stepinski (1998). Throughout all zones in the disc, we assume an adiabatic index and mean molecular weight toγ=1.4 andμ=2.4, respectively.
To calculate the CO bandhead emission from such a disc, we utilize our model of CO emission (previously applied in Wheel-wright et al.2010; Ilee et al.2013; Murakawa et al.2013; Ilee et al. 2014). The model considers local thermodynamic equilibrium, and requires the excitation temperature and number density of the CO at the location of emission. The surface density of CO molecules is calculated from the disc mass surface density assuming a frac-tional abundance of 1×10⁻⁴for CO. In principle, the effective temperature of the disc is calculated using
T4 eff=
4 3τT
4
mid. (2)
In the cases of high accretion we consider here, the optical depth
τis very large. Consequently, the effective temperature due to the mid-plane temperature is low. In these cases, where the effective temperature is lower than the temperature due to stellar irradiation, we adopt the temperature due to stellar irradiation as the excitation temperature of the CO molecules at the surface of the disc (following Chiang & Goldreich1997). Since the CO emission is thus placed at the surface of the disc, we assume that it is optically thin, i.e. if the surface density is sufficient to produce optically thick emission we set it to a value that produces only marginally thick emission (NCO=5×1021cm−2).
We split the disc into 500 rings in the radial direction and the CO emission of each ring is calculated based on the local temper-ature as described above. For each rotational transition of CO, we assume a Gaussian linewidth of 15 km s−1(a typical value obtained
from model fits to high resolution spectra of CO overtone emission towards MYSOs and Herbig Be stars, see Ilee et al.2013,2014). As in our previous work, we only include emission from regions between 1000 and 5000 K, as higher temperatures will result in the dissociation of the CO molecule, and lower temperatures will produce negligible levels of emission. These spectra are then added cumulatively in order to predict the total spectrum for the entire disc of CO.
[image:3.595.307.546.72.206.2]To estimate the underlying continuum, we assume that each disc ring emits as a blackbody at the same temperature we estimate for the CO. This assumes that the disc surface appears continuous. However, the appearance of discs around MYSOs is likely strongly influenced by dust close to the dust sublimation radius (see e.g. Kraus et al.2010). To approximate the emission of dust at the dust sublimation radius, we also include a ring of emission located at the dust sublimation radius (where the mid-plane temperature is 1500 K) that has a width of 10 per cent of its radius, and emits as a blackbody at 1500 K. This is of course an oversimplification, and the true sources of continuum emission in MYSOs will involve many other aspects. Nevertheless, our approach offers a first step in the exploration of how the ratio of CO and continuum emission may change as a function of accretion rate in these objects.
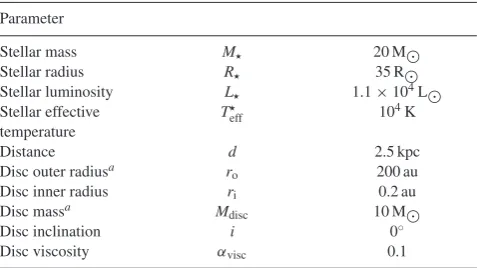
Table 1. Star and disc parameters adopted for the model. Parameter
Stellar mass M 20 M
Stellar radius R 35 R
Stellar luminosity L 1.1×10⁴L
Stellar effective temperature
T
eff 104K
Distance d 2.5 kpc
Disc outer radiusa ro 200 au
Disc inner radius ri 0.2 au
Disc massa Mdisc 10 M
Disc inclination i 0◦
Disc viscosity αvisc 0.1
aInitial value. These quantities vary as the model evolves. See Appendix A for details.
2.1 Star–disc properties
It is expected that MYSOs that are heavily accreting will initially be relatively cool before emerging on the ZAMS as hot stars (see e.g. Hosokawa & Omukai2009). In fact, Pomohaci et al. (2017) were recently able to spectral-type the MYSO G015.1288−0.6717, finding that the star is cooler and larger than what might have been expected based on its total luminosity alone. Hence, our chosen parameters that describe the central star and disc reflect this, cor-responding to an MYSO that is relatively distant from the ZAMS with a large stellar radius (35 R) and low effective temperature (104K) due to rapid accretion. The stellar mass was set at 20 M
, and the luminosity was thus 1.1×10⁴L
. The initial disc mass is set to half of the stellar mass (10 M), which decreases quickly in our model due to accretion (see Appendix A). The initial disc ra-dius was set to 200 au, but the disc spreads viscously outwards with time. Larger discs simply affect the millimetre portion of the spec-tral energy distribution, and not the near-infrared portion, which is important for our studies. The viscosity parameter within the disc was set toαvisc=0.1. Arguably, the value ofαis not critical as
the accretion history of MYSOs is not strongly dependent on this parameter (Kuiper et al.2011). In order to simplify the number of free parameters involved in the modelling, and the fact that we do not here attempt to model any given system, we assume that we view the disc in a face-on orientation (i=0◦) and at a distance of 2.5 kpc in all models presented. We summarize our chosen star–disc properties in Table1.
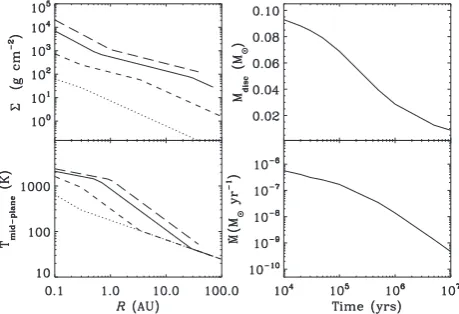
3 R E S U LT S
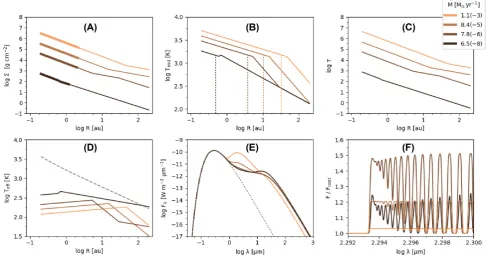
Fig.2depicts the disc properties and observables that have been calculated for the MYSO model described in Section 2. For each panel, four accretion rates are shown – 1.1×10⁻³, 8.4×10⁻⁵, 7.8 ×10⁻⁶, and 6.5×10⁻⁸M
yr−1. Panel A shows the disc
surface density as a function of radius. Panel B shows the disc mid-plane temperature as a function of radius, within which vertical dashed lines correspond to the radial location of the dust sublimation radius (assumed to be 1500 K). Panel C shows the disc optical depthτ = κ
2 as a function of radius. Panel D gives the effective
temperature of the disc as a function of radius, in which the dashed line indicates the effective temperature of a flared, irradiated disc. Panel E depicts the spectral energy distributions (SEDs) for each disc model considered, where the contribution from the central star is shown with a dashed line. Panel F shows the resulting CO
Figure 2. Disc properties and observable signatures for the MYSO model for the range of accretion rates considered. (A) Disc surface density as a function of radius. (B) Disc mid-plane temperature as a function of radius, vertical dashed lines indicate the location of the corresponding dust sublimation radius. (C) Disc optical depth as a function of radius. (D) Disc effective temperature, the dashed line indicates the effective temperature profile of a flared, irradiated disc. (E) SEDs, the dashed line indicates the contribution from the central star. (F) Predicted COv=2–0 first overtone bandhead emission, normalized to the adjacent continuum. The thicker lines in panel A denote the spatial extent of the region which emits 80 per cent of the COv=2–0 flux for each model.
For all accretion rates considered, high surface densities (panel A) create high optical depths (panel C) that result in relatively low disc effective temperatures (400 K, panel D). Consequently, the disc surface temperature is dominated by stellar irradiation within the inner 100 au (dashed grey line). High accretion rates result in high mid-plane temperatures and large dust sublimation radii (panel B). Consequently, the ring representing dust emission at the sublimation radius is relatively large, contributing more and more flux to the SED (panel E). In combination, these effects lead to changes in the ratio of the CO first overtone flux to the continuum flux as a function of mass accretion rate, from 1.05 to 1.5 times the level of the adjacent continuum (panel F).
The highest accretion rates, 1.1×10⁻³M
yr−1, are
associ-ated with relatively low line-to-continuum ratios (1.05) due to the large amount of flux from the ring of dust emission, which is much larger in size than the region from which the CO emission originates. In addition, due to the high temperatures and high gas densities in these models, a larger fraction of rotational transitions close to the bandhead peak are excited and optically thick, leading to a flatter overall bandhead profile. Conversely, but displaying a similar overall result, low accretion rates, 6.5×10⁻⁸M yr−1, are also associated with lower CO line-to-continuum ratios (1.2) due to the drop in surface density of approximately two orders of magnitude and the smaller size of the CO emitting region. As the mass accretion rate decreases, rotational transitions close to the bandhead peak become less optically thick, reducing the flatten-ing effect, and recoverflatten-ing the typical bandhead shape. Somewhat counter-intuitively, the strongest line-to-continuum ratios (∼1.5) are associated with intermediate accretion rates, due to the inter-play between the strength of the continuum emission mentioned above. Fig.3shows the resulting measured equivalent widths of the
Figure 3. Absolute value of the equivalent width of the COv=2=0 transi-tion measured for each of model spectra as a functransi-tion of mass accretransi-tion rate, with filled points representing the mass accretion rates shown in Fig.2. The strongest lines are seen for intermediate accretion rates. Equivalent widths were measured between 2.29 and 2.30μm from the continuum normalized spectra.
COv=2–0 emission line for our series of models as a function of mass accretion rate, clearly showing that the largest equivalent widths are associated with intermediate accretion rates, of order 10−5Myr−1.
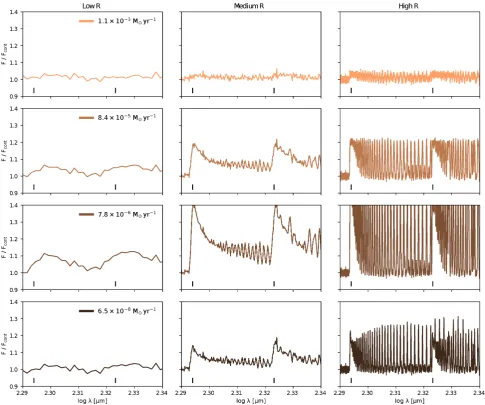
3.1 Simulated observations
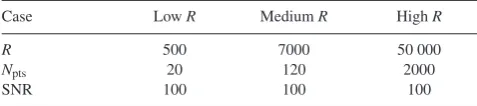
[image:4.595.312.548.391.543.2]Table 2. Parameters adopted for each of the simulated observation cases.
Case LowR MediumR HighR
R 500 7000 50 000
Npts 20 120 2000
SNR 100 100 100
of 17 per cent was determined from the near-infrared spectroscopic survey of 247 objects of Cooper et al. (2013) drawn from the Red MSX Source (RMS) survey1(Lumsden et al.2013). Typically, these
data possessed a signal-to-noise ratio of between 50 and 100 with a spectral resolution ofR= λ/λ∼500. Further studies of the near-infrared spectra of MYSOs have employed spectrometers with a higher spectral resolving power, but these have been limited to a smaller sample size and may be targeted towards objects with con-firmed CO emission, rather than being unbiased surveys. Medium resolution spectra (R∼7000) of 36 MYSOs drawn from the RMS survey were presented by Pomohaci et al. (2017), with a typical signal-to-noise ratio of 100, leading to a detection rate of CO first overtone emission of 34 per cent.
In order to assess the observability of the models presented in Fig.2, we utilize several tasks within the Image Reduction and Analysis Facility,2which we outline here. First, the model spectra
are convolved with a Gaussian profile whose full-width at half-maximum corresponds to the resolution element that produces the desired spectral resolutionR=λ/λ. Next, the convolved spectra are re-binned such that the number of points,Npts, across thev=2–
0 bandhead is comparable to that of the observational data. Finally, uniform random noise is added to the spectrum in order to reproduce the approximate signal-to-noise ratio required. Table2shows the parameters we have adopted for each case of simulated observations we consider.
Fig.4depicts the resulting simulated spectra for these models along with vertical tick marks to show the wavelengths at which the
v=2–0 and 3–1 bandheads should be visible. As can be seen, for the spectra corresponding to both the highest and lowest accretion rates (1.1×10⁻³and 6.5×10⁻⁸M
yr−1, respectively) show no
detectable signs of CO emission in low-resolution spectra (left). However, models with intermediate accretion rates (8.4×10⁻⁵and
7.8×10⁻⁶M yr−1) result in CO emission that is detectable in spectra of this signal-to-noise and spectral resolution. At medium spectral resolution (middle), the highest accretion rates are still undetectable, but lower accretions rates,10−6M
yr−1, result in
detectable emission. Finally, we examine the effect of observing our models with an extremely high-resolution spectrograph resulting in a resolving power ofR ∼50 000, shown in Fig. 4(right). With data of these quality, it is possible to detect the COv=2–0 and
v=3–1 bandheads for all mass accretion rates considered in our models. Based on these results, it is clear that a combination of both high spectral resolution and high signal to noise would be required to detect all levels of CO first overtone emission in MYSOs undergoing accretion in the manner described by our modelling.
4 D I S C U S S I O N
Using an analytic model of a viscous alpha disc that is also irradiated by a central star, we have shown that discs with high accretion rates
1http://rms.leeds.ac.uk 2http://iraf.noao.edu
result in large optical depths which result in relatively low disc effective temperatures. In most of the cases considered, the effective temperature due to stellar irradiation is greater than that predicted by the viscous model. This highlights that it is difficult to constrain accretion rates using CO bandhead emission if the accretion rates in question are high. Such a result concurs with the findings of Ilee et al. (2013) in which simple models of accretion discs (e.g. Carr 1989; Chandler et al.1995) were unable to satisfactorily reproduce high resolution spectra CO first overtone emission towards MYSOs. Our predictions for the strength of the CO bandhead emission in low resolution spectra do not exceed 20 per cent of the underly-ing continuum. This is in agreement with the near-infrared spectro-scopic survey of MYSOs presented in Cooper et al. (2013), in which detections range from 5 to 20 per cent of the adjacent continuum for a spectral resolving power ofR∼500. Another consequence of the disc surface temperature being dominated by stellar irradi-ation is that the surface temperature of discs around MYSOs is unlikely to be less than that of the adjacent interior, meaning that it is unlikely CO bandhead appears in absorption. Such a finding is also in agreement with Cooper et al. (2013), in which only two ob-jects exhibit CO first overtone absorption. In addition, these obob-jects (G023.6566−00.1273 and G032.0518−00.0902) exhibit relatively low luminosities of∼5×10³L
, and as such may be FU Ori-type objects undergoing an outburst, rather than bona fide MYSOs.
It is not clear why CO first overtone emission is not a ubiqui-tous feature in the spectra of MYSOs. From our findings here, we hypothesise that since the strength of CO bandhead emission in our model is dependent on accretion rate, the detection rate of CO bandhead emission in the spectra of MYSOs reflects the fact that MYSOs exhibit different accretion rates. We show that different accretion rates can produce a range of CO bandhead to continuum ratios ranging from approximately 1.05 to 1.5. If the accretion rates of MYSOs early in their evolution is variable between high and moderate values (∼10−4to 10−5M
yr−1), this scenario can
ac-count for some of these objects exhibiting CO bandhead emission and others appearing not to (when observed with a low spectral resolution). A full analysis of this scenario will require detailed radiative transfer calculations including both the gas and the dust in the environments of MYSOs (see e.g. Ercolano, Bevan & Ro-bitaille2013). However, our simplistic model demonstrates that this scenario is at least plausible.
We note that, in this case of high accretion rates, the CO band-head emission is largely overwhelmed by the continuum emission originating in the ring at the dust sublimation radius. This means that if this scenario is correct, the objects that do not exhibit CO bandhead emission due to rapid accretion should possess a signifi-cant continuum excess due to hot dust. For our models, theK-band flux that originates in the ring at the dust sublimation radius is ap-proximately 85 per cent of the total flux for a mass accretion rate of 1.1×10⁻³M
yr−1and falls to approximately 2 per cent of the
total when the mass accretion rate is 7.8×10⁻⁷Myr−1. Conse-quently, assessing the contribution of hot dust to the continuum flux of MYSOs could allow us to test our hypothesis.
Figure 4. Simulated observations of the CO spectra presented in Fig.2, with a spectral resolutionR=500, 7000, and 50 000 (left, middle, and right, respectively). All spectra possess the same signal-to-noise ratio of approximately 100. Vertical ticks mark the wavelengths of thev=2–0 and 3–1 transitions in each panel. Only moderate accretion rates result in detectable emission for all spectral resolutions considered, and very high spectral resolution is required in order to ensure detection for all accretion rates considered.
predicted difference between high and moderate accretion states in terms of theJ–Kcolour is not very large (approximately 1 mag). Therefore, that the NIR colours of MYSOs with and without CO bandhead emission appear similar does not yet exclude our hypoth-esis. A detailed study of the reddening towards a large sample of MYSOs is required to further examine this possibility. However, we note that Porter, Drew & Lumsden (1998) examined the redden-ing and dust contribution in the NIR spectra of 12 luminous young stellar objects. Interestingly, they found that the object with the smallest dust excess, IRAS 17441−2910, exhibited the strongest CO bandhead emission, which is in agreement with the scenario outlined above.
4.1 Comparison to a recent spectroscopic survey of MYSOs
We draw upon the recent study of Pomohaci et al. (2017) in order to test whether our hypothesis that only intermediate mass accretion rates result in detectable CO first overtone emission in MYSOs. Spectra were obtained from 1.07 to 2.33μm using
GEMINI-North/GNIRS with a spectral resolving power ofR∼7000. Such a wavelength coverage allowed simultaneous observation of the CO first overtone bandheads (v = 2–0 and 3–1) alongside the Brγ
hydrogen recombination emission line. The luminosity of many emission lines, including Brγ, has been shown to correlate with the accretion luminosity in many low and intermediate mass young stellar objects (e.g. Mendigut´ıa et al.2011,2015), and as such, can be used to calculate the accretion rate on to the central object.
Fig.5shows the accretion rates calculated from the Brγline lu-minosities for the 38 MYSOs presented in Pomohaci et al. (2017). The upper panel shows those in which no CO first overtone emis-sion was detected, the middle panel shows those in which CO first overtone emission was detected, and the lower panel shows the relative fraction of detections to non-detections for each mass ac-cretion rate bin. The CO first overtone non-detections span a wide range of accretion rates, 1.4×10⁻²to 6.9×10⁻⁷M
yr−1. The
CO first overtone detections, while less numerous, span a much smaller range of intermediate mass accretion rates 5.5×10⁻⁴to
Figure 5. Mass accretion rates calculated from the luminosity of the Brγ line for the 38 MYSOs withR∼7000 presented in Pomohaci et al. (2017). The upper panel shows objects where CO first overtone emission is not detected in their spectra, the middle panel shows objects where CO first overtone emission is detected, and the relative fraction of detections against non-detections for each mass accretion rate bin are shown in the lower panel. The CO detections are confined to a narrower range of accretion rates than the non-detections, and the relative fraction of detections com-pared with non-detections peaks for intermediate values of accretion rate (∼2×10⁻⁴M
yr−1).
both distributions display a peak at intermediate accretion rates, it is interesting to note that the relative fraction of detections to non-detections increases significantly for intermediate values of accre-tion rate at this peak (centred on approximately 2×10⁻⁴M
yr−1).
We note that the errors associated in the determination of ac-cretion rates from observations of emission lines are large, and therefore these results are likely subject to significant scatter. In addition, we stress that the modelling presented here is far from ex-haustive given the complex nature of the circumstellar environment of MYSOs. In particular, the precise accretion rates that we derive for each model, and the strength of the underlying dust continuum, will be influenced by many of the parameters we have chosen to fix during the modelling process. Nevertheless, our approach offers the first analysis of the interplay between continuum emission and CO overtone emission in MYSOs, and our results are consistent with our hypothesis that only intermediate values of accretion rate result in detectable levels of CO first overtone emission in low-to-medium resolution spectra. High spectral resolution observations of a large number of MYSOs, involving simultaneous observation of accretion tracing lines such as Brγalongside the CO first overtone
emission feature, will be essential in further testing our hypoth-esis and reducing the errors associated with the determination of accretion rates from these observations.
5 C O N C L U S I O N S
In this paper we examine possible explanations for the fact that while all MYSOs are expected to possess circumstellar discs, only a subset (∼25 per cent) exhibit CO bandhead emission, which has been shown to trace the presence of small scale gaseous discs around these objects. In particular, we investigate the hypothesis that the strength of the CO bandhead emission of MYSOs is sensitive to their accretion rate, and that only particular accretion rates result in observable emission. We summarize our findings as follows:
(i) High accretion rates (>10−4M
yr−1) are associated with
high surface densities which in turn prevent the CO at the disc sur-face being heated by the accretion. In addition, high accretion rates result in optically thick CO bandheads, large dust sublimation radii, and continuum emission that is stronger than the bandhead emis-sion. On the other hand, low accretion rates (<10−6M
yr−1) result
in low surface densities and also produce low bandhead emission. In general, moderate accretion rates (∼10−5M
yr−1) produce the
most prominent CO bandhead emission.
(ii) We demonstrate that both high signal to noise (>100) and high spectral resolution (R> 50 000) near-infrared observations are required in order to detect the relatively weak CO first over-tone emission that may be masked in objects exhibiting the highest accretion rates.
(iii) We compare our results to findings of a recent medium res-olution spectroscopic survey of MYSOs. We show that the pro-portion of objects with detected CO first overtone emission peaks for intermediate mass accretion rates, which is consistent with our hypothesis.
(iv) We conclude that the detection rate of CO bandhead emis-sion in the spectra of MYSOs (∼25 per cent) could be the result of MYSOs exhibiting a range of accretion rates, either due to an intrinsic spread of accretion rates in these objects, or variable levels of accretion for individual objects as a function of time.
Based on our findings, the non-ubiquitous detection of CO first overtone emission in the spectra of MYSOs may suggest that the majority of these objects surveyed are experiencing high accretion rates, which act to mask their CO bandhead emission. Forthcoming instruments, such as CRIRES+ on the VLT (Follert et al.2014), will enable high spectral resolution and high signal-to-noise obser-vations of CO overtone spectra, which we have shown is essential in order to detect the relatively weak emission from highly accreting objects. In addition, the large wavelength coverage of CRIRES+ will enable a simultaneous observations of the Brγ emission line, a key diagnostic of accretion rates (see e.g. Mendigut´ıa et al.2011; Fairlamb et al.2015,2017). Such observations will be essential in allowing us to further test our hypothesis, and shed light on the accretion processes and immediate circumstellar environment of massive young stars.
AC K N OW L E D G E M E N T S
and Technologies Facilities Council of the United Kingdom. This paper made use of information from the Red MSX Source survey data base athttp://rms.leeds. ac.uk/which was constructed with sup-port from the Science and Technology Facilities Council of the UK, and NASA’s Astrophysics Data System Bibliographic Services.
R E F E R E N C E S
Beltr´an M. T., de Wit W. J., 2016, A&AR, 24, 6
Beltr´an M. T., Cesaroni R., Neri R., Codella C., 2011, A&A, 525, A151 Beuther H., Walsh A. J., 2008,ApJ, 673, L55
Beuther H., Schilke P., Sridharan T. K., Menten K. M., Walmsley C. M., Wyrowski F., 2002, A&A, 383, 892
Bik A., Thi W. F., 2004, A&A, 427, L13
Blum R. D., Barbosa C. L., Damineli A., Conti P. S., Ridgway S., 2004,
ApJ, 617, 1167
Boley P. A., Linz H., van Boekel R., Bouwman J., Henning T., Sobolev A. M., 2013, A&A, 557, C1
Calvet N., Patino A., Magris G. C., D’Alessio P., 1991,ApJ, 380, 617 Caratti o Garatti A. et al., 2017,Nat. Phys., 13, 276
Carr J. S., 1989,ApJ, 345, 522
Cesaroni R., Neri R., Olmi L., Testi L., Walmsley C. M., Hofner P., 2005, A&A, 434, 1039
Chambers J. E., 2009,ApJ, 705, 1206
Chandler C. J., Carlstrom J. E., Scoville N. Z., 1995,ApJ, 446, 793 Chiang E. I., Goldreich P., 1997,ApJ, 490, 368
Cooper H. D. B. et al., 2013,MNRAS, 430, 1125
Cunningham N., Lumsden S. L., Cyganowski C. J., Maud L. T., Purcell C., 2016,MNRAS, 458, 1742
Davies B., Lumsden S. L., Hoare M. G., Oudmaijer R. D., de Wit W.-J., 2010,MNRAS, 402, 1504
Davis C. J., Varricatt W. P., Todd S. P., Ramsay Howat S. K., 2004, A&A, 425, 981
de Wit W. J., Hoare M. G., Oudmaijer R. D., N¨urnberger D. E. A., Wheel-wright H. E., Lumsden S. L., 2011, A&A, 526, L5
Ercolano B., Bevan A., Robitaille T., 2013,MNRAS, 428, 2714
Fairlamb J. R., Oudmaijer R. D., Mendigut´ıa I., Ilee J. D., van den Ancker M. E., 2015,MNRAS, 453, 976
Fairlamb J. R., Oudmaijer R. D., Mendigutia I., Ilee J. D., van den Ancker M. E., 2017,MNRAS, 464, 4721
Follert R., Linz H., Stecklum B., van Boekel R., Henning T., Feldt M., Herbst T. M., Leinert C., 2010, A&A, 522, A17
Follert R. et al., 2014, in Ramsay S. K., McLean I. S., Takami H., Proc. SPIE Conf. Ser. Vol. 9147, Ground-based and Airborne Instrumentation for Astronomy V. SPIE, Bellingham, p. 914719
Grellmann R., Ratzka T., Kraus S., Linz H., Preibisch T., Weigelt G., 2011, A&A, 532, A109
Guzm´an A. E., Garay G., Brooks K. J., 2010,ApJ, 725, 734 Harries T. J., Douglas T. A., Ali A., 2017, MNRAS, 471, 4111 Hosokawa T., Omukai K., 2009,ApJ, 691, 823
Hunter T. R. et al., 2017,ApJ, 837, L29 Ilee J. D. et al., 2013,MNRAS, 429, 2960
Ilee J. D., Fairlamb J., Oudmaijer R. D., Mendigut´ıa I., van den Ancker M. E., Kraus S., Wheelwright H. E., 2014,MNRAS, 445, 3723
Ilee J. D., Cyganowski C. J., Nazari P., Hunter T. R., Brogan C. L., Forgan D. H., Zhang Q., 2016,MNRAS, 462, 4386
Johnston K. G. et al., 2015,ApJ, 813, L19
Klassen M., Pudritz R. E., Kuiper R., Peters T., Banerjee R., 2016,ApJ, 823, 28
Kraus M., Kr¨ugel E., Thum C., Geballe T. R., 2000, A&A, 362, 158 Kraus S. et al., 2010,Nature, 466, 339
Krumholz M. R., Klein R. I., McKee C. F., 2007,ApJ, 665, 478
Krumholz M. R., Klein R. I., McKee C. F., Offner S. S. R., Cunningham A. J., 2009,Science, 323, 754
Kuiper R., Klahr H., Beuther H., Henning T., 2011,ApJ, 732, 20 Lumsden S. L., Hoare M. G., Urquhart J. S., Oudmaijer R. D., Davies B.,
Mottram J. C., Cooper H. D. B., Moore T. J. T., 2013,ApJS, 208, 11
Maud L. T., Hoare M. G., Galv´an-Madrid R., Zhang Q., de Wit W. J., Keto E., Johnston K. G., Pineda J. E., 2017, MNRAS, 467, L120
Mendigut´ıa I., Calvet N., Montesinos B., Mora A., Muzerolle J., Eiroa C., Oudmaijer R. D., Mer´ın B., 2011, A&A, 535, A99
Mendigut´ıa I., Oudmaijer R. D., Rigliaco E., Fairlamb J. R., Calvet N., Muzerolle J., Cunningham N., Lumsden S. L., 2015,MNRAS, 452, 2837
Murakawa K., Lumsden S. L., Oudmaijer R. D., Davies B., Wheelwright H. E., Hoare M. G., Ilee J. D., 2013,MNRAS, 436, 511
Najita J., Carr J. S., Glassgold A. E., Shu F. H., Tokunaga A. T., 1996,ApJ, 462, 919
Pomohaci R., Oudmaijer R. D., Lumsden S. L., Hoare M. G., Mendigutia I., 2017, MNRAS, 472, 3624
Porter J. M., Drew J. E., Lumsden S. L., 1998, A&A, 332, 999 Purser S. J. D. et al., 2016,MNRAS, 460, 1039
Rosen A. L., Krumholz M. R., McKee C. F., Klein R. I., 2016,MNRAS, 463, 2553
Shakura N. I., Sunyaev R. A., 1973, A&A, 24, 337 Stepinski T. F., 1998,Icarus, 132, 100
Vaidya B., Fendt C., Beuther H., 2009,ApJ, 702, 567
Wheelwright H. E., Oudmaijer R. D., de Wit W. J., Hoare M. G., Lumsden S. L., Urquhart J. S., 2010,MNRAS, 408, 1840
Zhang Q., Hunter T. R., Brand J., Sridharan T. K., Cesaroni R., Molinari S., Wang J., Kramer M., 2005,ApJ, 625, 864
Zinnecker H., Yorke H. W., 2007, ARA&A, 45, 481
A P P E N D I X A : M O D E L V E R I F I C AT I O N
To demonstrate our implementation of the model, we consider an example presented by Chambers (2009). The central star mass is set toM=1 Mwith an effective temperature and radius given
by Teff =4200 K and R = 3 R. The initial disc is
character-ized by an outer radiuss0=33 au and a mass ofM0=0.1 M,
respectively. The viscosity is set as α= 0.01 and the opacity is given byκ0=3 cm2g−1. The disc properties and their subsequent
[image:8.595.314.544.503.660.2]evolution are shown in Fig.A1. The surface density decreases with time as material is accreted on to the central star. The various power laws exhibited by the surface density and temperature trace, in in-creasing distance from the central star, the ‘evaporative’, ‘viscous’, and ‘irradiated’ zones in the disc (where evaporative refers to the sublimation of dust grains, and thus a purely gaseous inner disc). The viscous region possesses the steepest temperature gradient, and
temperatures in all zones decrease with time (or accretion rate), but do so more slowly than surface density. Both disc mass and accre-tion rates decrease with time. There is a slight break in the slope of accretion rate where the zone dominated by stellar irradiation first appears. After this point, it is assumed the disc evolution is governed
by the irradiation. All these points and the plots in Fig.A1are in good agreement with the findings of Chambers (2009).