Version: Accepted Version
Proceedings Paper:
Clarkson, G, Luo, S and Fuentes, R orcid.org/0000-0001-8617-7381 (2017) Thermal 3D
modelling. In: Proceedings of the 34th ISARC. 34th International Symposium in
Automation and Robotics in Construction, 28 Jun - 01 Jul 2017, Taipei, Taiwan. IAARC ,
pp. 493-499.
© This is an author produced version of a paper published in 34th International
Symposium on Automation and Robotics in Construction (ISARC 2017).
[email protected] https://eprints.whiterose.ac.uk/
Reuse
Unless indicated otherwise, fulltext items are protected by copyright with all rights reserved. The copyright exception in section 29 of the Copyright, Designs and Patents Act 1988 allows the making of a single copy solely for the purpose of non-commercial research or private study within the limits of fair dealing. The publisher or other rights-holder may allow further reproduction and re-use of this version - refer to the White Rose Research Online record for this item. Where records identify the publisher as the copyright holder, users can verify any specific terms of use on the publisher’s website.
Takedown
If you consider content in White Rose Research Online to be in breach of UK law, please notify us by
Thermal 3D Modelling
Gregory Clarkson, Shan Luo, Raul Fuentes
School of Civil Engineering, University of Leeds, Leeds, LS2 9JT
E-mail addresses: [email protected], [email protected], [email protected]
Abstract – This paper presents the case of a 3D reconstruction of an object using infrared imagery directly. In total, three point clouds are created using 3DF Zephyr and SfM techniques. The first is a thermal reconstruction, the second is a low resolution RGB reconstruction and the final is a high resolution RGB reconstruction which is used as a reference for comparison of the others. CloudCompare is then used to analyze and evaluate the reconstructed point clouds. In particular, this paper presents the reconstruction of a 3D Model directly from thermal images, conversely to previous solutions that use RGB imagery for 3D reconstruction subsequently followed by superposition of the thermal data.
Keywords –
3D Reconstruction; Structure-from-Motion; Thermal; Infrared
1
Introduction
The field of reconstruction from multiple images, known as Structure from Motion (SfM) has been rapidly expanding in recent years to incorporate a wider variety of possibilities and applications. This development is driven by constant innovation and improvement in computer technology [1]. 3D reconstruction is therefore becoming a much more frequent practice in various fields. [2] shows why reconstruction is of great importance in architectural restoration and deformation monitoring of historic structures using the wall in Uzutrakis palace, Lithuania as a case study. Other uses of this technology include crime scene investigation [3] and medical MRI scanning [4]. However, the more specific use of thermal reconstructions is largely unexplored and has many potential applications in the construction industry alone, such as leak detection (see Figure 1). Creating full thermal profiles of buildings would also be possible using UAV’s with mounted thermal optics, such as the DJI Inspire 2 [5] and DJI Zenmuse XT Thermal Camera with Stabilized Gimbal provided by FLIR [6]. These models could be used to evaluate and improve a structure’s energy performance. Moreover, [7] discusses how the operational cost of a building is greater than the capital cost at a ratio of approximately 1.2:1.0 and thus there is
Figure 1: (Left) RGB photograph. (Right) Thermal / infrared image. It can be seen that the leaks can only be detected in the thermal view [24].
significant financial motivation to ensure energy efficiency. Thermal reconstructions would allow complex situations to be analyzed more accurately.
To date, there has been little research into the reconstruction of 3D models directly from thermal imagery. Current methods involve superimposing thermal data onto reconstructions created through regular RGB images or other means. For example, [8] uses a method where thermal data is projected onto an existing 3D model created with AutoCAD. [9] presents the idea of ‘carving’ out a heat source from a voxel set created by segmentation using Otsu thresholding method [10]. To date, no reliable method for thermal-only reconstruction has been proposed. This paper will investigate the reconstruction of models directly from thermal images using software which implements SfM techniques. These are then compared to both low and high quality RGB reconstructions, using Cloud Compare for evaluation.
2
Structure from Motion (SfM)
[image:2.595.315.538.224.321.2]Features of an image known as keypoints can then be detected and described using various algorithms such as Speeded Up Robust Features (SURF) [11] or the popular Scale Invariant Feature Transform (SIFT) [12]. Maximally stable extremal features (MSER) [13] is another algorithm which matches regions of similar luminous intensity rather than specific keypoints. A matching process then occurs between the keypoints in different images and if there are enough matches between multiple images, first the camera position and orientations are recovered, followed by a measurement of the 3D coordinates of the keypoints through triangulation.
Zephyr Pro created by 3D Flow [14] is just one package, but is used in this work due to its intuitive workflow and reliability. Zephyr uses its own proprietary set of algorithms for reconstruction. The first is known as SAMANTHA which calculates camera positions and orientations and keypoints and the second is STASIA, a Multiview Stereo (MVS) algorithm which extracts dense point clouds [15,16]. SAMANTHA uses a feature detector to extract keypoints that is a scale-space feature extractor based on Difference of Gaussian, with a radial and symmetric descriptor [17]. Keypoints are then matched between images based on the response values from their descriptors and a rough set of camera positions and orientations are estimated. A more refined matching stage is then undertaken in which keypoints are also discarded. The fundamental matrix [18], which describes the intrinsic relationship between two viewpoints, is calculated using M-SAC [19]. A hierarchal structure is created for matching images using an agglomerative clustering algorithm. The partial models created from these matches are merged together forming a single model and finally bundle adjustment is performed to reduce reprojection errors and improve overall accuracy.
3
Object Description
The object being reconstructed in this paper was carefully chosen to have the following properties:
Relatively small – easy to photograph using available thermal cameras (low resolution images). ‘Blocky’ geometry – Geometry which is too
complex would be difficult to accurately reconstruct. Varying thermal profile – unlike in regular RGB photographs thermal images require a temperature gradient for keypoint detection.
Figure 2 shows the architectural model chosen for the reconstruction. The whole model is relatively small (~ 75x45cm) and has a complex enough form to allow both RGB and thermal reconstruction. The model is heated and given a sufficient thermal profile using two 1000W work lights secured to the tabletop via a drill vice. The
[image:3.595.311.539.133.286.2]work lights act as a sun emulator and provide heat across the model, much in the same fashion as a heliodon [20].
Figure 2: Photograph showing architectural model to be reconstructed (High resolution RGB).
4
Camera Calibration and Properties
Both thermal and RGB cameras are automatically calibrated within Zephyr, this is done using an additional package called 3DF Lapyx which has been recently integrated into Zephyr.
4.1
Thermal Camera
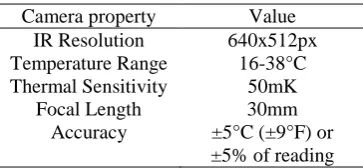
[image:3.595.340.522.491.575.2]The device used to capture thermal images is a FLIR A65sc. The specifications used can be seen in Table 1 below.
Table 1 FLIR A65sc Properties.
Camera property Value IR Resolution
Temperature Range
640x512px 16-38°C Thermal Sensitivity 50mK
Focal Length 30mm Accuracy ±5°C (±9°F) or
±5% of reading
4.2
RGB Camera
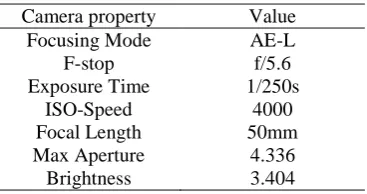
Table 2: SONY ILCE-7S Properties.
Camera property Value Focusing Mode AE-L
F-stop f/5.6
Exposure Time 1/250s ISO-Speed
Focal Length Max Aperture Brightness
4000 50mm
4.336 3.404
5
Image Capture
The image capture process for both thermal and RGB reconstruction is crucial as it must be ensured that there is enough overlap between consecutive images for sufficient keypoint matching to occur. The architectural model is encircled completely while continually capturing images at approximately 20° increments (see Figure 3). In total, the capture process took around 15 minutes for each set of images, excluding initial experiment set up time.
Figure 3: Reconstruction in Zephyr showing computed camera locations (blue frustums) and reconstructed point cloud (centre).
5.1
Thermal Series
Two sets of thermal images (640x512px) were captured; the first set of 24 had the work lights switched on to heat up the model from one side (Figure 4). The second set of 19 images was taken roughly five minutes after the lights had been switched off so only some residual heat remains (see Figure 5). This series of images highlights the major problem of reconstructing directly from thermal images, which is lack of detectable features present. Zephyr could not detect/match enough keypoints between images with this set for a successful reconstruction, therefore, it was disregarded.
5.2
RGB Series
[image:4.595.311.541.256.436.2]Two sets of RGB photographs were taken of the architectural model. The first is a high resolution (4240x2832px) set consisting of 17 images. The second set of 18 images were taken at the lowest possible resolution of the camera (2128x1416px). This image set was then resampled and downscaled to match the thermal image resolution (640x512px). This down scaling was done using Adobe Photoshop’s resampling tool with bicubic sharpening (reduction) as the resampling method [21]. Figure 2 shows one of the high-resolution images used in the reconstruction.
[image:4.595.70.298.362.513.2]Figure 4: Thermal image from series one showing architectural model with work lights switched on.
[image:4.595.311.540.471.652.2]6
Reconstruction
The thermal and RGB photographs taken were then reconstructed using Zephyr. A desktop PC was used for processing which has primary components of an Intel i5-4430 (3GHz) CPU and 2Gb NVidia GTX 960 with CUDA GPU. Actual processing time of the point clouds varies significantly, but is primarily dependent on the image resolution and complexity (see Table 3).
6.1
Thermal
The thermal photographs are reconstructed using the advanced settings in Zephyr to allow more control. A full description of the settings is outside the scope of this paper but are included for ease of reproducibility of the results. A complete explanation of the settings can be found in [14]. ‘Exhaustive’ was used as a base point and then tweaked to give the best possible reconstruction. The photo ordering was changed to unordered and keypoint matching tolerance increased. ‘High details – Sharp’ was used as the setting for dense point cloud generation and with no additional tweaks.
Only eight of the thermal images showed sufficient correspondence to create a point cloud: this further highlights the need for a varying temperature gradient across an object for thermal reconstruction. There are a considerable number of errors in the reconstruction; these are especially prevalent in areas with little temperature variation, in this case the side of the model not facing the heat source. There is also significant distortion within the model, although the overall form can be inferred (See Figures 4, 6).
6.2
RGB
The RGB photographs are reconstructed using the Zephyr preset settings, for simplicity. ‘Default’ and ‘Deep’ were used for the high and low resolution series sparse point cloud generation respectively. The photo ordering setting was again changed to unordered so that keypoint matching occurs between all images. Dense point cloud generation was performed with the same settings as the thermal photographs. There is some surface glare present in several RGB photographs, originating from the glossy surface present on some parts of the model. This glossiness is inconsistent between views as the relative perspective lighting changes and hence makes keypoint detection in these areas difficult. However, the wood paneling texture on the model provides an excellent source of key points, especially regarding the high-resolution photographs.
For the high-resolution image set, only 1 photograph failed to match enough keypoints to be successfully included in the reconstruction (due to undesirable motion blur present). The quality of the point cloud overall
appears very good, there is little noise and only minor reconstruction errors present (see Figure 7). These errors are primarily gaps that occur only on the thin white walls of the model, explained by the lack of surface texture and hence lack of keypoints.
[image:5.595.316.535.364.494.2]For the low-resolution image set the reconstruction is much less complete with six cameras being discarded. The sections of the model with the wood paneling texture are still reconstructed well, but the white portions have considerably more errors and the overall form of the cloud shows more distortion too (see Figure 8). This loss of quality is to be expected when using such low-resolution photographs as there are simply fewer keypoints which can be detected. For comparison, a script was created in MATLAB running the SURF algorithm, 2726 key points are detected in one of the high-resolution photographs and only 319 in a low-resolution photograph. This stark difference is exacerbated since the low resolution is not the photographs native format and there will be some loss of quality occurring from the down sampling and resizing process.
Figure 6: Dense, thermal point cloud created using Zephyr (post-cleanup) – a good reconstruction only occurs where there’s a varying thermal profile.
[image:5.595.319.531.551.680.2]Figure 8: Dense, low resolution, RGB point cloud created using Zephyr (post-cleanup) – Mesh holes can be seen on the right and distortion on the left.
6.3
Point cloud cleanup and registration
The post reconstruction process consists of two steps: cleanup and registration. The cleanup itself is done in two stages. The first stage involves the removal of points with high uncertainty using Zephyr’s confidence index and the second stage is a manual removal of anomalous points. These are erroneous points inherently present in every reconstruction and do not fit with the desired point cloud form. The table beneath the base of the model was also removed from all the point clouds as this would affect comparison validity. This was done using the tools within Zephyr to ‘cut’ around the base in the clouds which can clearly be discerned.
SfM techniques cannot currently recover a scaled model directly without additional spatial information being provided. This procedure was deemed unnecessary as this paper is focused on the thermal reconstruction process rather than precise accuracy in terms of scale. Therefore, a relative scale has been adopted where the thermal and low resolution RGB point clouds are adjusted to fit onto the high resolution RGB cloud which acts as the reference. This process is done in two stages using CloudCompare [22]; the first is manually translating / rotating / scaling the non-reference clouds to align them approximately to the reference. The second stage refines this alignment using Iterative Closest Point (ICP) algorithm [23], which adjusts the non-reference point cloud to achieve the lowest RMS errors.
7
Point Cloud Comparison
[image:6.595.312.538.126.189.2]Once the reconstructions are aligned and scaled relative to the reference, they can be compared reliably and fairly. The number of points in the dense cloud is proportional to the complexity of the image, thus it is intuitive that the thermal point cloud will have fewer. Conversely, this method also reduces the computation time required for processing as can be seen in Table 3.
Table 3: Point cloud density and approximate computation time.
Model name Number of points in cloud
~ Computation time (mins)
Thermal 137,064 5
High-res RGB 2,206,837 30 Low-res RGB 226,364 12
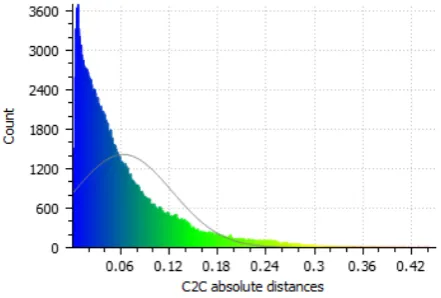
The histograms below (Figures 9, 10) show absolute distance comparisons of the thermal and low-resolution RGB clouds against the high-resolution RGB cloud. These distances represent how much the non-reference point cloud deviates from the reference and thus a rough gauge of accuracy can be inferred.
Figure 9: CloudCompare absolute distance comparison between thermal and high resolution RGB point clouds.
[image:6.595.312.537.307.450.2] [image:6.595.316.537.538.687.2]Overall, the low resolution RGB point cloud is the closest match to the reference cloud. The mean and standard deviation are 44.7% and 38.9% lower than the thermal clouds respectively. However, this lower accuracy does not mean that reconstructing from thermal clouds directly is obsolete; there are several specific situations where thermal images will give a better reconstruction than an RGB. Flat surfaces with very little surface texture such as the glossy white parts of the architectural model in this case gave a poor reconstruction through RGB images. Thermal reconstruction has potential to work around this problem as the surface can have a temperature gradient and hence can still be reconstructed through the thermal imagery. It then follows that the combination of thermal and RGB imagery could improve the overall reconstruction result. This method is a clear advantage over others that use superimposing of the thermal data.
8
Conclusion
The SONY ILCE-7S and FLIR A65sc were successfully used to acquire good sets of photographs of the architectural model. The 3D reconstruction software Zephyr was then used to reconstruct these into dense point clouds (Figures 6, 7, 8) using SfM techniques. The low resolution RGB and thermal point clouds were initially manually aligned onto the high-resolution RGB cloud, which was further refined by the ICP algorithm. An absolute distance analysis is then performed using CloudCompare (Figures 9, 10) and the point clouds are evaluated in section 7.
9
Acknowledgments
We would like to thank Amy Derby for the use of her architectural model.
10
References
[1] Gavves E. “A brief history of computer vision”. Online: http://www.egavves.com/a-brief-history-of-computervision/#sthash.s8aGdhBl.dpbs, Accessed: 26/03/2016.
[2] Sužiedelyt -Visockien , J., Bagdži nait , R., Malys, N. and Maliene, V. “Close-range photogrammetry enables documentation of environment-induced deformation of architectural heritage”. Environmental engineering and management journal, 14(6): 1371–1381, 2015. [3] Bostanci, E. “3D reconstruction of crime scenes and
design considerations for an interactive investigation tool”. Online: http://arxiv.org/pdf /1512.03156.pdf, Accessed: 26/04/2016.
[4] Ying, L. and Liang, Z.-P. “2 advanced image reconstruction methods in MRI” Online: http://www.acsu.buffalo.edu/~jlv27/index_files/Pu blications_files/BookChapter_AdvImgRecon.pdf, Accessed: 27/03/2016.
[5] DJI Official. “Inspire 2–Power Beyond Imagination” Online: http://www.dji.com/inspire-2, Accessed: 29/03/2017.
[6] FLIR Systems, I. “Aerial Thermal Imaging Kits | FLIR Systems” Online: http://www.flir.com/suas /aerial-thermal-imaging-kits/, Accessed: 29/03/2017.
[7] Hughes, W., Ancell, D., Gruneberg, S. and Hirst, L. “Exposing the myth of the 1:5:200 ratio relating initial cost, maintenance and staffing costs of office buildings” Online: http://centaur.reading.ac.uk /12142/1/File12142.pdf, Accessed: 26/04/2016. [8] Acampora, L., De Filippis, F., Sorgi, L., Martucci,
A., “3D reconstruction of thermal images”. In Proceedings of the 26th Aerospace Testing Seminar 2011, pages 263-276, California, USA, 2011. [9] Chen, C.-Y., Yeh, C.-H., Chang, B.R. and Pan,
J.-M. (2015) “3D reconstruction from IR thermal images and Reprojective evaluations”. Mathematical Problems in Engineering, doi:10.1155/520534, 2015.
[10] Automatic thresholding “Automatic Thresholding”. Online: http://www.math.tau.ac.il/~turkel/notes /otsu.pdf, Accessed: 14/05/2017.
[11] Bay, H., Tuytelaars, T. and Van Gool, L. “Speeded up robust features (SURF)” Computer Vision and Image Understanding, 110(3): 346-359, 2006. [12] Lowe, D. “Distinctive image features from
scale-invariant Keypoints”. International Journal of Computer Vision, 60(2): 91-110, 2004.
[13] Matas, J., Chum, O., Urban, M. and Pajdla, T. “Robust Wide Baseline Stereo from Maximally Stable Extremal Regions” Image and Vision Computing, 22(10): 761-767, 2004.
[14] 3DFlow. “3DF Zephyr Pro - 3d models from photos” Online: http://www.3dflow.net/3df-zephyr-pro-3d-models-from-photos/, Accessed: 28/03/2017. [15] 3DFlow. “3Dflow Technology”. Online:
http://www.3dflow.net/technology/, Accessed: 28/03/2017.
[17] Toldo, R. “Towards automatic acquisition of high-level 3D models from images” Online: http://www.3dflow.net/resources/PhDThesis_RTol do.pdf, Accessed: 27/04/2016.
[18] Hartley, R. and Zisserman, A. Multiple View Geometry in Computer Vision, pages: 239-261, 2004.
[19] Torr, P. and Zisserman, A. “MLESAC: A new robust estimator with application to estimating image geometry”. Computer Vision and Image Understanding, 78(1): 138-156, 2000.
[20] High Precision Devices. “Heliodon is a Sun Emulator to Demonstrate the Motion of the Sun.” Online: http://www.hpd-online.com/heliodon.php, Accessed: 29/03/2017.
[21] Chavez, C. “Fundamentals: Resampling in Photoshop” Online: http://www.graphics.com/ article-old/fundamentals-resampling-photoshop, Accessed: 14/05/2017.
[22] G.M, D. “CloudCompare - Open Source project” Online: http://www.danielgm.net/cc/, Accessed: 29/03/2017.
[23] Besl, P. and McKay, N. (1992). “A Method for Registration of 3D Shapes”. IEEE Transactions on Pattern Analysis and Machine Intelligence, 14(2): 239-256, 1992.