[«»■ Series Ν Ί
Labour Market Studies
SPAIN
Employment & social affairs
Labour Market Studies
Spain
By
Luis Toharia, University of Alcalá
April 1997
A great deal of additional information on the European Union is available on the Internet. It can be accessed through the Europa server (http://europa.eu.int)
Cataloguing data can be found at the end of this publication
Luxembourg: Office for Official Publications of the European Communities, 1997 ISBN 92-827-8759-1
© European Communities, 1997
Reproduction is authorized, except for commercial purposes, provided the source is acknowledged
A report by Luis Toharia, University of Alcalá
In collaboration with the following research team
Celia Albert
Immaculada Cebrián
The labour market in Spain, p. i
EXECUTIVE SUMMARY
This text presents the final report for the study "THE LABOUR MARKET IN SPAIN",
commissioned by the Directorate General for Employment, Industrial Relations and Social Affairs
to a team from the University of Alcalá headed by professor Luis Toharia.
The main fact to be explained is the high and persistent unemployment rate prevailing in
Spain. To that end, the report is structured in five chapters: "Labour Market Analysis and
Forecasts", "Labour Market Institutions and Legislation"m Labour Market Policies", "Other
policies affecting the labour market", and "Conclusions". Chapter I has two appendices and
Chapter IV one. The bibliography used in the study is presented at the end.
Chapter I, "Labour Market Analysis and Forecasts" starts with the demographic evolution
in Spain as well as the expected demographic trends for the next thirty years. The structure of the
labour force is analyzed next. After an analysis of labour market participation rates, the
characteristics of employment and unemployment are studied. This stock analysis is followed by a
flow study on the main trends on job creation and destruction. Wages and macroeconomic policy
are two important elements in any analysis of the labour market evolution and situation, and they
are examined next. This chapter is completed with two appendices detailing the econometric results
used at various points of the chapter and deepening on the methodological issues behind the
analysis of labour market flows, as compared to the stocks.
Chapter Π, "Labour Market Institutions and Legislation" deals with the institutional and
legislative framework within which labour market activities take place. In the Spanish case, given
the strong tradition of Labour Law, many of the labour market institutions themselves (most
notably, collective bargaining) are heavily influenced by law. This implies that any analysis of
institutions would be incomplete if not accompanied by a study of legislation. Hence, the strategy
we follow in this chapter is the following: we first present an overview of the evolution of labour
law in Spain, the basic public labour market institutions, and the system of industrial relations,
heavily influenced by law. We then deal with various specific regulations (stemming partly from
legislation and partly from institutions): employment protection schemes, working time regulations,
and minimum wage. We conclude with a more specific analysis of the recent labour market reform,
The labour market in Spain, p. ii
Chapter III deals with labour market policies. Following the traditional distinction, first established by the OECD, between "active" and "passive" policies, it is initially observed that in Spain the proportion of resources devoted to the so-called measures has represented around 80 per cent of total expenditure, although this figure has reached higher levels in some years (with a record high of close to 90 per cent in 1993). Passive policies are analyzed next. After a short description of the unemployment compensation system currently prevailing in Spain, figures on the incidence of that system are analyzed as well as the influence of unemployment benefits on search behaviour and job finding by the unemployed, an issue on which substantial controversy exists in Spain. Early retirement policies, as limited as they are, are also dealt with. To analyze active labour market policies, the structure adopted follows the MISEP reports. This departs somewhat from the OECD classification, most notably because contract-related measures, many of which do not carry direct expenditure from the government budget, are included as active measures. The three main strands of active measures are: labour market training (for the unemployed and for the employed), employment promotion and creation policies (without economic incentive, i.e. specific employment promotion contracts, with economic incentive, and direct jobs created in the public sector) and measures in favour of entrepreneurial initiatives and employment creation.
Chapter IV deals with other policies, most notably education and industrial policies. These policies, while not directly related to the labour market, exert an indirect influence on the evolution of employment and unemployment.
Chapter V rounds up the report summarising the main conclusions reached in terms of the explanation to be provided to the evolution of employment and unemployment in Spain. We now summarize the main conclusions reached.
First of all, it is clear that the origin of the Spanish unemployment situation dates back to the economic crisis of the late 1970s and early 1980s. From our analysis, at least the following six factors, which may partly overlap, may be identified to account for it:
The labour market in Spain, p. iii
competition and cheap labour simply had to close down. A recent strand along this line of argument stresses the importance of modernisation of the economy in terms of the change in the structure of production, in the sense that, had it not been for the employment losses experienced by agriculture, in turn due to its mechanization and modernisation, unemployment would not have unwound as it did. An additional point that could be mentioned here refers to emigration. During the 1960s, it can be argued that the low unemployment rate was partly due to the fact the Spain was "exporting" her unemployment. The fact is that many workers emigrated to other European countries, and this represented a significant "safety valve" for Spanish unemployment. The return of these migrants in the 1970s added an element to the unemployment build-up. There are no comprehensive estimates, however, of their actual impact.
ii) the role of the political transition. Part of the process of modernisation just described was linked to the substitution of a democratic regime for the old "authoritarian" (following the label coined by Spanish political scientists) Francoist system. This implied a new cost for firms, as they now had to face very bellicose trade unions (especially in the early times, before their legalisation) and manage industrial relations, something which they were not ready (or willing) to do. The
uncertainty which the new political situation brought about probably lasted well beyond the death of the dictator in late 1975, and even well after the general elections and the Moncloa Pacts in late 1977. Indeed, the new industrial relations framework was not set up until the end of 1980. This increases uncertainty probably added a genuine element to the process of employment downturn.
iii) the role of the oil shocks. Over the last twenty years, European economies suffered three oil shocks: two negative ones (1973 and 1979) and one positive (1985). As we have already mentioned, the first oil shock was not taken into account by the Spanish policy-makers, more
worried by keeping law and order and unable to ask workers to accept the reduction in real income which the shock implied. The second shock was more taken into account by social partners, who had started a process of "social concertation", and wage agreements including cost-of-living adjustment clauses used to exclude from the latter the increase in imported energy prices. At any rate, the oil shocks meant a decline in demand which added a significant element to the employment crisis which the Spanish economy was suffering. As various authors suggested, the "classical unemployment regime" of the late 1970s gave way to a "Keynesian", demand-deficient regime after
The labour market in Spain, p. iv
iv) the role of macroeconomic policy. In the the late Franco and early post-Franco periods, macroeconomic policy was passive, accomodating wage increases and the supply shock of the first oil crisis. It was impossible for governments to take a harder stance, as the political costs would have been unbearable. This situation lasted until the Moncloa Pacts in 1977, when the agreement with the social partners made it possible to adopt a more open anti-inflationary policy. As already mentioned, this was at some points too strong, and from a simple Phillips curve approach, one can argue that such disinflation brought about the cost of high unemployment. It is interesting to note that in 1981, when the Socialist Party (PSOE) was in the opposition, this Phillips curve argument
was put forward as a criticism to government: inflation, it was argued, was the main concern of government, at the cost of unemployment. When the PSOE won the 1982 elections, they shifted to a more anti-inflationary stance: reducing inflation was considered a precondition for the reduction on unemployment. Would a less marked anti-inflationary policy have permitted a less costly in terms of unemployment (though longer) reduction of inflation? It is unclear, though we tend to think that the answer is negative. Employment losses were deeply rooted in the economic structure and anti-inflation policy probably did not add much to the process. On the contrary, orderly disinflation was necessary both for the normalization of industrial relations and for the ability of the Spanish economy to compete in the open market for which it was heading.
The labour market in Spain, p. ν
vi) the role of labour market rigidity. Finally, in addition to the problem of lack of wage flexibility, discussed above, the lack of employment flexibility was also often mentioned as a factor behind unemployment in Spain. This argument became more popular in the 1980s, when unemployment was reaching recordhigh levels quarter after quarter. The point that was put forward was that firing costs were too high in Spain. However, high or low, they did not prevent 2 million people from being fired between 1980 and 1985, and it may be argued that, had these costs not existed, trade unions would have resisted much more strongly the necessary workforce adjustments of firms, thus aggravating their situation and ultimately leading to a worse situation in terms of employment and unemployment.
In the preceding paragraphs, we have discussed a series of elements which might account for the employment losses of 19751985, which were the primary factor behind the unemployment buildup. The next point to be dealt with is: ¿why did unemployment remain so high during the expansion of the late 1980s, despite the intense GDP and employment growth? Here again, as before, a number of elements may be put forward; the following five ones are worth being stressed:
i) first of all, there was a clear increase in the labour force with respect to the earlier crisis period. Labour force participation rates, especially those for women, started a process of catching up after a period of slower growth. This was compounded with the arrival into the labour market of the largest postwar cohorts, even though one cannot properly mention any "babyboom" effect in the case of Spain.
ii) additionally, the various studies on flows in the labour market suggest that these increased substantially during this period, and this tended not only to speed the process of entry into and exit from the labour market but also worsened the unemploymentvacancies relationship, thus increasing the extent of mismatch existing in the labour market. The massive entry of women might be consistent with this, if the skills they were bringing into the labour market, or the kinds of jobs they might want, would not coincide with the type of jobs the economy was offering. Construction provides a clear example. Despite the existence of a significant unemployment rate, the fact was that skill shortages were being felt as soon as 1988, wages tended to respond upwardly and the number of vacancies left unfilled grew.
The labour market in Spain, p. vi
rested in the increase of turnover which it implied. The side effects of the dual structure which tended to emerge between permanent and fixed-term workers, mostly concerning the higher volatility of employment and the perverse effects on wage bargaining led the government to believe that a reform was needed, although this was not implemented for various reasons, including the lack of agreement with the social partners, most notably the trade unions.
iv) as for macroeconomic policy, the unbalanced policy mix, with a loose fiscal policy after the consolidation efforts of 1986-87, implied that entry into the EMS in 1989, in the wake of the 1988 general strike, in an effort to "buy credibility" and to impose restraint on union behaviour, had to be made at an exchange rate which, with hindsight, may be qualified as implying an overvaluation of the peseta. The resulting high interest rates boosted capital inflows, which tended to appreciate even further the currency, with the result that competitiveness suffered.
v) to many authors, the fact that unemployment did not decrease despite the strong economic and employment growth was sheer evidence that the labour market was not working as efficiently as it should. Three main aspects may be mentioned. First, collective bargaining, with its
intermediate structure in-between a centralized and a decentralized system, appeared to show all the disadvantages of both systems and none of its advantages. As we have argued, however, this should not be overemphasized. Secondly, the unemployment benefit system was considered too generous and preventing an efficient job search by the unemployed (again, we have shown our own doubts about this argument). Partly for these reasons (together with budgetary considerations), the government introduced in 1992 a reform aimed at cutting the unemployment protection system. Finally, firing costs for permanent workers were considered too high, especially in connection with the low or zero costs prevailing in the case of fixed-term workers. Although all of these elements, as we have mentioned, are debatable, especially as causes for the persistence of unemployment, there is no doubt that they indicate that the Spanish labour market institutions had problems which needed a solution.
Finally, in the early 1990s, a recession led the unemployment rate to new record-high levels, after which the Spanish economy entered a new recovery phase, still lasting at present. What elements may be cited to account for these developments? The following ones may be mentioned:
The labour market in Spain, p. vii
quickly than before. The recession of the early 1990s was observed in the OECD area as a whole and hence also in Spain. If anything, it can be mentioned that the important events of 1992 (the Barcelona Olympic Games, the Sevilla World Exhibition) made the expansion somewhat more lasting, by the same token, the recovery has also been an international phenomenon.
ii) at the same time, however, the intensity of the employment adjustment especially in 1992-93 implies that there was a process of structural adjustment in the economy. The strong employment losses in manufacturing and in permanent jobs suggests so. The adjustment of the Spanish economy to the new conditions of world competitiveness, after the breakdown of the socialist regimes of Eastern Europe, together with the high position of the peseta may be mentioned as factors behind this crisis, which meant a second industrial restructuring process, more intense but short-lived than the process which took place in the early 1980s.
iii) as mentioned in the preceding point, the unbalanced macroeconomic policy mix certainly played a role by forcing the peseta to remain at high levels (certainly validated by the foreign exchange markets, probably reflecting the strong committment of the Spanish government with the EMS as well as the high interest rates). The devaluations of 1992-93 restored competitiveness to its 1985 level, thus paving the way for a quick recovery.
iv) finally, labour market policy tried to solve what were perceived as the inefficiencies of the labour market at various points. However, the failure to agree a reform with the social partners led them to adopt a reform in late 1993 which basically aimed at strengthening collective bargaining, but which left virtually untouched many of the basic characteristics of the Spanish industrial relations system, most notably, firing costs. It is still too early to fully assess the effects of the 1994 reform on the labour market. However, the following points should be mentioned.
To begin with, it appears that the general feeling of both employers and employees was that the reform aimed at increasing the power of employers at the firm level. The thrust behind the reform was to shift the balance of labour law from a workers' right conception to a more balanced notion, i.e. by taking into account the needs of firms. The moderate behaviour of wages in 1994 has been interpreted as an effort by unions to avoid the full application of the reform by firms. It could also be, however, as already mentioned, that the strong employment losses weakened union's bargaining position.
The labour market in Spain, p. viii
the decision of the agreeing parties. This could be seen as an element creating a cleavage in the labour market between those workers properly covered by collective bargaining, especially at the firm level, and those workers whose only rights are those determined by law. Although this argument is reasonable, there are no detailed studies on these issues, as the elements involved are varied and complex. There has certainly been a change in the labour market framework, but its consequences are difficult to estimate, and they will probably be felt only in the long run.
There were two changes in the 1994 reform which have attracted more attention from economists: the reform in contracts and the changes in dismissal procedures. As for contracts, the main change was the elimination the fixed-term employment promotion contract. This was seen as a way of fostering permanent employment. However, what appears to have happened is that firms have resorted to other forms of temporary employment, which are even cheaper than the fixed-term employment promotion contract. As for dismissal costs, there have been various elements which have been altered in an effort to reduce them, most notably the intended recognition of the rights of firms to dismiss workers for economic reasons. Although this may have reduced somewhat the costs involved, it does not seem to have changed the situation dramatically. Thus, the dualization of
the labour market which followed the 1984 reform has not been eliminated. On these two accounts, which are related because the main difference between temporary and permanent workers is their dismissal costs, many believe that the 1994 reform was incomplete. Hence the 1996-97 discussions to reach a new agreement between the social partners to achieve yet another reform. The results of this process remain uncertain.
CONTENTS
I. LABOUR MARKET ANALYSIS AND FORECASTS 1
1.1. Demographic trends 1 1.2. Structure of the workforce 6
1.2.1. Introduction 6 1.2.2. Participation rates by age and gender 9
1.2.3. Employment 13 a) Sectorial distribution 13
b) Occupational structure 16
c) Work status 17 d) Working time 20 e) Contract tenure 24 f) Regional variations 29
1.2.4. Unemployment 32 a) Rate of unemployment 32
b) The measurement of unemployment 33
c) The underground economy 41 d) Age and gender variations 44 e) The skill level of the unemployed 48
f) Long-term unemployment 51 g) Regional variations 55 h) Economic hardship and the family 59
1.3. Main trends in job creation and job loss 66
1.3.1. Introduction 66 1.3.2. Labour mobility 67
a) Labour force survey data 67 b) Administrative data 72 1.3.3. Worker and job flows 77
1.3.4. Vacancies and unemployment 80
1.4. Wage and salary trends 82 1.4.1. Introduction 82 1.4.2. Wages, prices and productivity 83
1.4.3. Wages and nationwide agreements 86 1.4.4. Bargained and actual wages 88
1.4.5. Wage differentials 89 1.4.6. Final comments 91 1.5. Macroeconomic policy 92
1.5.1 Introduction 92 1.5.2. Fiscal policy 94 1.5.3. Monetary policy 97 1.5.4. Final comments 99 1.6. Concluding remarks 101 APPENDICES TO CHAPTER I 102
APPENDIX 1: Models of the probability of leaving unemployment and
IL LABOUR MARKET INSTITUTIONS AND LEGISLATION 112 II. 1. The changing legal framework of the Spanish labour market 113
11.2. Public institutions 117 11.2.1. Introduction 117 11.2.2. INEM 117 11.2.3. The MAC units 122
11.2.4. The Labour Inspection 124 11.3. The industrial relations system 125
11.3.1. Unions and employers organizations 125
11.3.2. Collective bargaining 128 11.3.3. Industrial disputes 131
II.3.4. Conclusions: strengths and weaknesses of the system . . 133
11.4. Employment protection schemes 135 11.4.1. The legal framework for individual and collective dismissals . 135
11.4.2. The legal regulation in practice 137 11.4.3. The effects of employment protection schemes on
employment 141 11.5. Regulation of working time 144
11.5.1. Basic legal regulations affecting working time 144
11.5.2. Part-time work 146 11.5.3. Short-time working 147 11.5.4. Career breaks 148 11.5.5. Working time as a policy issue 149
11.6. Minimum wage regulation 150
11.7. Concluding comments 151 Ό
III. LABOUR MARKET POLICIES 152
111.1. Introduction 152 111.2. Passive measures 154
111.2.1. Unemployment benefits: description of the system 154
111.2.2. Unemployment benefits: incidence 157 111.2.3. Unemployment benefits and job search 160
111.2.4. Early retirement policies 165
111.3. Active measures 166 111.3.1. Introduction 166 111.3.2. Labour market training 167
a) The FIP Plan 170 b) Continuing training 171 111.3.3. Employment promotion measures 172
a) Contracts with an economic incentive 172 b) Contracts without an economic incentive 173
c) Public sector jobs 175 111.3.4. Other measures to support entrepreneurial activities and job
creation : 176
a) Unemployment benefit capitalisation 176 b) Promotion of self-employment 177 c) Promotion of employment in cooperatives 177
d) Promotion of local employment initiatives 177 e) Labour market integration of the disabled 178
IV. OTHER POLICIES AFFECTING THE LABOUR MARKET 181
IV. 1. Education and vocational training 181 IV. 1.1. A system in a state of flux 181
IV. 1.2. Rates of enrolment 183
IV.2. Tax and benefit 186 IV.2.1. Taxes on labour 186
IV.2.2. The social protection system 189
IV.3. Industrial policies 191 APPENDIX TO CHAPTER IV 199
V. CONCLUSIONS: WHY IS UNEMPLOYMENT SO HIGH IN SPAIN? 206
The labour market in Spain, p. 1
/. LABOUR MARKET ANALYSIS AND FORECASTS
1.1. Demographic trends
One of the main elements that must be tackled in order to understand the past and the future of unemployment is the role played, and to be played, by the evolution of working-age population. Of the three main demographic factors (fertility, mortality and migrations), fertility is probably the most significant variable in determining the ultimate size and age composition of the population.
Of course, mortality, especially infant mortality is also very relevant in a country like Spain, where the rates were close to 50 per thousand in the 1960 and then dropped to reach the current rate of less than 8 per thousand.
In addition, migration has always been an important factor in Spain, a traditionally "emigration country" which is progressively becoming an "immigration country". Migration was important in the 1950s and 1960s and is often mentioned as a "safety valve" for the Spanish economy, enabling the unemployment rate to stay at very low levels during that period. In the 1970s, there was some returning flows and at present Spain has become the "Southern door" of Europe and it is experiencing increasing pressures from North-African immigrants trying to establish themselves here. At present, however, migration flows are of minor importance in determining the evolution of total population.
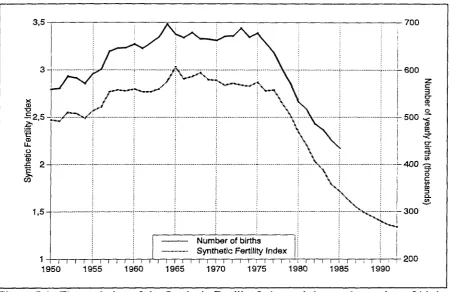
Turning to fertility, one of the main issues refers to the significance of the so-called "baby-boom" of the 1950s and 1960s to explain unemployment in the 1980s. Figure 1.1 presents two indicators of fertility: the synthetic fertility index (SFI, calculated as the average number of children per woman) and the number of recorded births for the period 1950-1990. Within these four decades, three periods can be distinguished regarding the evolution of the SFI: first, it increased until 1965, from 2.5 to 2.9, recovering somewhat from the decline experienced in the previous decade, but never reaching the levels of the 1930s, when it stood above 3.3; secondly, it remained somewhat stable with a slight decline, until 1976; finally, it experienced a sharp decline to its present levels of 1.2-1.3, one of the lowest in Europe. The size of the successive cohorts follows very much the same pattern.
These data suggest two main results:
The labour market in Spain, p. 2
700
^ 6 0 0
500
400
300
><
Φ
S.
Number of births Synthetic Fertility Index
1 I I I I [ I I I i ι ) ) I I I I I I I I I I ) I I I 1 i ι ¡ ι — i I i ι ι — π — Τ Ί — r
[image:20.595.79.530.78.370.2]1950 1955 1960 1965 1970 1975 1980 1985 1990 200
Figure 1.1. The evolution of the Synthetic Fertility Index and the yearly number of births in Spain, 1950-1992 (Source: Olano y Agüero, 1988; Sáez et al. 1995).
years. It is more the sustained nature of the increase, as opposed to its intensity, that characterizes that "baby-boom".
- secondly, the decline after 1976 has been spectacular: the size of the cohorts have almost halved and the SFI has fallen to levels unthinkable twenty years ago. While in the 1970s the SFI was well above the European average (2.9 against 2.4), in the early 1990s, it was clearly below (1.3 against 1.5). While there has been a general decline in all European countries, it has been faster in Spain. As a matter of fact, this sharp decline in fertility is considered by demographers (A.Cabré) a very significant and even problematic development, which may affect the gender balance of population, affecting marriage patterns.
The labour market in Spain, p. 3
1800
1 7 0 0
-1200
1100
1000
MALES 20-24 FEMALES 20-24 MALES 16-19 FEMALES 16-19
1800
1700
1-1600
1500
- 1 4 0 0
1300
-1200
-1100
, . . ι ι M i ι ι ι ; ι ι ; ι : ; ; ι ; ι ι ι ι ι ι ι Ί ι Μ ι ι ι ; , ι ι ι ι ι ι ι ι ι ι ι ι ι ι ι ι ι ι í i ι ι ι ι ι ι ι ! ι ■ · , ι ι ι Γ Τ Τ Τ Τ Τ Τ
¡ 771 I 791 I 811 ι 831 I 851 I 871 I 891 I 911 I 931 . 951 I 781 801 821 841 861 881 901 921 941 961
Year and quarter
[image:21.595.72.525.75.359.2]1000
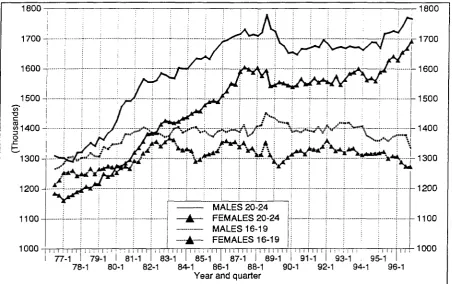
Figure 1.2. The evolution of youngsters in Spain, 19761996 (Source: EPA).
the sampling frame used in the EPA, which has tended to correct (partially) the bias of the
age structure against people between 20 and 45 (more on this later on).
The consequence of this decline has not yet been felt in the labour market, but it will
imply that workingage population will be growing at an ever slower pace eventually starting
to decline while the ageing of population will continue.
It is worth insisting on this future evolution of population. The Spanish Statistical
Office has just released a full set of population projections for the period up to 2020, on the
basis of the results of the 1991 Census. Figures 1.3 and 1.4 present the results of these
projections for the workingage population (1664 years old) both in absolute levels and in
terms of the percentage distribution for three main age groups: less than 30, 3044 and 45
and over.
The projections indicate that working age population is at present reaching a
maximum, after which it will tend to decline. By 2020, workingage population will have
returned to its 1990 level. However, there will have been very significant changes in its age
composition. Thus, while in 1990 people between 45 and 64 years of age represented 32
percent of males and 35 percent of females, by 2020 it is projected that they will represent
The labour market in Spain, p. 4
14.000.000
12.000.000
10.000.000
8.000.000
6.000.000
-4.000.000
2.000.000
14.000.000
12.000.000
10.000.000
■ 8.000.000
-6.000.000
- 4.000.000
2.000.000
Ο Ί Ί Ί Ί Ί Ί Ί Ί Ί Ί 'i ι , Ί Ι Ί Ί Ί Ί Ί Ί Ί , , Ί Ί Ί Ί Ί Ί Ί Ι ι Ί Ί Ί Ί Ί Ί Ί Ί 'ι 'ι 'ι ' ι 'ι Ί Ί 'ι 'ι 'ι
1990 1995 2000 2005 2010 2015 2020 1990 1995 2000 2005 2010 2015 2020
MALES FEMALES
igure 1.3. Population projection and its age distribution, by gender, 1990-2020 (Source: INE, Proyecciones de la Población de España, 1995).
Ί i ι ι ι ι Ί Ί Ί Ί Ί . ! ' ι ι Γ Τ Γ τ τ τ τ τ τ τ Γ Γ Τ τ Ί ; ι Γ τ τ Τ τ τ η τ Τ τ τ Γ Τ Τ Γ Π Ι I I I I
1990 1995 2000 2005 2010 2015 2020 1990 1995 2000 2005 2010 2015
MALES FEMALES ■f5
0 2020
Figure 1.4. Projected population age structure, by gender, 19902020 (Source: INE, Proyecciones de la Población de España, 1995).
longterm view, Spain a country with the highest unemployment rate in the European union
The labour market in Spain, p. 5
countries, in some 30 years or earlier.
What consequences can be obtained from these population projections from a labour market viewpoint? Figure 1.5 presents an exercise aimed at illustrating it. It presents a projection of labour force and sets the employment path required for the unemployment rate to be 10 percent by 2015 and remain at that level thereafter. The labour force projection is based on various assumptions regarding age-specific participation rates (more on this later on). The basic message to be drawn from these projections is that, while it is true that in 25 years the Spanish unemployment problem could be eased by the demographic trends, the interim period still requires substantial employment creation. Of course, an alternative route could be simply wait; but this would certainly impose other costs. An additional issue which should be borne in mind is the substantial ageing not only of total population but also of labour force and employment. This could impose costs in terms of productivity growth. However, this goes beyond the scope of our study.
18.000.000
17.000.000
16.000.000
15.000.000
14.000.000
13.000.000·
12.000.000
- * - * - * . ,A' Employment
18.000.000
17.000.000
16.000.000
15.000.000
^ 1 4 . 0 0 0 . 0 0 0
13.000.000
1995 2000 2005 -i 1 1 1 1 ; 1 Γ" 2010 2015 2020 12.000.000
The labour market in Spain, p. 6
1.2. Structure of the workforce
1.2.1. Introduction
The Spanish economy has undergone a complete transformation during the last three decades. The labour market has been one of the areas where this transformation has been most traumatic. The evolution of unemployment in Spain differs from that of other Western Europeans countries, mainly in the employment shifts described (destruction of jobs from 1975 to 1985 followed by an impressive recovery from 1985 to 1990 and again by a strong but shorter recession). Thus, after a review of the Spanish experience over the past 25 years, any account of the evolution of Spanish unemployment must provide explanations for the following:
(i) the big employment losses of the 1975-85 period;
(ii) the strong employment recovery during the second half of the 1980s; (iii) the persistence of unemployment despite this strong employment recovery; (iv) the lack of social turmoil despite the very high levels of unemployment.
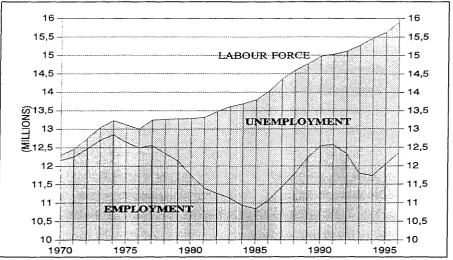
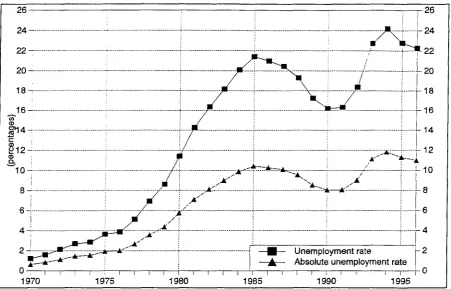
Any analysis of the labour market situation in Spain must start with a general depiction of what has been happening over the last 25 years with employment, unemployment and the labour force. Figure 1.6 presents such a depiction, based on homogeneous figures going back to 1970. Five main periods may be distinguished since 1970:
- first, between 1970 (as a matter of fact, since the 1960s) until 1974, employment grew at a moderately high rate, enough to keep pace with the evolution of the labour force, somewhat eased, as already noted, by the emigration flows, mostly towards Northern Europe. So unemployment remained at rather low levels;
- between 1974 and 1977, both employment and the labour force tend to stagnate. This is a period full of uncertainties in Spain, marked by the political transition from the Franco dictatorship towards democracy;
The labour market in Spain, p. 7
16
1970 1975 1980 1990
16
[image:25.595.70.524.77.337.2]1995
Figure 1.6. The evolution of the labour force, employment and unemployment in Spain, 1970-1996 (Source: EPA, homogeneous series, average yearly figures).
- the period 1985-1991 witnessed the most vigorous period of employment creation of recent Spanish history, including the best years of growth in the 1960s and early 1970s; the earlier worldwide recovery, together with the decline in oil prices, fueled this expansion; the labour market reform of 1984, whereby the use of fixed-term contracts was generalized also played a part, albeit a limited one. In this period, however, the labour force also increased very rapidly, mostly due to higher female participation rates. On the whole, despite a total employment increase of 1.8 million jobs, unemployment only decreased by 500 thousands, for a rate on 16 percent.
- between 1991 and 1994, the Spanish economy experienced a very severe recession, with employment losses which were more intense than those of the earlier crisis; however, this crisis was much shorter than the preceding one and in mid-1994 employment began to recover; one interesting element of this crisis is that, contrary to what most people expected employment losses were not particularly concentrated among fixed-term workers, with the exception of the downfall at the end of 1992.
The labour market in Spain, p. 8
renewal of the sampling units of the EPA (Labour Force Survey) undertaken over 1995 and 1996. Although there are not yet official estimates of this overestimation, the Ministry of the Economy has put forward a figure of 1.7 percent in its macroeconomic framework included in the 1997 budget. Non-government observers would tend to consider this a reasonable figure.
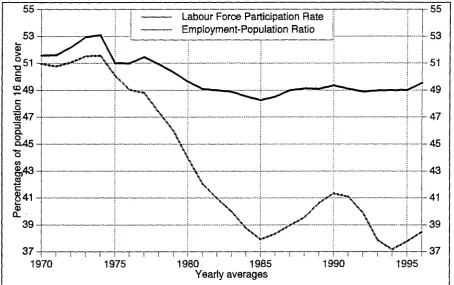
Figure 1.7 summarises the evolution just described in terms of the global participation rate and employment-population ratio. As can be seen, the labour force participation rate (labour force divided by population 16 and over) has tended to decline since 1977, with a minor change in the late 1980s. At present, it tends to remain stable at 49 per cent, one of the lowest in the European Union. As for the employment rate, its movements have been more intense than elsewhere in the Union, thus imparting to the Spanish economy a substantial relative employment volatility.
~—ι—r
1980 1985 Yearly averages
[image:26.595.76.531.357.642.2]1 I I I 1995
The labour market in Spain, p. 9
1.2.2. Participation rates by age and gender
In the preceding section, we have seen than the global labour force participation rate
has tended to remain rather stable over the past fifteen to twenty years. This stability,
however, hides significant divergences in terms of gender- and age-specific participation
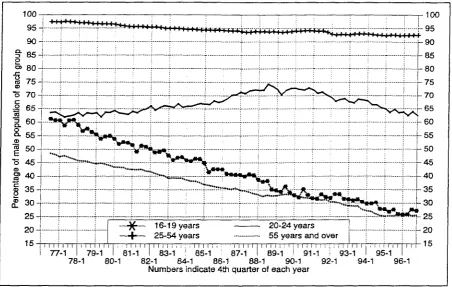
rates. Figure 1.8 presents the evolution of the male and female participation rates, while
Figures 1.9 and 1.10 present the corresponding figures for the different age-and-gendet
groups.
Figure 1.8 shows the clear differences existing between men and women regarding
labour market participation. Thus, the female activity rate shows a persistent upward trend:
slowly in the late 1970s and early 1980s, much more strongly in the late 1980s, at the time
of the employment boom, and sustained in the early 1990s, despite the economic recession.
As for males, their participation rate follows a continuing decline. Thus, while in 1976 over
75 percent of males over 16 worked or wanted to do so, twenty years later that proportion
had dropped to just over 60 percent.
These general trends of the global participation rates by gender are the result of
various trends in the age-specific rates. Thus, in the case of females, as Figure 1.9 shows,
youngsters under 20 have tended to drop from the labour market. This is due to the extension
80
— | — MALES — A — FEMALES BOTH 80
75
ι ι ι i I I I M i ι / ι ■ ι I ) I ■ ι Ι ί Ι Ι Ι Ι Ι Μ Ι ι ι ■ Ι ι I I Ι Ι ι I Ι ι ¡ i i Μ ι Ι ι ι ι ι ι ι I Ι ι ■ — ι I I I Ι ι . . . I I I I I I I I
771 I 791 I 811 I 831 I 851 I 871 I 891 I 911 i 931 ! 951 I 781 801 821 841 861 881 901 921 941 961
Year and quarter
The labour market in Spain, p. 10
of the educational system which took place mostly in the 1980s and which kept on even in the booming times of the late 1980s. On the contrary, those between 20 and 24 follow a much more stable path, varying around 60 per cent during the period as a whole. The only period where this stability is broken in the booming period of the late 1980s when the participation rate for this group increased a little. The most significant evolution for women corresponds to the 25-54 age group. These prime-age women are the main propellers of the global females participation rate: their rate almost doubled in the past twenty years, from just over 30 per cent to close to 60 per cent. The upwards trend is more accentuated after 1980. The decline in fertility, already commented in section 1.1 is probably not independent from this evolution (either as a cause or as an effect, probably as both).
A more disaggregated analysis in terms of age groups would reveal that what is happening, first, is that the traditional model of relatively high activity in the early years of life followed by a dropout at the time of marriage or first birth is being abandoned by Spanish women. More and more, the pattern is becoming the typical inverted U typical of males. At the same time, however, as shown by Garrido (1993), women in their late 30s and 40s also increased their participation in the 1980s, provoking a "return" movement which had not been so important in the past in Spain. On both accounts, the participation of women has increased dramatically in recent years. Finally, the participation rate of women over 55 has been declining from an already rather low level.
The labour market in Spain, p. 11
100
95-1 *ΊτιιτϊΓϊϊϊΐΓϊΓννιτιττιτ^ί77,;νπΓ;7ιπΪΗΐιΙ
100 95
25 20-I 15
~X— 16-19 years - + — 25-54 years
20-24 years 55 years and over
- Γ Τ Τ Τ Γ Γ Τ TTTTTT
78-1 95-1
I ¡ I I I I I i ι I I I I I ι | ι . Ι Ι ι Ι Ι Ι Ι Ι Ι Ι ι , i . , ι ι ι ι ι , — I I I I I I I I I I
771 I 791 I 811 I 831 ! 851 ' 871 I 891 I 911 i 931
801 821 841 861 881 901 921 941 961 Numbers indicate 4th quarter of each year
-90
-85
80
r 75
70
1-65
60
55
50
45
40
35
30
25
20
[image:29.595.79.532.77.364.2]15
Figure 1.9. Labour force participation rates of men, by age groups, 19761996 (Source: EPA, homogeneous series)
75 7 0
X — 1619 years ~ + — 2554 years
2024 years
55 years and over
75
70
65
60
55
50
45
40
35
30
25
20
15
10
5
; ■ ι ι Ι ι | ι ι ι , ι ι ι I . . ι ι ι : Ι ι ι ι I ι : . , I I I I ¡ I i Ι ι i ι ι i ι Ι Ι Ι Ι ι ι , I i I I i Ι ι | ι I I . I I I I I I 771 I 791 I 811 I 831 ! 851 ; 871 I 891 I 911 I 931 i 951 I
781 801 821 841 861 881 901 921 941 961 Year and quarter
[image:29.595.76.529.417.698.2]The labour market in Spain, p. 12
To complete this analysis of labour force participation rates by age and gender, it is useful to study the complete distribution by five-year age groups at the two extreme moments of time considered: 1976 and 1995 (4th quarters). Figure 1.11 presents this information. This graph portrays the declines already mentioned in male participation rates as well as the strong increase in adult female participation rates. The latter reflects the fact that women less and less follow the "traditional" pattern abandoning the labour market when getting married or having their first baby. Rather, it seems that once they enter a job, they are there to stay even after marrying. In fact, as illustrated in Cebrián, Moreno and Toharia (1997), married women (even with young children at home) are the group whose participation and employment rates have increased most. However, this is not due to higher entry into employment after marriage. Rather, it appears to reflect what we have just mentioned: women enter the labour market before marrying and remain there for good.
16-19 20-24 25-29 30-34 35-39 40-44 45-49 50-54 55-59 60-64 65-69 70 y+
[image:30.595.72.522.359.658.2]Age groups
The labour market in Spain, p. 13
1.2.3. Employment
We have already seen in the Introduction to this section the tremedous shifts in employment experienced by the Spanish economy. The purpose of this sub-section is to deal with various specific dimensions of employment to study their evolution. More specifically, the following characteristics shall be considered:
- sectorial distribution - occupational distribution - work status
- working time - contract tenure - regional variations
a) Sectorial distribution
Agriculture has been historically an important sector in Spanish economy, with a considerable proportion of rural population. Nevertheless, since the years of development in 1960s, agriculture employment has experienced a strong downward trend linked to its modernisation. This process went hand in hand with significant rural-urban migratory flows, especially in the 1960s and 1970s. However, the process has taken place even during the crisis periods of the 1980s and 1990s, as well as, and more significantly, during the recovery of the late 80s. In this case, rather than migration flows, what happened was that many of the agricultural workers simply retired. Figure 1.12 presents the breakdown of employment by broad sectors in the period 1976-95. In addition, Figure 1.13 presents the evolution of employment in the different sectors, expressed as index-numbers relative to the initial point (1977).
Over this twenty-year period, the share of agricultural employment has dropped by more than half, from 22 per cent to just under 9 per cent. This proportion is still higher than in other European countries and is expected to keep falling, although perhaps at a less fast rate. As already mentioned, the decline in the share of agricultrual employment was rather concentrated in the 1985-1990 period, although it has been a persistent phenomenon.
The labour market in Spain, p. 14
similar to that observed in other Western economies. Perhaps the most significant development was the substantial increase (although not enough to change the declining trend of the share) in the level of employment during the expansion of the late 1980s.
Construction has behaved in a rather cyclical way, as is characteristic of this sector in every country. Its employment share has remained around 10 per cent during most of the period although during the crisis of the 1970s and early 1980s its employment loss was very significant: at the trough of the crisis (1985), its share was only 7 per cent. During the recent recession, however, construction appears to have managed to maintain its share, although 1993, after the preceding booming years, partly fueled by the various international events that took place in Spain (most notably, the Olympic Games in Barcelona and the Universal Exhibition in Sevilla, both in 1992), was also a bad year for this sector (see Figure 1.13).
Finally, the service sector has experienced a strong increase. Two phenomena may be mentioned behind this increasing share. First, during the 197785 crisis period, the increasing share was the result of employment remaining constant in the sector while decreasing elsewhere in the economy. That constancy was, in turn, the result of a significant increase of public sector employment while private services also lost employment. After 1985, however, the increasing share was due to the very fast growth of private services,
70 65 60
AGRICULTURE CONSTRUCTION
INDUSTRY SERVICES
...*
■ l **»w
i ¡jp«·«·«·»«·* ' 70
65
60
•55
ι Ι ι ι ι Ι ι ι ι Ι ι ι ι Ι ι ι ι ί ι ι ι Ι ι ι ι Ι ι ι ι ι ι ι ι Ι ι ι ι ι ι ι ι Ι ι ι ι Ι ι ι M i l l ΓΓΓΓΤΠ
77-1 I 79-1 I 81-1 I 83-1 I 85-1 I 87-1 I 89-1 ! 91-1 ' 93-1 ! 95-1 I 78-1 80-1 82-1 84-1 86-1 88-1 90-1 92-1 94-1 96-1
[image:32.595.73.526.447.735.2]Year and quarter
The labour market in Spain, p. 15
while the public sector also grew but much more moderately. During that period, employment in the service sector grew at an average annual rate of about 6 per cent. Overall, this sector represented about two-thirds of the recovery in employment of 1985-1991. Business and personal services were the most active industries during that period. In the recent crisis, employment in services has declined, this being due to the inability of public employment to act as a buffer in the way is had done in the early 1980s. However, as that decline was smaller than the general employment fall, the share of services kept increasing. On the whole, Spain has clearly become a service economy. Services now represent the majority of jobs. However, as recent researchers have pointed out (Fina, 1996) in some respects the development of services in Spain lags behind that in other European countries. This is so, in particular, when considering not just the employment share of the service sector but the number of service jobs as a proportion of total population, a better measure of the amount of services actually provided to society.
[image:33.595.69.525.372.654.2]77 78 79 80 81 82 83 84 85 86 87 88 89 90 91 92 93 94 95 96
The labour market in Spain, p. 16
b) Occupational structure
Any study of the evolution of the occupational structure in Spain is hindered by the fact a new classification of occupations, which follows the ISCO.COM classification approved by the European Union, was adopted in 1994. At present, no homogeneous series have been developed. So our analysis will cover the period 1977-1993. This should be enough to detect the main trends in occupational change. Figure 1.14 presents the distribution of non-agricultural employment by broad occupational groups in 1977, 1985, 1990 and 1993, the four cyclical turning points of the recent twenty years. Agricultural occupations have been taken out of the analysis, as their inclusion would introduce biases given the significant drop of agricultural employment, as seen in the preceding sub-section.
The main result from Figure 1.14 is the clear increase of non-manual occupations, which represented a bit less than 36 per cent of employment in 1977 and grew until 45 per cent 16 years later. Within this broad groups, two categories experienced the fastest growth: professional and technicians, the share of which almost doubled, and "clerical" workers.
The former group reflects the modernisation of employment in Spain, as well as the increasing importance of the public sector, one the main employers of professional workers. Still, however, the proportion is likely to keep increasing in the future, as it is smaller than in other parts of the Union.
As for the latter group, it deserves a specific comment. It has been defined as the residually defined (i.e. "Others not elsewhere classified") sub-group within the larger group of "Administrative and clerical workers". What is interesting is not only that this presumably residual sub-group should be larger in numbers than the rest of the group but also that it is the fastest growing category. Of course, part of the problem relates to the classification of occupations, which was increasingly becoming obsolete, but the trend observed implies nonetheless a distinctive characteristic of occupational change in Spain, towards new administrative jobs.
These changes take place against a decrease in the proportion of manual production workers, whose share falls from 44 to 35 per cent. So over the past 15 years, it can safely be argued that the Spanish economy has experienced, broadly speaking, a process of
"skilling" of its employment. Production work has been progressively replaced by non-manual work.
The labour market in Spain, p. 17
50
c45 E
M 1977 1985 H 1990 1993
¡35 ça 2 3 0 υ
Ì3>25
cä
§20 o
Φ 1 5 ·
D) CO
¡ΙΟ
Ι 5
J U SO
■45
4 0
35
30
25
20
15
1 0
5
I Managers Clerical I Service Unskilled
Prof.&Techn. Administrative Sales Production Armed Forces Occupational groups
Figure 1.14. Distribution of nonagicultural employment by broad occupational groups, 1977, 1985, 1990 and 1993 (Source: EPA).
changes in sectorial structure analysed above. The shiftshare analysis carried out by Garcia Serrano, Jimeno and Toharia (1995), on which the preceding analysis also draws, aimed at disentangling the relative significance of purely occupational as opposed to industrial effects in these changes, indicates that the sectorial effect dominated during the crisis, while the occupational effect was more significant in the recovery of 198590. Finally, in the second crisis, both effects had similar impact.
c) Work status
Work (or profesionnal) status is an important dimension in the study of employment, for two reasons: first, public sector employment has had an increasing role in all Western economies; secondly, selfemployment has tended to gain weight as a form of employment. These two facts imply that the nature of employment may have changed considerably, hence the interest of determining their precise evolution.
The labour markec in Spain, p. IS
workers) and people who work on their own account (self-employed). Employees can be divided between those who work for the private sector and those who work for the public sector as the nature of the employer is fundamentally different in these two cases. In turn, the self-employed may be divided into people who employ others, people who work on their own, family workers who help in a family business (in principle, without pay) and people who work on their own account associated with others in cooperatives.
The process of capitalist economic development entails the growth in the number of employees and the reduction in the number of self-employed. This process is partly dependent on the industrialization process, as the agricultural sector, where the self-employed are dominant, loses weight. In order to perceive the alleged growing importance of employment, it is thus necessary to separate employed in agriculture from the self-employed elsewhere in the economy.
As a starting point, Figure 1.15 presents the evolution of the proportion of employees in total employment over the last twenty years. In the figure, we have included four percentages corresponding to the following categories: total employees, private-sector employees, public-sector employees (the difference between the two preceding ones), and government employees (i.e. the public sector excluding public enterprises).
Over the last twenty years, the proportion of employees in total employment has remained relatively stable, especially if account is taken of the fact that in the early 1960s the proportion was much lower, around 60 per cent. Still, three periods can be distinguished: the crisis period, from 1977 to 1985, when the proportion of employees, especially in the private sector, follows a clear downward trend, absorbed by the increasing share of public-sector employment. As already mentioned, the public public-sector acted during that period as a (partial) buffer of employment decline. The boom period of the late 1980s saw a renewed growth of the importance of employees, whose share in total employment went up almost 10 points, to 75 per cent by 1991. Finally, the recent crisis has seen again a small drop in the proportion of employees, again somewhat more visible in the case of the private sector.
The labour market in Spain, p. 19
100 — 9 5 · 90 85 —
Total employees Private sector employees Public sector employees Government employees
— 100 ■495
490
t r 85 1 L 80
^ i - M ^ , ■ ■ . I ■ . . . ι ι ι ι ι ι ι I I I Ι M I I I I » I I I I Ι Ή I I ■*■' I . _
4 ) Ι Ι Ι | Ι Ι Ι < Ι » Ι Ι | " Ι Ι Ί Ι " " ' I
τ-10 5
I I I i i I I Ι Ι Ι Ι ι ι Ι Ι Ι Ι Ι Ι Ι ι I I I I I I I í : ; ι ι ι I I I I I I I I I I ( I I I I I I ,' I i I I I I i i ι ι ι I I I I I I I j Ι Ι Ι Ι ί ι ι | I I
77-1 I 79-1 I 81-1 I 83-1 I 85-1 I 87-1 I 89-1 I 91-1 I 93-1 I 95-1 I 78-1 80-1 82-1 84-1 86-1 88-1 90-1 92-1 94-1 96-1
Year and quarter
igure 1.15. Proportion of employees (total, private-sector, public-sector and government) in total employment, Spain, 1976-1996 (Source: EPA, homogeneous quarterly data).
thus transposing to them the risks associated with the market uncertainty.
The preceding information treated the self-employed as a group. We have already mentioned, however, that such group contains a quite diverse number of components. Figure 1.16 thus presents the yearly change in employment of the categories identified above (with cooperatives included within self-employed) in the four periods we are considering: the two crises of 1977-85 and 1990-93 and the two expansions of 1985-90 and 1993-present.
The labour market in Spain, p. 20
450 400 350 300 250 200 •3 150 S 100 50 O -50 -100 -150-f -200 -250
Γ£3 Private sector employees fãs] Public sector e m p l o y e e s ggjj Employers ^ Agricultural selfemployed
V7\ NonagrlcurturaJ serfemployed f§¡ Famllly workers
äSS ÏZZL
197685 1 98790 199093 1 99396
450
4 0 0
[350
Í300 i250
r 200
150
1 0 0
5 0
0
50
100
150
2 0 0
250
'igure 1.16. Average yearly change of employment by work status, 197685, 198790, 199093, and 199396 (Source: EPA).
a period of employment expansion. This period is still too short to be conclusive, though,
and it is necessary to wait and see if the trend is confirmed. Beyond this very last instance,
however, the data sustains on the whole the hypothesis of selfemployment as a defensive
device used in bad periods.
Finally, family workers and agricultural selfemployed show a clearly declining trend,
these being two developments probably linked to one another.
d) Working time
No consistent series on usual working hours exist in Spain before 1987 as before that
date only the number of hours actually worked was included in the Labour Force Survey.
However, given the approval in 1983 of a maximum working week of 40 hours, it is worth
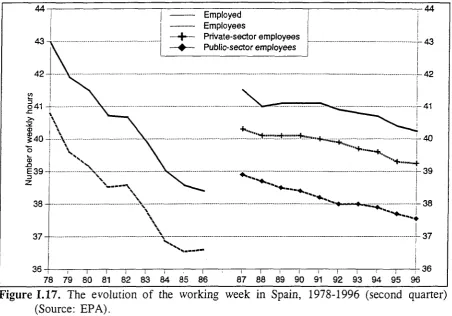
analyzing the data, however problematic. Figure 1.17 presents the series for the period 1979
1996 (figures refer to second quarter of each year). Between 1979 and 1986, the figures refer
to hours actually worked; a distinction is made between the employed as a whole and the
employees. For 198795, the figures refer to the more correct indicator of hours usually
The labour market in Spain, p. 21
τ 1 1 1 ι : r
[image:39.595.66.519.77.393.2]78 79 80 81 82 83 84 85 86 87 88 89 90 91 92 93 94 95 96 Figure 1.17. The evolution of the working week in Spain, 1978-1996 (second quarter)
(Source: EPA).
further element to the analysis.
The clear conclusion to be drawn from this figure is that working time tended to decrease quite substantially in the period 1978-1985, and that no specific, adeed influence from the 1983 law can be observed. During the period of the expansion, the working week tended to remain stable. However, with the new recessionary period, the downward trend takes on again, this time around continuing even in the recovery.
The labour market in Spain, p. 22
the proviso that all people who declare a working week below 30 hours are to be considered part-timers and those who declare a working week over 35 hours are to be considered full-timers.
With these caveats in mind, the data in Figure 1.18 clearly indicate a rising trend of part-time work since 1992, while it tended to remain stable, actually declining somewhat in the 1987-1991 period. There is no clear reason why the trend changed. The break in the series does not appear to be a sufficient explanation. In addition, no measures were adopted regarding part-time work until the end of 1993, when government changed a few aspects of part-time. The somewhat accelerated growth observed in 1994 and 1995 might be the result of such measures, but not the preceding, already upward, trend.
At any rate, at present (second quarter of 1996), 17 percent of women employed work part-time. The proportion is much smaller in the case of men. These figures are lower than in other parts of the European Union, but are already reaching a substantive level, especially for women. Still, part-time, as in other countries, is fundamentally a female phenomenon: women account for 75-80 per cent of part-time work.
4 I 2 I 4 I 2 I 4 95-1 3 96-1 3
The labour market in Spain, p. 23
The corollary of the rising trend in part-time work is that the observed decline in the working week could be due to a composition effect related to the growing importance of these part-timers. In order to verify that point, Figures 1.19 and 1.20 present the evolution of the number of hours usually worked by full-time and part-time workers in the period 1987-96 (second quarter). As can be seen, full-time workers show a rather stable pattern of evolution after 1989, with a slight decrease in the case of females, especially in recent years. As for part-timers, leaving aside the case of males, the number of which is rather small, there appears to be a decreasing trend with a jump in 1992, probably associated with the break in the series already mentioned.
On the whole, the observed decline of the average working week in recent years can be associated with the rise in the proportion of part-time workers. In the case of full-time workers, especially for males, the average usual working week has tended to remain rather stable over the past few years. An additional element in that decline has been the slight downward trend in the usual number of hours workers by females part-time workers. The proportion of part-timers has tended to increase in recent years, although no clear relation can be established betweeen that evolution and the reforms introduced in 1993-94, one of the aims of which was fostering the use of part-time work.
44,0 44,0
43,5
43,0
-42,5
42,0
41,5
1987 1988 1989 1990 1991 1992 1993 1994 1995 1996
The labour market in Spain, p. 24
21,0-1987
•21,0
r 20,5
20,0
-19,5
19,0
18,5
18,0
17,5
17,0 1988 1989 1990 1991 1992 1993 1994 1995 1996
Figure 1.20. Usual number of weekly working hours, part-time workers, by gender, 1987-1996 (second quarter) (Source: EPA).
e) Contract tenure
One of the main characteristics of the evolution of employment in Spain has been the substantial increase in the proportion of workers with a fixed-term (i.e. temporary for reasons different from the temporary nature of the job) contract. Thus, the proportion of employees with a fixed-term contract has substantially increased since 1987, the first date for which information is available. As is well-known, Spain is the European country with the highest proportion of fixed-term employees, although comparisons should be made with care, as institutional differences must be taken into account, especially as regards the definition of a "permanent" worker.
already-The labour market in Spain, p. 25
1 2 1 4 I 2 I 4 I 2 I 4 I 2 I 4 I 2 I 4 I 2 I 4 I 2 I 4 I 2 I 4 I 2 Ì 4 I 2 I 4
87-1 3 88-1 3 89-1 3 90-1 3 91-1 3 92-1 3 93-1 3 94-1 3 95-1 3 96-1 3
Year and quarter
Figure 1.21. Evolution of the percentage of employees with a fixed-term contract, by gender 1987-1996 (Source: EPA).
mentioned renewal of the sampling frame of the Labour Force Survey (no official estimates of such impact exist, though).
The analysis by gender introduces a few qualifications. First, the evolution of the proportion of fixed-term employees mirrors quite closely the aggregate figure in the case of males. Secondly, the figures are higher in the case of females, and they also tend to rise more quickly. However, their record-high rate of almost 40 percent is reached at the end of 1991, with a stabilisation afterwards in figures around 38 percent.
The labour market in Spain, p. 26
employment crisis of 1975-85.
Quite surprisingly, however, it is not so clear that the employment declines are always concentrated on fixed-term employees, as one could have expected. As can be seen in Table 1.1, while the losses in dependent employment have tended (for seasonality reasons) to be concentrated in the winter period, only in 1992-93 was the decline in the number of fixed-term workers clearly higher than that corresponding to permanent employees. The conclusion to be drawn is that for the most part the 1991-93 recession was of a structural nature, as suggested by the substantial decline in the number of permanent employees. Only in 1992, when the international events of that date (the Universal Exhibition in Seville and the Olympic Games in Barcelona) were over, was there also a significant decline in the number of fixed-term employees.
Table I.I.- Change in the number of employees by contract status in the three winters of the recent recession (thousands).(Source: EPA)
III-91/I-92 III-92/I-93 III-93/I-94
Total employees -312.1 -423.4 -182.6
Fixed-term +4.2 -318.2 -49.5
Permanent -316.5 -105.2 -133.1
The substantial weight of fixed-term employment has also raised other kinds of comments and criticisms. From the trade union perspective, it has been criticized for the precarious working conditions it implies for workers. From a more academic perspective
The labour market in Spain, p. 27
proportion of fixed-term employees has tended to stabilise or decline somewhat. However, no clearcut change in the trend can be observed which could be attributed to the 1993-94 reform.
A further point refers to the extent to which fixed-term contracts represent a temporary or a permanent situation for their holders. In principle, it could be argued that fixed-term workers are interesting to firms because they allow them to expand production without having to incur in substantial costs should things turn wrong, as the separation costs of this type of workers is very low, in any case much lower than the firing costs associated with permanent workers. Our preceding analysis suggests at the same time that fixed-terms contracts are, at least in some instances, the entry-level contracts which employers tend to use no matter the uncertainty of the economic situation. What is interesting, thus, is that employers are willing to convert some of their fixed-term workers into permanent employees, even before they are required by law to do so.
To deal with this issue, it is possible to take advantage of the fact that the Labour Force Survey (EPA) is renewed by sixths every quarter, so that it is possible to follow the situation of people over six succesive quarters. One can therefore know how many of those with a fixed-term contract are converted into permanent workers over a given period. Table 1.2 present this type of analysis for periods of one year. Thus, the table provides the distribution of people with fixed-term contracts at one point in time by their situation one year later, the period covered being 1987-1996 (we shall deal more extensivelt with flows of workers -and jobs- in sub-section I.Ill below).
Table 1.2.- Situation one year later of fixed-term workers, 1987-96 (Source: matched files of the EPA)
Initial/final quarters II. 87/11.88 II.88/II.89 II. 89/11.90 II.90/11.91 II.91/II.92 II. 92/11.93 II.93/II.94 II.94/II.95 II.95/11.96 Notes: Fixed-term employee 48.6 56.6 57.6 63.7 57.5 56.9 63.0 64.4 62.7 Permanent employee 22.0 19.1 17.8 12.8 14.0 9.4 9.2 10.8 11.0 Unemployed 18.0 14.6 14.9 14.1 17.0 23.7 19.6 16.4 17.3 Out of labour force 5.5 3.8 5.0 4.3 6.5 5.5 4.6 4.9 5.3 Other (*) 5.9 5.9 4.6 5.1 5.1 4.5 3.5 3.6 3.7 TOTAL 100 100 100 100 100 100 100 100 | 100
The labour market in Spain, p. 28
One important caveat regarding the figures presented in Table 1.2 is that we only observe the contract status of individuals at two points in time without being able to establish a definite connection betweem them. That is, when we use the word "conversion", what is to be understood is that the same individual who first mentioned a fixed-work status one year later mentions a permanent one, but we are not sure that there was a change within the same firm. At the same time, those who remain with a fixed-term contract do not necessarily are all the intervening period working for the same firm. It could be that they work for the same firm with a 6 month contract but between the two they experienced an unemployment spell. The problem is that questions regarding seniority refer to "the present job" and it is likely that a person whose fixed-term contract is given a permanent status might consider that a new job is starting. Despite these caveat, however, the figures in the table do provide an
important insight regarding changes in labour contracts.
The labour market in Spain, p. 29
f) Regional variations
Spain is divided into 17 regions, so-called 'Autonomous Communities'. This division dates from 1978 and it is linked to socioeconomic and cultural factors (the regions are aggregations of provinces created in early 19th century). The South and North-West regions (Andalucía and Galicia) have usually been the most underdeveloped regions with relatively high proportions of agricultural employment. Northern regions (Basque Country, Asturias and Cantabria) had a high proportion of mining and heavy manufacturing (iron and steel) employment, before the processes of industrial restructuring of the early 1980s. Since the mid-1980s, the most dynamic areas have been the Mediterranean regions (from Cataluña to Murcia, the Ebro valley, Aragón, Navarra and La Rioja) as well as Madrid, Baleares and Canarias.
The 17 regions are far from being homogeneous. As Table 1.3 shows, the four largest of them in terms of population (Andalucía, Cataluña, Madrid and Comunidad Valenciana) contain 55 per cent of population. As a result of the large migration flows of the 1950s and 1960s, population tends to be concentrated in the center (Madrid) and along the coasts (mainly along the Mediterranean). Population in the South tends to be younger, as fertility rates have been declining more slowly there.
Table 1.3, which refers to the second quarter of 1996, also shows substantial variations in the various labour market indices included. In terms of employment, the employment-population ratio varies from a low of 32.5 per cent in Extremadura to a high of 45.6 in the Baleares, the average for Spain as a whole being 38.5 per cent.