White Rose Research Online URL for this paper:
http://eprints.whiterose.ac.uk/79953/
Version: Accepted Version
Article:
Villard, PF, Vidal, FP, ap Cenydd, L et al. (7 more authors) (2014) Interventional radiology
virtual simulator for liver biopsy. International Journal of Computer Assisted Radiology and
Surgery, 9 (2). 255 - 267. ISSN 1861-6410
https://doi.org/10.1007/s11548-013-0929-0
eprints@whiterose.ac.uk https://eprints.whiterose.ac.uk/
Reuse
Unless indicated otherwise, fulltext items are protected by copyright with all rights reserved. The copyright exception in section 29 of the Copyright, Designs and Patents Act 1988 allows the making of a single copy solely for the purpose of non-commercial research or private study within the limits of fair dealing. The publisher or other rights-holder may allow further reproduction and re-use of this version - refer to the White Rose Research Online record for this item. Where records identify the publisher as the copyright holder, users can verify any specific terms of use on the publisher’s website.
Takedown
If you consider content in White Rose Research Online to be in breach of UK law, please notify us by
Noname manuscript No.
(will be inserted by the editor)
Interventional Radiology Virtual Simulator for Liver
Biopsy and Nephrostomy
P.F. Villard · F.P. Vidal · L. ap Cenydd · R. Holbrey · S. Pisharody · S. Johnson · A. Bulpitt · N.W. John · F. Bello · D. Gould
the date of receipt and acceptance should be inserted later
Abstract We present here a new simulator for vis-ceral needle puncture training in interventional radi-ology. This is the result of a close collaboration be-tween different universities, involving computer scien-tists, clinicians and clinical engineers. Together, we ad-dress the need of segmentation, physically-based mod-elling, haptics rendering, pseudo-ultrasound generation and the conception of a mannequin required to build an efficient real-time simulator. Clinical face and con-tent validations have also been performed and show the reliability and effectiveness of this framework.
Keywords Biomedical computing· Image segmenta-tion·Simulation·Virtual reality
1 Introduction
This paper presents work that has been carried out by a six University partnership (CRaIVE consortium: Col-laborators in Radiological Interventional Virtual
En-P.F. Villard
LORIA, University of Lorraine, France. E-mail: Pierrefrederic.Villard@loria.fr
P.F. Villard·F. Bello
Imperial College London, UK
F.P. Vidal·L. ap Cenydd·N.W. John
School of Computer Science, Bangor University, UK.
R. Holbrey·A. Bulpitt
School of Computing, University of Leeds, UK.
S. Pisharody
Department of Computer Science, University of Hull.
S. Johnson
Manchester Business School, University of Manchester, UK.
D. Gould
Royal Liverpool Hospital, UK.
vironments), to address issues in training in interven-tional radiology (IR). IR procedures rely on the inser-tion of a needle, catheter or guide-wire for patient diag-nosis or treatment, guided by radiological imaging (flu-oroscopy, ultrasound, etc.). This paper focuses on the core skills of ultrasound-guided needle puncture, using the liver biopsy and nephrostomy tasks, which require careful use of ultrasound to guide a needle into a liver mass for diagnosis, or into the renal collecting system for drainage, respectively. The manipulative and hand-eye coordination skills required are exacting though are, currently, usually acquired during an apprenticeship in patients.
instru-ments, specific patient anatomy and the physiological motion of respiration.
A recent state of the art on researches into patient-specific virtual reality medical simulation is presented in [16]. The primary potentials of those simulators are also training and planning rehearsal but few of them have metrics, face an content validation and none of them use ultrasound guidance and simulate respiration behavior. One of the key contribution of this paper is precisely to gather all theses component together.
The design and development of a liver biopsy and nephrostomy simulation platform was based on a de-tailed Cognitive Task analysis (CTA) which identified the functionalities and metrics required using procedu-ral videos and interviews with field experts. The CTA data are publicly available via the project website1
. This approach resulted in a virtual environment that is customised to specific patient data, including mod-elling and deformation of organ motion, haptics render-ing, and the concept of a physical mannequin. The sim-ulation’s metrics evaluate relevant steps of the trainee’s performance. The simulator has been validated in ra-diology departments, with interventional radiologists with different levels of expertise to assess its face, con-tent and construct validity [8].
2 Method
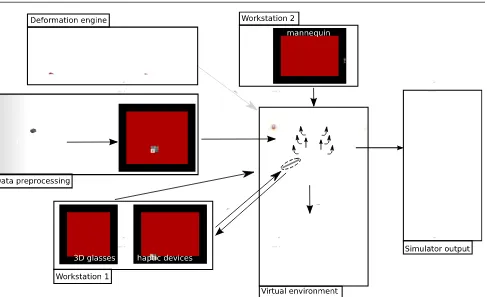
This section presents in detail the main technical com-ponents that have been addressed to build the simula-tor. Our strategy was to divide the simulator into two separate workstations. The first (Workstation one) uses a mannequin to locate the incision and insertion point for the operation, thus recreating the physical contact with the patient (palpation, anatomical landmarks, arm rest, etc.). Once this location is defined, the user moves to the second workstation (Workstation two), which comprises a virtual environment with two haptic de-vices, one to perform needle insertion, the other to use an ultrasound probe for needle guidance. We have cho-sen to use a virtual environment in workstation two in order to support anatomical variability, a range of pathologies and patient specificity. The general work-flow of our simulator is presented on Fig. 1.
2.1 Virtual Anatomy
The CTA data provided key anatomical and physiolog-ical properties encountered during the liver biopsy and nephrostomy tasks. Anatomical structures were graded
1
http://www.craive.org.uk (last accessed: 6/01/2013)
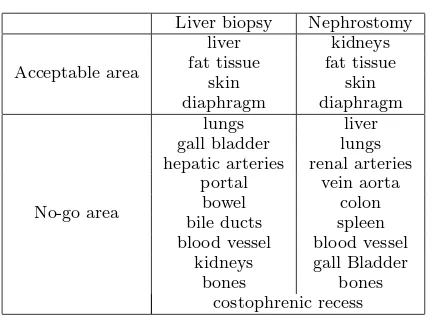
Liver biopsy Nephrostomy
Acceptable area
liver kidneys
fat tissue fat tissue
skin skin
diaphragm diaphragm
No-go area
lungs liver
gall bladder lungs hepatic arteries renal arteries
portal vein aorta
bowel colon
bile ducts spleen blood vessel blood vessel
kidneys gall Bladder
bones bones
[image:3.595.296.519.83.242.2]costophrenic recess
Table 1 No-go area
to provide metrics that determine whether needle in-sertion is into ‘acceptable’ or ‘no-go’ areas (. Many of these are not represented in commercial simulators cur-rently available [e.g. Mentice2
], but some of the struc-tures/regions identified during the CTA are of further interest and, as far as we know, are unique to this project. The ‘acceptable’ and ‘no-go’ anatomical struc-tures are discussed below:
Costophrenic recess: During deep inhalation the re-gion between the diaphragm and the ribs opens slightly so that the lungs can expand into this space. It is not desirable to penetrate the membrane where this lung expansion occurs due to the risk of injury to the lung. The membrane and recess, however, are not usually vis-ible in medical images and thus cannot be segmented using existing tools. In our breathing model, this re-gion is defined as a narrow wedge-shaped strip within the rib-cage.
Rib-bundles: The position and motion of the ribs are significant in many respects. Palpation of the ribs is of-ten undertaken initially to find suitable entry locus (see Section 2.7). Where procedures are performed inter-costally, it is important to avoid the neuro-vascular bundle which runs just below the rib, and can cause se-vere bleeding if injured. In effect, the entry point needs to be just above a rib, rather than just below.
Liver vessels: The liver receives blood supply and contains a central bile duct to the gall-bladder. How-ever, it is where these vessels emerge from the liver that potential damage during a biopsy procedure can become critical, as bleeding is less contained and there-fore considerably more serious. Hence, it is important to model these structures where they emerge from the liver.
2
Interventional Radiology Virtual Simulator for Liver Biopsy and Nephrostomy 3
Fig. 1 General overview of the simulator showing all the components from the preprocessing step to the simulator output. It also shows the two workstations.
2.2 Image segmentation
Techniques for segmentation of 3D image data can be classified according to the level of automation achieved. Fully or partially automated schemes, such as thresh-olding or active shape modelling, are at one extreme, whilst manually assisted segmentations are at the other. Other researchers have used a rule-based approach, such as Chiet al[3], who used local edge enhancement near the ribs to provide a constraint for a liver growth model. Bottger et al [2] used simplex meshes driven by user-selected points and image gradients to assist the seg-mentation of 4D heart ventricle and lung data.
In our approach, a number of other constraint-based controls are applied. The main component employed is the narrow-band level-set algorithm offered by ITK-Snap3
, in which ‘seeds’ grow within locally competing regions [18]. The technique assumes that forces gener-ated by intensity gradients in the image can be balanced by geometric constrains depending on curvature in a local neighbourhood of points both of the segmented object, and from other global parameters selected by the user.
3
http://www.itksnap.org/ (last accessed: 06/01/2013)
Additional constraints are taken into account when necessary at each step of the segmentation, based on the output of the previous step. Bones are the most natural constraint and are relatively easy to obtain us-ing thresholds applied on the computed tomography (CT) data. However two aspects need to be taken into account: the use of contrast agents and the separation of adjacent bony ribs, in order to facilitate building an accurate breathing model. The lungs are also relatively easy to obtain by thresholding.
[image:4.595.50.537.78.375.2]cap-tured in this way at the point where they exit the liver, as impact of the biopsy needle is much more hazardous in this case.
In order to use the rib-cage as a general constraint, we employ the method of Hoppes [7] on point data gath-ered from the interior of the ribs, soft ribs, etc. However, as the density of the data is much greater within the ribs, it must be sub-sampled and smoothed, followed by interpolation between the ribs. For the latter, we used linear kriging. Inputting this data into Hoppes’ method then produces a 3D field, which is zero at the computed constraint location, and positive/negative to either side. In our implementation, this allows the user to adjust the position or thickness of the constraint to achieve the best possible outcome. This tool is partic-ularly useful where the level-set method leaks into the region of rib muscle, but it is also effective for separating conjoined items such as bony ribs and spinal processes. The other organs were obtained through a mixture of the above mesh and morphological tools, apart from the costophrenic recess where the breathing model was used to generate point data at the maximum inhalation and exhalation positions.
The organs segmentation result is a labelised voxel image. This data is converted into organ meshes after applying the marching cube algorithm on each label and processing the mesh with decimation and smoothing.
2.3 Soft Tissue Deformation
The simulator is then composed of a 3D triangular mesh environment, facilitating dynamic ultrasound render-ing. The virtual organs are not static and may undergo rigid motion or deformation, which could not be easily computed using a voxel-based environment. Such organ motion is a very important cue for the image guidance during the needle insertion. Accuracy is of lesser impor-tance in this case: trainees need to be aware of the organ motion, even though it may not be 100% accurate.
There are many methods in the literature for soft tissue deformation. A recent review of these methods [13] presents an evaluation according to three characteris-tics: mechanical realism, topology management, and speed of computations. Our simulation requires real time behaviour of the virtual tissues as they interact with the needle and with each other. Based on this re-quirement we chose the Chainmail algorithm [6] as it offers an acceptable trade-off between quality of defor-mation and computational complexity.
We first discretise the geometry into nodes and tri-angles. The distance between two nodes is parameterised by three Chainmail parameters: the compression, which
defines its minimum value; the stretch, which defines its maximum distance; and the shear, which adds the in-fluence of the tangential displacement to the distance value. The initial topology changes in time according to those parameters and given boundary conditions (dis-placements). When a displacement is applied to a node, it moves by the given value. If the displacement is small, the neighbours may not move depending on the Chain-mail parameters. When the displacement is large enough, adjacent nodes will be affected and may propagate the motion to their own neighbours depending, and so on (See Fig. 2). In 2D, letA(xa, ya) be the vertex that is
being moved andB(xb, yb) a vertex in its direct
neigh-bourhood. Let∆xand ∆ybe distances defined as fol-lows:
∆x=|xa−xb |;∆y=|ya−yb|| (1)
Letαmin,αmaxandβbe the controlling parameters
for compression, stretching and shearing respectively. Given x0
a, ya0 and za0 the new position of A, it is then
possible to define the boundary for the valid region, assuming thatxb≥xa andyb≥ya:
xmin =x0a+ (αmin∆x−β(∆y)) (2)
xmax=x0a+ (αmax∆x−β(∆y)) (3)
ymin =y0a+ (αmin∆y−β(∆x)) (4)
ymax =ya0 + (αmax∆y−β(∆x)) (5)
with (xmin, ymin) and (xmax, ymax) the lower and
upper corners of the bounding box of the valid region re-spectively. The Chain Mail algorithm requires that one initial element is moved in order to start a deformation. Practically, we use the 3D extension of the chainmail defined in [3].
Interventional Radiology Virtual Simulator for Liver Biopsy and Nephrostomy 5
x
∆y
B(xb,yb)
A(xa,ya)
∆
A A’
B
B’
Fig. 2 Chain mail algorithm. Left: original position of A and B, right: A is moved to A’ but B is not in the valid region anymore: it is moved to the nearest point of the valid region
2.4 Respiratory Motion
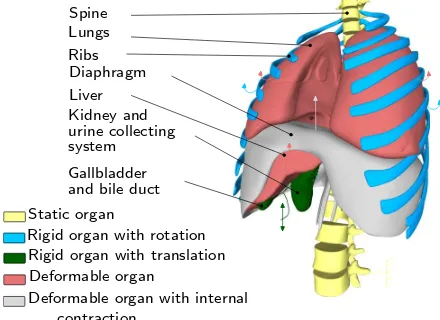
Simulating respiratory motion is vital to ensure a high level of realism on the simulator. The virtual patient should be able to breathe or hold the breath when re-quired. Furthermore, it should be possible to vary the type of breathing: tidal breathing, hyperventilation, di-aphragmatic or thoracic breathing, etc. Hence, we chose to use a simulated online respiration model, instead of a pre-computed model such as in [14]. We divided the thoracic organs and the viscera into five categories (see Fig. 3): 1- static rigid organs, 2- rigid organs with rota-tional motion 3- rigid organs with translarota-tional motion, 4- deformable organs, and 5- deformable organs with internal contraction.
Liver Diaphragm Ribs Lungs Spine
system
Gallbladder and bile duct Kidney and
Deformable organ
Rigid organ with translation Rigid organ with rotation Static organ
Deformable organ with internal urine collecting
contraction
Fig. 3 Organ motion categories during respiration
According to this classification, the spine belongs to the first group. It could be considered as static if the patient lies on a bed. Moreover, all the bones are assumed to be rigid bodies as the deformations are neg-ligible. The ribs, on the other hand, belong to the sec-ond group. Their motion is associated to rotations as described in [17]. Each rib is defined by a rotation cen-tre and two types of rotation: one in the spine axis (as a pump handle), and a second one in the anterior-posterior axis (as a bucket handle). The rotation mag-nitude could vary, as well as the frequency of this
kine-matic movement. The organ targeted in the procedure belongs to the third group. In the case of liver biopsy, the tumour is experiencing a sinusoidal translation in-side the liver. In the case of nephrostomy, the kidneys and the collecting system are having a similar motion also the longitudinal axis. Other viscera whose defor-mation could be neglected such as the gallbladder are included in this group. For larger organs where the deformations are noticeable, the Chainmail algorithm is used. Such organs are passive and then linked to surrounding organs that impose constraints within the Chainmail loop. This is the case of the lungs compressed by the ribcage and the diaphragm, and of the liver com-pressed by the diaphragm. Both lungs and liver belong to the fourth group. The diaphragm is slightly different as it is subject to internal contraction and thus belongs to the fifth group. Its deformation is also linked to a surrounding organ (ribs). To capture the complex be-haviour of the diaphragm, we modelled it as a heteroge-neous body composed of a rigid part (the tendon), and an elastic part (the muscle). The contraction and relax-ation actions of the diaphragm muscle are modelled by a variable (amplitude and frequency) sinusoidal motion of the tendon propagated through the chainmail algo-rithm. A more detailed explanation of our respiratory motion model can be found in [15].
2.5 Haptic Rendering
The simulator is physically composed of two haptic de-vices. The first one is used to simulate the probe ma-nipulation. There is basic collision detection and colli-sion response with the patient’s skin and based on the device position and orientation ultrasound rendering is performed (see Section 2.6). The second haptic device is used to simulate needle insertion. Experts acknowledge that force feedback when inserting a needle through the liver needs particular attention. Therefore, force feed-back for this organ is treated differently from that of the other organs within our simulator. Forces gener-ated by two needles (18 G Kimal4
, 21 G Chiba5
) during punctures of fresh porcine liver specimens (<3 hrs post-slaughter) were measured using a validated sensor [9] . Ten measurements at 10 different liver sites were ac-quired at constant needle velocities of: 50 mm/min, 125 mm/min, 250 mm/min and 500 mm. The obtained force data was plotted against displacement and time. Various models of needle insertion can be found in the
4 safety fistula needle manufactured by Kimal,
http://www.kimal.co.uk/ (last accessed: 06/01/2013)
5
[image:6.595.51.254.84.144.2] [image:6.595.50.270.412.572.2]literature [5]. We have chosen an analytical model [11] based on a succession of exponential-like rises before and after liver capsule penetration, and proportional to needle insertion depth, was fitted to the experimental data, and used to render force feedback during needle insertion within the simulator. This model is the base of our haptic rendering for the puncture of the liver. The force feedback provided for other organs is based on Hooke’s law. For a given type of tissue, a look-up table (LUT) of stiffness coefficient has been empirically defined by our medical collaborators. Force feedback for a particular tissue type is then proportional to this co-efficient and the depth of penetration of the needle be-tween two successive iterations of the haptic rendering algorithm. The change in elasticity between different tissues is based on the CT scan voxel gradient. When the needle passes from one kind of tissue to another, a rise in stiffness is felt because the tip of the needle has to perforate the surface of the underlying tissue. This boundary between tissues is determined using the norm of the CT scan voxel gradient. After the penetration of the tissue, its stiffness parameter is extracted from the LUT. In addition to these models, a lateral constrain-ing force is applied to the needle to ensure it follows a straight trajectory once it has been inserted through the skin, just as it would during a real procedure where it would be difficult to move the needle off its initial trajectory. The haptic device used in the simulation to mimic the needle provides 6 degrees of freedom (DOF) in tracking, but only 3 DOF in force feedback. Hence, the force is applied just to the end point of the sty-lus and, because there is no torque, the stysty-lus can be moved freely in all directions and orientation (pitch, roll and yaw). To address this deficiency, the orientation of the stylus is ignored during the puncture stage and the needle is constrained to follow a straight line, unless the needle tip remains in superficial tissues (i.e. up to 2 cm below the skin surface). This reflects the fact that during real procedures, the angle of the needle may be adjusted slightly whilst the needle tip is still located in superficial tissues to successfully reach the target. This trade-off between affordability and accuracy may have some impact on the fidelity of the simulator.
2.6 Ultrasound Rendering
The ultrasound renderer generates real-time, ultrasound-like images of the dynamic patient model, given the po-sition and orientation of the virtual probe. As the main objective of the simulator is to teach hand-eye coordi-nation (as opposed to ultrasound image interpretation skills), the renderer aims to reproduce the salient fea-tures of an ultrasound image, such as bone and gas
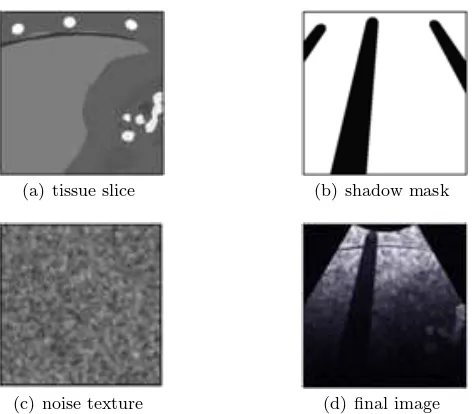
shadowing, boundary reflection, attenuation and noise speckle. Three images are generated by the renderer for every frame: i) a tissue slice, ii) a shadow mask, and iii) a speckle noise texture. These are passed to a GLSL (OpenGL Shading Language) shader for compo-sition, enhancement and filtering, producing the final displayed image. The first step in our algorithm is to render a thin slice of the mesh environment, given the position and orientation of the ultrasound probe (see Fig. 4(a)). An Orthographic projection gives the axis-aligned box representing the ultrasound image-plane. The horizontal and vertical clipping planes are scaled by the required ultrasound slice thickness, whereas the near clip plane is set to zero.
(a) tissue slice (b) shadow mask
(c) noise texture (d) final image
Fig. 4 Ultrasound image composition.
To render the tissue slice, the mesh environment is rendered into a frame buffer object (FBO) using a two-sided stencil buffer operation in order to: i). in-crement when rendering back-facing polygons, and ii). decrement on front-facing polygons. During the first rendering pass, colour write is disabled. This opera-tion results in the desired tissue mask being stored in the stencil buffer after a single rendering pass. For the second rendering pass, the same scene is drawn again, with colour and depth writes enabled. The stencil buffer mask rejects any tissue fragment not intersecting the ultrasound image-plane.
[image:7.595.301.537.285.492.2]Interventional Radiology Virtual Simulator for Liver Biopsy and Nephrostomy 7
the forthcoming fragment shader. The green and blue channels of the tissue image are used for specifying the presence of a contrast agent, and any organs currently tagged as needle targets respectively.
While it is possible to perform this part of the ren-dering process on all meshes at once, any intersecting meshes in the scene will cause artifacts in the final image. Due to the dynamic meshes used in our sim-ulation, we chose to render objects of differing tissue types in separate rendering passes. This does result in a small reduction in performance, but produces a clean image where tissues are clearly defined. In US imaging, hard structures like bone completely reflect the ultra-sound wave, resulting in a shadow being cast behind such structures. Similarly, acoustic shadowing due to sound reflecting at gas/tissue interfaces also result in a darkening of more distal structures. This effect can be simulated by post-processing the red channel of the previously rendered image slice to create a separate shadow mask (Fig. 4(b)). As each tissue is assigned a brightness based on its Hounsfield value, it is pos-sible to identify the presence and location of bone and gas in the rendered image. Each pixel in the shadow mask is initialized to 1. The rendered tissue image is then processed on the CPU using the Bresenham’s line algorithm (which approximates the sweep of a curvi-linear transducer based on the imaging depth), with corresponding pixels in the shadow mask lying behind bone/gas structures set to a lower value.
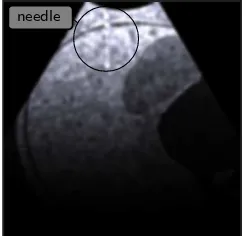
Speckle noise is observed in all real ultrasound im-ages. In our simulation, the noise is represented by a stack of 2D image textures, loaded into the graphics card’s memory as a 3D texture. This 3D texture ‘box’ represents voxel noise inside the patient model, and is scaled and rotated to fit the boundary of the virtual pa-tient. Knowing the position, orientation and depth of the ultrasound probe’s imaging plane, and the virtual patient’s configuration, we can sample a corresponding 2D multiplanar reconstruction of noise for the ultra-sound image (see Fig. 4(c)). Fig. 5 shows an example of the needle’s appearance in our ultrasound renderer. The needle is part of the mesh environment, and is therefore rendered into the tissue image along with all the patient meshes. The needle’s geometry is split into two sections: i) the shaft, which is shaded very faintly, and ii) the tip, which is made much brighter. The displacement of local tissue due to needle shaft penetration is approxi-mated by shifting the coordinates of the noise texture sampling appropriately: the effect being a subtle dis-placement along the needle’s shaft, with the needle tip being much easier to locate due to its brightness.
In the final rendering stage, all three generated im-ages (tissue slice, shadow mask and noise texture) are
combined within a GLSL compositing shader. In or-der to renor-der the correct sector shape for a curvilin-ear transducer at the chosen depth, only pixels that lie within a calculated mask are processed.
Bright reflections occur in US images at certain in-terfaces, such as between fat/tissue. This effect is gen-erated in the final image by detecting and enhancing horizontal edges using a Sobel filter to compute the gradient direction. Reflections will occur when the gra-dient direction along the vertical axis of the image is above a given threshold. Other effects are also applied, including reducing the image brightness with increasing distance from the probe, and adjusting the image con-trast and brightness using shift/scale filters. Finally, a Gaussian filter shader is used to smooth out any pixel-lation or processing artefacts in the ultrasound image (see Fig. 4(d) and Fig. 5).
needle
Fig. 5 Needle in rendered ultrasound image (top left)
2.7 Mannequin
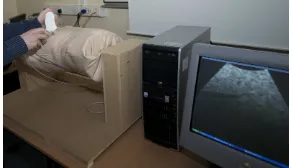
[image:8.595.355.478.321.439.2]de-scribed previously, mapped to probe movement across the mannequin. The ultrasound probe switches on when in contact with the skin surface. A magnetically tracked scalpel was also designed to enable the radiologist to make a skin nick to identify the point for needle inser-tion. A switch at the tip of the scalpel was used to acti-vate position marking. The mannequin was mounted on a specially designed stand to enable rotating it along its spine, thereby allowing the radiologist to position the patient as required for individual procedures. A poten-tiometer was used to measure mannequin rotation in order to reproduce rotational movement on the patient in the virtual environment. The patient rotation and skin nick markings were passed to the second worksta-tion to identify the needle puncture site.
Fig. 6 Mannequin ribcage synchronised with the virtual en-vironment (3D meshes and ultrasound rendering)
2.8 Metrics
A crucial advantage of using a computer-based simula-tor for training is the ability to assess the performance of each individual user, as well as follow his/her progres-sion. This can be achieved by recording or calculating performance metrics during the procedural simulation. Based on interviews of subject matter experts (SMEs), various metrics of interest have been proposed to as-sess all the crucial steps identified in the task analysis. In particular, they reflect the experts’ judgment about the crucial steps that the trainee must do and avoid during the intervention. Several of these proposed met-rics have been implemented. They can be classified in different categories as detailed below.
The first set of metrics is composed of tick boxes. They are of two kinds. The first kind is linked to the preparations before and after the procedure. The user can confirm that various actions have been completed: “check the patient’s data”, “check if there is no air in the syringe”, “add local anaesthetics”, “ensure urine drips”. The second kind is done during the manipula-tion. The user ticks them while doing the tasks: “do the skin nick”, “check if the needle is moving with the
respiration”, “ask the patient to hold his breath”, “ask the patient to breath again”. The chronology of these tasks is also tested with a clock function integrated in the interface. The total time to perform the procedure is therefore also saved as a metric.
[image:9.595.88.234.296.380.2]Interventional Radiology Virtual Simulator for Liver Biopsy and Nephrostomy 9
3 Results
3.1 Integration
The algorithms previously described were implemented in C++ using the H3D6
framework, an API handling haptic interaction as well as graphics rendering. A ma-jor challenge was to successfully integrate the code from the four participating centres. The final simulator pro-totype is composed of two workstations. Workstation 1 (WS1) consists of the mannequin with the ultrasound display (see Section 2.6). Workstation 2 (WS2) is com-posed of a SenseGraphics 3D Immersive Workbench7
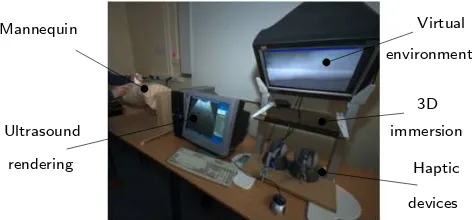
presenting the virtual environment in 3D, using two Phantom Omni for the haptic rendering (see Section 2.5), and the same ultrasound screen as WS1 (see Fig. 7 ). The sequence of the simulation is as follows: 1) the user is invited to scan the mannequin on WS1 and to per-form the skin nick as discussed on 2.7. 2) This location is then passed on to WS2 and displayed to show where the needle should be inserted. After inserting the nee-dle through the first layer of fat, the user can stop the patient’s breathing and verify that the organ motion has stopped on the ultrasound screen before proceed-ing further. As the needle is inserted, the metrics (see 2.8) record the triangulation between the needle, the ultrasound-scanning plane and the target. Once the tar-get is reached, the quality of the operation is evaluated through the computed metrics and the simulation ends. Ultrasound rendering is performed throughout the pro-cedure, together with organ motion due to respiration (except during the brief interruptions or breath holds). The virtual environment is extracted and generated as described in 2.1.
Mannequin
Ultrasound
rendering
3D
immersion
Haptic
devices environment
Virtual
Fig. 7 Workstation 1 and workstation 2 integration
6 http://www.h3dapi.org/ (last accessed: 06/01/2013) 7
http://www.sensegraphics.com/ (last accessed: 06/01/2013)
3.2 Validation results
Following development of the simulator and implemen-tation of the performance metrics, a validation study of the liver biopsy procedure was conducted [8]. Par-ticipants with varying degrees of expertise in interven-tional radiology completed the simulated liver biopsy procedure and the utility of the performance metrics as differentiators between levels of expertise in Inter-ventional Radiology was investigated. Ethical approval was granted by the Liverpool Research Ethics Com-mittee (UK) and Interventional Radiology participants from three UK hospitals completed the simulated liver biopsy procedure (consultant n=14, trainee n=26). Par-ticipant scores on the performance metrics were com-pared using independent t-tests and ANOVA to in-vestigate differences between groups. Independent t-tests revealed significant differences between trainees and consultants on 3 performance metrics: targeting, p = 0.018, t = -2.487 (-2.040 to -0.207); probe usage time, p = 0.040, t = 2.132 (11.064 to 427.983); mean needle length in beam, p = 0.029, t = -2.272 (-0.028 to -0.002). Specifically, consultants: obtained significantly better “biopsy samples” than trainees; used the probe signif-icantly less than trainees (suggesting they were more proficient and better able to locate the target); had sig-nificantly more needle length in the beam than trainees (indicating greater proficiency in needle identification and tracking). ANOVA reported significant differences across years of experience (0-1, 1-2, 3+ years) on seven performance metrics: no-go area touched, p = 0.012; targeting, p = 0.025; length of session, p = 0.024; probe usage time, p = 0.025; total needle distance moved, p = 0.038; number of skin contacts, p<0.001; total time in no-go area, p = 0.008. Each of these was in the expected direction. Inspection of the mean scores for each of the 19 liver biopsy performance metrics revealed that, al-though only these 7 were significant, the metrics fol-lowed a predictable pattern across experience. That is, more experienced participants received better perfor-mance scores on each of the perforperfor-mance metrics. The acceptability and utility of the simulator to participants was also indicated with 84% of participants agreeing it would be useful in learning the steps of a procedure, and 81% believing it would be useful for procedure re-hearsal. The quality of the feedback provided by the simulator was also indicated with 80% of participants reporting the feedback as accurate.
4 Conclusion
[image:10.595.43.279.543.653.2]real life characteristics of the procedures, such as pa-tient breathing, ultrasound and haptics rendering. The simulator’s content is aligned with a target curricu-lum (Royal College of Radiologists) and includes case scenarios based on patient-customised anatomical data which can be used to train nephrostomy or liver biopsy. Studies of the effectiveness of the simulation have been performed in collaboration with interventional clinicians and include content validation where end-user feedback was positive. Construct validity was demonstrated with experts performing significantly better than trainees on a number of performance metrics [8]. It was concluded that it is possible to measure and monitor performance using simulation, with performance metrics providing feedback on skill level in relation to specific aspects of the procedure. This should enable participants to iden-tify those elements of a procedure they have either mas-tered or that require further skill development. This is likely to be useful during training, particularly given the known difficulties in gaining significant practice of core skills in patients. We are currently exploring possi-bilities for further development and refinement leading to commercial exploitation.
Acknowledgements We would like to thank the late Roger Phillips for his contribution in the project.
References
1. Bauer, C., Aurich, V., Arzhaeva, e.a.: Comparison and Evaluation of Methods for Liver Segmentation From CT Datasets. IEEE Transactions on Medical Imaging28(8), 1251–1265 (2009)
2. Bottger, T., Kunert, T., Meinzer, H.P., Wolf, I.: Appli-cation of a New Segmentation Tool Based on Interactive Simplex Meshes to Cardiac Images and Pulmonary MRI Data. Academic Radiology14(3), 319–329 (2007) 3. Chi, Y., Cashman, P.M.M., Bello, O., Kitney, R.I.: A
dis-cussion on the evaluation of a new automatic liver vol-ume segmentation method for specified ct image datasets (2007)
4. Fornage, B.: A simple phantom for training in ultrasound-guided needle biopsy using the freehand tech-nique. J Ultrasound Med.8, 701–3 (1989)
5. van Gerwen, D.J., Dankelman, J., van den Dobbel-steen, J.J.: Needle-tissue interaction forces - a survey of experimental data. Medical Engineering & Physics (2012). URL http://www.sciencedirect.com/science/ article/pii/S1350453312000938
6. Gibson, S.F.: 3D chainmail: a fast algorithm for deform-ing volumetric objects. In: Proc Symp on Interactive 3D Graphics, pp. 149–154 (1997)
7. Hoppe, H., DeRose, T., Duchamp, T., Mcdonald, J., Stuetzle, W.: Surface reconstruction from unorganized points. In: Computer Graphics (SIGGRAPH ’92 pro-ceedings), pp. 71–78 (1992)
8. Johnson, S., Hunt, C., Woolnough, H., Crawshaw, M., Kilkenny, C., Gould, D., Sinha, A., England, A., Vil-lard, P.F.: Virtual reality, ultrasound-guided liver biopsy
simulator: Development and performance discrimination. British Journal of Radiology (2011). DOI 10.1259/bjr/ 47436030
9. Karuppasamy, K., Zhai, J., How, T., Gould., D.: De-velopment and validation of an unobtrusive sensor for in-vivo force data collection during interventional proce-dures. CardioVascular and Interventional Radiology32, 22–23 (2008)
10. Lovquist, E., O’Sullivan, O., Oh’Ainle, D., Baitson, G., Shorten, G., Avis, N.: Vr-based training and assess-ment in ultrasound-guided regional anesthesia: From er-ror analysis to system design. In: MMVR, vol. 163, pp. 304–310. IOS Press (2011)
11. Maurin, B., Barb´e, L., Bayle, B., Zanne, P., Gangloff, J., de Mathelin, M., Soler, L., Forgione, A.: In vivo study of forces during needle insertions. In: Proceedings of the Medical Robotics, Navigation and Visualisation Scientific Workshop 2004. Germany, Remagen (2004)
12. McNamara, M., McNamara, M.: Preparation of a home-made ultrasound biopsy phantom. J Clin Ultrasound 17(6), 456–8 (1989)
13. Meier, U., L´opez, O., Monserrat, C., Juan, M.C., Alca˜niz, M.: Real-time deformable models for surgery simulation: a survey. Comput. Methods Prog. Biomed.77(3), 183– 197 (2005)
14. Stern, J., Zeltser, I.S., Pearle, M.S.: Percutaneous renal access simulators. J Endourol21(3), 270–3 (2007) 15. Villard, P.F., Vidal, F.P., Hunt, C., Bello, F., John,
N.W., Johnson, S., Gould, D.A.: A prototype percuta-neous transhepatic cholangiography training simulator with real-time breathing motion. Int J Comput As-sist Radiol Surg 4(6), 571–578 (2009). DOI 10.1007/ s11548-009-0367-1
16. Willaert, W.I.M., Aggarwal, R., Van Herzeele, I., Cheshire, N.J., Vermassen, F.E.: Recent advancements in medical simulation: patient-specific virtual reality sim-ulation. World J Surg 36(7), 1703–12 (2012). DOI 10.1007/s00268-012-1489-0
17. Wilson, T.A., Legrand, A., Gevenois, P.A., De Troyer, A.: Respiratory effects of the external and internal intercostal muscles in humans. Journal of Physiology530(2), 319– 330 (2001)