This is a repository copy of
Photochemical pump and NMR probe : Chemically created
NMR coherence on a microsecond time scale
.
White Rose Research Online URL for this paper:
http://eprints.whiterose.ac.uk/84256/
Version: Published Version
Article:
Torres, Olga, Procacci, Barbara orcid.org/0000-0001-7044-0560, Halse, Meghan E.
orcid.org/0000-0002-3605-5551 et al. (7 more authors) (2014) Photochemical pump and
NMR probe : Chemically created NMR coherence on a microsecond time scale. Journal of
the American Chemical Society. pp. 10124-10131. ISSN 0002-7863
https://doi.org/10.1021/ja504732u
[email protected] https://eprints.whiterose.ac.uk/
Reuse
Items deposited in White Rose Research Online are protected by copyright, with all rights reserved unless indicated otherwise. They may be downloaded and/or printed for private study, or other acts as permitted by national copyright laws. The publisher or other rights holders may allow further reproduction and re-use of the full text version. This is indicated by the licence information on the White Rose Research Online record for the item.
Takedown
If you consider content in White Rose Research Online to be in breach of UK law, please notify us by
Photochemical Pump and NMR Probe: Chemically Created NMR
Coherence on a Microsecond Time Scale
Olga Torres, Barbara Procacci, Meghan E. Halse, Ralph W. Adams, Damir Blazina, Simon B. Duckett,
*
Beatriz Eguillor, Richard A. Green, Robin N. Perutz,
*
and David C. Williamson
Department of Chemistry, University of York, Heslington, York YO10 5DD, U.K.
*
S Supporting InformationABSTRACT: We report pump−probe experiments employing laser-synchronized reactions of para-hydrogen (para-H2) with
transition metal dihydride complexes in conjunction with nuclear magnetic resonance (NMR) detection. The pump−probe experi-ment consists of a single nanosecond laser pump pulse followed, after a precisely defined delay, by a single radio frequency (rf)
probe pulse. Laser irradiation eliminates H2 from either
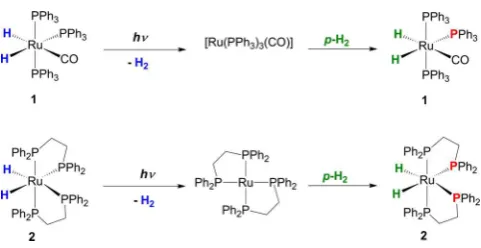
Ru-(PPh3)3(CO)(H)2 1 or cis-Ru(dppe)2(H)2 2 in C6D6 solution.
Reaction withpara-H2then regenerates1and2in a well-defined
nuclear spin state. The rf probe pulse produces a high-resolution, single-scan1H NMR spectrum that can be recorded after a pump−
probe delay of just 10μs. The evolution of the spectra can be followed as the pump−probe delay is increased by micro- or millisecond increments. Due to the sensitivity of thispara-H2experiment, the resulting NMR spectra can have hydride
signal-to-noise ratios exceeding 750:1. The spectra of1oscillate in amplitude with frequency 1101±3 Hz, the chemical shift difference
between the chemically inequivalent hydrides. The corresponding hydride signals of2oscillate with frequency 83±5 Hz, which
matches the difference between couplings of the hydrides to the equatorial31P nuclei. We use the product operator formalism to
show that this oscillatory behavior arises from a magnetic coherence in the plane orthogonal to the magnetic field that is
generated by use of the laser pulse without rf initialization. In addition, we demonstrate how chemical shift imaging can differentiate the region of laser irradiation thereby distinguishing between thermal and photochemical reactivity within the NMR
tube.
1. INTRODUCTION
Dynamic nuclear magnetic resonance (NMR) spectroscopy has numerous applications for studying chemical exchange phenomena in the steady state.1 The exchange information is present in the free induction decay (FID), which is recorded for several hundred milliseconds. The exchange time scale accessible to line shape analysis is typically determined by the frequency difference between exchanging nuclei. Alternatively,
exchange spectroscopy (EXSY) experiments are used for probing slower dynamic exchange, where the accessible time scales are determined by relaxation.2In practice, the need for good signal-to-noise ratios for accurate measurements plays a dominant role in determining the processes that can be followed. NMR spectroscopy can also be used to follow much slower reactions as they evolve, through a series of measure-ments at different times. Recently,flow methods, analogous to
stopped-flow UV, have been introduced, which access faster
time scales.3,4
In contrast, numerous pump−probe methods have been employed to study kinetics on much shorter time scales with the fast detection techniques of UV/vis absorption and emission,5,6 IR,7 and Raman spectroscopies.8−10 In principle, NMR spectroscopy could be used in time-resolved pump− probe measurements if its sensitivity can be enhanced; laser
pump−probe NMR spectroscopy might be expected to become a powerful tool given the complementary structural information on an NMR spectrum. Inspired by research on in situ laser photolysis and our experiments withpara-hydrogen (para-H2)
hyperpolarization of NMR,11−13 we have developed a time-resolved spectroscopy method using laser initiation and NMR detection and illustrate it for pump−probe delays as short as 10
μs.
In a standard NMR experiment, it is the Zeeman effect and
the associated Boltzmann statistics that generate a bulk magnetic order. The magnitude of this bulk magnetization depends on a very small population difference and so gives rise
to a weak NMR signal. This signal is detected following a radio frequency (rf) excitation pulse, which interacts with the bulk magnetization to produce a coherence in the plane orthogonal to the main magneticfield, which is then detected in the form
of the FID. In the 14.1 T (600 MHz) magneticfield used here,
the Zeeman effect produces a difference in nuclear-spin-state
populations that is 1 for every 213001H nuclei present. Several
hyperpolarization methods have been designed to improve the sensitivity of NMR by perturbing this population difference.
Received: May 12, 2014 Published: June 19, 2014
pubs.acs.org/JACS
Some notable examples include optical pumping of noble gases,14−16dynamic nuclear polarization,17,18and photochemi-cally induced dynamic nuclear polarization (photo-CIDNP).19−21In the photo-CIDNP method, a spin-correlated radical pair is used to generate NMR signal enhancements on the order of 102. The photo-CIDNP approach has been used to
observe short-lived radicals and to monitor reactivity on millisecond to second time scales.22−25 In 1976, Ernst demonstrated that magnetic oscillations due to a chemically induced magnetic coherence can be observed if CIDNP is initiated coherently on a very short time scale.26 A related chemically initiated magnetic coherence is exploited here in our time-resolved NMR spectroscopy method to give rise to NMR signal enhancements of several orders of magnitude that build up on microsecond time scales. In our method, we use the long-lived and readily preparedpara-H2molecule, rather than a
radical, as the source of hyperpolarization, creating the potential for high-sensitivity measurements.27,28
para-Hydrogen (para-H2) is a reactive molecule in which the
nuclear spins are aligned antiparallel as the linear combination
αβ−βα and hence they exist in a pure singlet state. Upon reaction withpara-H2, products with nonequilibrium states give
rise to highly enhanced NMR signals that have been used to probe chemical reactivity in many different ways. Bowers and
Weitekamp were thefirst to recognize the potential for NMR
hyperpolarization usingpara-H2. In 1986, they predicted that if
para-H2 were used in a hydrogenation reaction, reaction
products with a spin polarization on the order of unity could be created.29 They later confirmed, experimentally, that under
conditions where the symmetry of the molecularpara-H2was
broken through its transformation into chemically distinct proton environments in a product, signal enhancements in1H
NMR spectra did indeed result.30 Subsequently they refined
their approach to differentiate chemical transformations that
proceed in a strong magneticfield (parahydrogen and synthesis
allow dramatically enhanced nuclear alignment, PASADENA)30 from those proceeding in a low magneticfield prior to NMR
detection in a strong magnetic field (adiabatic longitudinal
transport after dissociation engenders net alignment, ALTA-DENA).31 The term PHIP (para-hydrogen induced polar-ization) has also been used in the literature to describe these effects more generally.32 Previous applications of PHIP have
included detection of reaction products containing para-H2
-derived protons in catalytic studies and in vivo.27,33−39 Refinements of these methods called one-proton PHIP and
signal amplification by reversible exchange (SABRE) have also
been described.33,35,40
para-Hydrogen hyperpolarization is most commonly de-scribed in the literature through the use of energy level versus population diagrams41 with others favoring product operator notation.42,43It follows from the former description that when two new inequivalent proton environments (I and S) are created frompara-H2in a reaction product they yield enhanced
antiphase NMR signals because the resulting energy level overpopulations reflect para-H2’s original αβ spin orientation
(Figure 1a). The product operator representation of the initial state in such a product is the singlet: −1/2(2IxSx + 2IySy +
2IzSz), which is made up of a zero quantum coherence (ZQx=
1/
2(2IxSx + 2IySy)) and the longitudinal two-spin-order term,
1/
2(2IzSz).43,44 It is interesting to note that organic systems
have been prepared in related states by Levitt, Bodenhausen, and Warren without laser synchronization and have potential applications because they can be long-lived.45−49Indeed, such
long-lived states can also be generated by PHIP in symmetric organic molecules as shown recently.50,51
In a conventional high-fieldpara-H2-enhanced experiment,30
the addition of para-H2 occurs asynchronously, and the
reaction time is long on the NMR time scale. Therefore, the amplitude of the ZQx coherence (and any associated terms) averages to zero (in the high field limit) and so the only
observed transitions arise as a result of the longitudinal two-spin order term (Figure 1a). We seek here to probe the evolution of thepara-H2-derived magnetization in a new and
efficient way, such that the enhanced signals can be monitored
on microsecond time scales. To achieve this goal, wefirst need
to prepare a well-defined starting state. We do this by using a
laser pump pulse to initiate a reaction with para-H2
photochemically (Figure 2a). Specifically, we use the
light-induced electronic excitation of a transition metal complex to achieve prompt ligand dissociation. In fact, loss of H2occurs
during the single 10 ns laser pulse, andpara-H2therefore reacts
with the unsaturated reaction intermediate in a time-precise and highly reproducible manner (Figure 3). We also need to consider carefully the behavior of the ZQx coherence, which is
now created synchronously and subsequently evolves into ZQy (Figure 1b) during the pump−probe delay according to the chemical shift andJ-coupling differences between theIand S
[image:3.625.368.521.66.184.2]proton environments (as demonstrated in section 2.2). This method is so reproducible that a series of measurements associated with a 2D-experiment can be collected. We follow the evolution of these magnetic states, the zero-quantum coherences, through the application of a probe NMR pulse (Figure 2b). Thereby, we collect diagnostic information about the product and, indirectly, learn about the reactivity of the Figure 1. (a) Population-of-states model for a para-H2-derived
reaction product containing nuclei I and S, under PASADENA conditions with the resultant antiphase NMR peaks illustrated. (b) Representation of the non-NMR-detectablezero-quantum coherences with associated product operators for two spinsIandS.42
Figure 2.(a) Schematic of the laser irradiation system; the unfocused laser beam is reflected offthe lower mirror into the probehead where a second mirror directs the beam onto the sample through a hole in the housing. (b) NMR pump−probe sequence used in this PHIP study.
Journal of the American Chemical Society Article
[image:3.625.346.542.424.522.2]intermediate from which the product is formed. This differs
from previous work where continuous irradiation in an NMR probe at low temperature has been used to build up the concentration of highly reactive species in order to enable their characterization; photoproducts such as alkane complexes reflect notable examples of this method.12,52,53The continuous
irradiation approach has also been used with para-H2 to
observe new species.54−56
In the studies reported here, only a short section of the sample tube within the NMR detection coil is irradiated (Figure 2a),11and a further, longer section of the active volume of the coil is therefore unaffected by the laser beam. In a further
technical development, we use this selectivity to differentiate
the region of the NMR tube where the photochemical reaction occurs by making use of the NMR probe’s gradient coil to perform chemical-shift imaging. In this case, we show that the enhanced signal is derived exclusively from the short irradiated region of the tube and hence demonstrate that thermal and photochemical activity can be distinguished.
[image:4.625.331.552.153.232.2]Two types of ruthenium dihydride complex are used in this study: Ru(PPh3)3(CO)(H)2 (1) and cis-Ru(dppe)2(H)2 (2)
(Figure 3). They both undergo photochemical loss of H2on a
picosecond time scale to generate Ru(CO)(PPh3)3 and
Ru(dppe)2 (dppe = Ph2PCH2CH2PPh2), respectively, before
being reformed by reaction with hydrogen.57−60The kinetics of reaction of these intermediates with H2have been determined
previously by time-resolved absorption spectroscopy; the time constants for recombination under 3 atm H2(as used here) are
1.4 and 4.8 μs, respectively. Consequently, >99.99% of the photoproducts have reacted withpara-H2just 0.1 ms after the
initial laser pulse, which makes them ideal candidates for this study.57,58
2. RESULTS
2.1. Laser Pump−NMR Probe Experiments. In our NMR pump−probe experiments, a single 10 ns laser pulse at 355 nm is followed by a precisely defined pump−probe delay,
τ, and asinglerf pulse (Figure 2b). The resultant free induction decay (FID) is collected over a period of 350 ms, in exactly the same way as for a traditional NMR experiment. In this study, the reaction products were stable on this time scale. The result is a high-resolution1H NMR spectrum that also encodes the
evolution of any para-H2-derived magnetic states during the
pump−probe delay. In these studies, the sample consists of an
optically dilute C6D6 solution of either 1 or 2. In 1, the two
protons originating from para-H2 are placed in chemically
distinct hydride environments, while in 2 they are created chemically equivalent but magnetically inequivalent by virtue of phosphorus couplings. This is exemplified by the corresponding
1H{31P} pump−probe NMR spectra of 1 and 2 that are
generated under para-H2 shown in Figure 4. The 1H NMR
spectrum of1 in Figure 4a was acquired with a 90° rf pulse
(13.5μs),τ= 0.05 ms, and broadband31P decoupling. It shows
two antiphase hydride signals at δ−6.47 and δ−8.30 where
JHHis resolved. The1H{31P} NMR spectrum of2in Figure 4b
was acquired with a 90° rf pulse (13.5 μs), τ = 15 ms, and selective31P decoupling of the axial phosphorus environment.
It shows two antiphase hydride signals at δ −8.33 that are separated by a splitting equal to the difference in scalar
coupling,|J(PH)trans−J(PH)cis|= 83 Hz. Both of these spectra
demonstrate enhanced signal intensity relative to the corresponding thermally polarized 1H NMR spectra. The
strength of this signal relative to the normal thermally polarized hydride trace is quantified later in the manuscript.
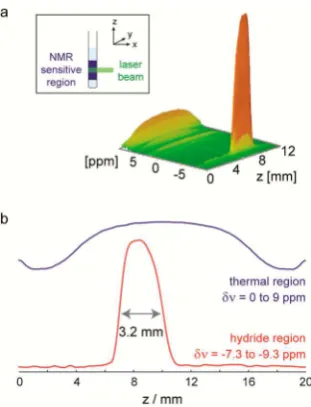
It is possible to use chemical-shift imaging to correlate the vertical position within the sample tube to the chemical-shift encoded molecular response. This method uses an incremented magnetic field gradient, applied along the z axis, to encode
spatial position into the NMR signal. When undertaken in conjunction with photolysis, we can map the PHIP-derived signal enhancement onto this displacement axis. The spatially resolved NMR spectrum collected in this way is shown in Figure 5. It reveals that the hyperpolarized NMR signals for2
are localized within a 3.2 mm region of the NMR tube. This measurement clearly highlights the region where UV-excitation takes place and therefore allows for the spatial differentiation of
thermal and photochemical reactivity. In this case,2does not undergo thermal exchange withpara-H2at 298 K, so there is no
observed hyperpolarization of the hydride resonances outside of the laser-irradiated region of the NMR tube. Consequently, we can clearly state that the hydride signals we detect using the laser pump−NMR probe approach are all the result of the photochemical step.
The evolution of the photochemically generated NMR signals for1and2was investigated as a function of the pump− probe delay. A time sequence was recorded by measuring a series of 1H{31P} pump−probe NMR spectra for different
values ofτ, each employing one laser pulse and one rf pulse as shown in Figure 2b. This series of spectra encodes the evolution of the magnetic states that takes place during the pump−probe delay into the hydride signal intensity and can be readily interpreted by either looking at each spectrum in turn or following the change in integrated signal intensity of the hydride resonances. Using the latter approach, wefind that the
Figure 3. Photochemical reactivity of compounds 1 and 2 toward para-H2harnessed in this work. Blue denotes1H nuclei not derived
from para-H2, while green indicates hyperpolarized 1H nuclei
originating frompara-H2oxidative addition. The phosphorus nuclei
[image:4.625.60.301.317.441.2]in red are the dominant source of the magnetic inequivalence of the hyperpolarized hydride nuclei in2.
Figure 4. Single-laser shot, single 90° rf pulse, para-H2 enhanced
1H{31P} NMR spectra of the hydride region of (a)1withτ= 0.05 ms
(broadband31P decoupling) and (b)
2withτ= 15 ms (selective31P
integrals of the hydride signals of 1 exhibit an increase in intensity out to 200μs, with an apparent rise time of ca. 70μs (Figure 6a). Parallel kinetic measurements by UV spectroscopy exhibit a much more rapid 1.4 μs rise time,58 thereby demonstrating that the reformation of 1 is much faster than this buildup of enhanced NMR signal. Further increase ofτas shown in Figure 6b reveals that this rise actually forms the initial part of a sinusoidal oscillation.
This change in signal amplitude can be readily understood if we consider the effect of the 90°rf pulse, which rotates 2IzSz
and ZQxinto unobservable zero-quantum and double-quantum terms while rotating ZQy (Figure 1b) into observable
single-quantum terms (see section 2.2). The observed oscillation in hydride signal amplitude as a function ofτis therefore due to the periodic evolution that connects the initial ZQxstate to the ZQystate, which proceeds under the influence of the difference
in chemical shifts between the two hydrides or the difference in
J coupling between the hydrides and a third nucleus (see section 2.2). We emphasize that even though the initial x−y
coherence is created chemically, rather than with a radio frequency pulse, it still leads to a diagnostic signal in this experiment. A fit of this NMR signal to an exponentially
decaying sine wave yields a frequency of 1101±3 Hz (Figure
6b), in good agreement with the chemical shift difference, 1098
Hz, observed in the thermally polarized NMR spectrum of1. In a classic 2D NMR experiment, a magnetic coherence is
first created; next it is allowed to evolve during a variable delay
before it is ultimately recorded as a free induction decay (FID). Fourier transformation then produces a 2D spectrum where the second dimension displays the information encoded during the evolution period. Here we used the same procedure to obtain 2D pump−probe NMR spectra, where the photochemically created magnetic coherence is also prepared with phase coherence. This is allowed to evolve during a variable pump− probe delay,τ, and is then recorded as an FID following a 90°rf
pulse. This 2D approach is made possible by the reproducibility of the laser pump step and the synchronization with the NMR probe step. Figure 6c presents a 2D 1H pump−probe NMR
spectrum of1acquired by varyingτfrom 0 to 14 ms in steps of 0.35 ms. In this spectrum, which was acquired without 31P
decoupling, we observe peaks at±Δδ= 1103 ±3 Hz due to
the evolution between ZQxand ZQyunder the influence of the
difference in hydride chemical shift. An additional splitting
occurs due to evolution under the influence of the difference in
J coupling between the hydride ligands and the equatorial phosphorus nucleus,|J(PH)trans−J(PH)cis|= 88±5 Hz (89 Hz
in the 1D spectrum).
The related complex cis-Ru(dppe)2(H)2 (2) (Figure 3) is
more complicated than 1 having chemically equivalent but magnetically inequivalent hydride ligands (AA′) that form an AA′XX′Y2 spin system; X and Y are equatorial and axial 31P
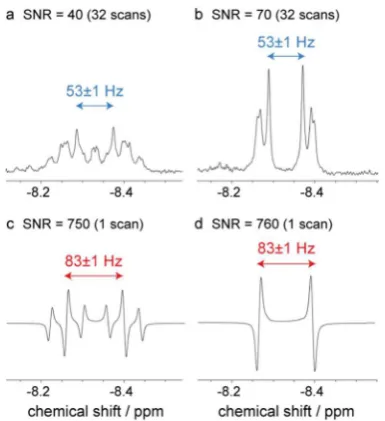
nuclei, respectively. Normally, the hydride ligands of2 yield a complex 36-component multiplet (Figure 7a) at δ−8.33 that simplifies to a pseudo-doublet separated by |J(PH)trans + J(PH)cis|= 53 Hz upon decouplingY(Figure 7b).61When this
complex is monitored by pump−probe NMR spectroscopy withpara-H2, both its hydride and equatorial31P signals (X) are
[image:5.625.102.258.67.271.2]observed to be hyperpolarized. Strikingly, the hydride signal now appears as a deceptively simple antiphase doublet of triplets due to the enhanced intensity of a subset of the 36 expected transitions (Figure 7c). The enhanced transitions reflect those nuclear spin states that are overpopulated by the
[image:5.625.363.523.67.389.2]Figure 5.(a) Three-dimensional plot of signal intensity (vertical axis) vs chemical shift (ppm) and vertical displacement (mm) relative to the base of the NMR coil for2. (b) Projections of thermal signal intensity (0−9 ppm, blue) and the enhanced hydride signal intensity (−7.3 to −9.3 ppm, red) onto the vertical axis of the NMR tube.
Figure 6. (a) Hydride signal integral versus τ for 1H{31P} NMR
spectra of1(1×10⁻³M, 3 atmpara-H
2). Blue, experimental points;
red line, exponentially decaying sine wave of 1101±3 Hz generated using the fit parameters from panel b (inset trace illustrates the spectrum at τ = 0.05 ms). (b) Analogous 1H{31P} hydride signal
integrals out to 5 ms. Red line,fit to exponentially decaying sine wave of 1101±3 Hz. (c) 2D1H pump−probe NMR spectrum of1where the vertical dimension corresponds to evolution duringτ. Inset shows 2×zoomed view.
Journal of the American Chemical Society Article
evolution of the initial singlet state of thepara-H2-derived1H
nuclei. The resulting dramatically simplified doublet feature is
separated by|J(PH)trans−J(PH)cis|= 83 Hz, and a splitting of
23 Hz due to axial 31P interactions is visible. These
measurements therefore reveal thatJ(PH)transis±68 Hz with
J(PH)cisrestricted to∓15 Hz; decoupling of the axial31P-nuclei
(Y) yieldsJ(HH) = 6 Hz as the antiphase splitting (Figure 7d). The NMR spectra in Figure 7 demonstrate that the hyperpolarized signals derived from a single FID can be detected with 1H NMR signal-to-noise ratios of ca. 750:1,
which compare with those of 45:1 for 32 scans under thermal conditions. This equates to the ready detection of ca. 10 nmol of material in a single transient.
Density matrix simulations of the hyperpolarized 1H NMR
spectra of1and2are presented in the Supporting Information (Figure S5) to support these deductions. The couplings and chemical shifts obtained from these simulations were in agreement with those obtained using standard NMR character-ization methods (Figures S1 and S2, Supporting Information). The hydride signals of 2 also oscillate in amplitude as the pump−probe delay τ is varied (Figure S4, Supporting
Information). The resulting 2D 1H pump−probe NMR
spectrum of 2 (Figure 8a) reveals that this oscillation now has frequency±83±5 Hz and matches the difference between
thecisand trans Jcouplings of the hydrides to the equatorial
31P nuclei (|
J(PH)trans − J(PH)cis|). Hence the hydride− phosphorus couplings of 2 play an analogous role to the hydride chemical shift difference in 1 in causing evolution of
the ZQx term. In addition to this 1H hyperpolarization, the
equatorial31P nuclei (δ 65.7) of2 become hyperpolarized, as
shown by the 2D 31P pump−probe spectrum in Figure 8b,
which was acquired with 90° rf excitation and subsequent
detection on the phosphorus channel. The axial phosphorus nuclei (δ 79.6) are, however, not hyperpolarized under these conditions because the difference in their couplings to the
hydrides (J(PaxHA)− J(PaxHB)) is effectively zero.
2.2. Analysis of Evolution of Magnetization. In these NMR pump−probe experiments, the photodissociation of the two hydride ligands occurs within the laser pulse.57Hydrogen readdition from the para-H2 reservoir (3 atm) then occurs
following the laser pulse, on a time scale of a few microseconds.57,58 Therefore, the para-H
2-derived 1H nuclei
initially retain their relative spin orientations and can be described by the singlet state:−1/2(2IzSz+ 2IxSx+ 2IySy).11It is
noteworthy that, unlike more conventional PASADENApara -H2 experiments where only the longitudinal two-spin order
term, 2IzSz, is preserved, here we benefit from the survival of
the zero-quantum term, ZQx = 1/
2(2IxSx + 2IySy). This is a
consequence both of the coherent way in which we initiate the readdition step and the reaction rate, which is fast relative to the evolution of the ZQx coherence. If the hydrides are chemically inequivalent (δν≠0), this ZQxterm evolves during
the pump−probe delay (τ) into a ZQy coherence: ZQy =
1/
2(2IySx − 2IxSy), under the application of the operator
(2πδνt)1/
2(Iz − Sz), as demonstrated by eq 1.
43 Similarly, a
difference between theJcouplings of the two hydrides (Iand
S) to a third nucleus, T, (JIT − JST ≠ 0) will result in the evolution of ZQx into 2ZQyTz under the influence of the
operator ((π/2)(JIT − JST)τ)2(Iz − Sz)Tz, as shown by eq 2.
These evolutions serve two important functions in the pump− probe experiment. First, the evolution of ZQx into ZQy
produces a detectable magnetic state from the initial NMR-silent singlet state. Second, the evolution frequencies encode important diagnositc information into the NMR response.
πδν πδν
⎯⎯⎯⎯⎯⎯⎯⎯⎯⎯⎯⎯⎯⎯⎯⎯→ +
πδν −
t t
ZQx (2 t) 12(Iz Sz) ZQ cos(2x ) ZQ sin(2y )
(1)
π τ
π τ
⎯⎯⎯⎯⎯⎯⎯⎯⎯⎯⎯⎯⎯⎯⎯⎯⎯⎯⎯⎯⎯⎯⎯⎯⎯→ −
+ −
π τ
− −
J J
T J J
ZQ ZQ cos( ( ) ) 2ZQ sin( ( ) )
x
J J I S T
x IT ST
y z IT ST
(
2(IT ST) )2(z z) z
(2)
At the end of theτevolution period, prior to the application of the rf pulse, the state of the system will contain contributions from the longitudinal two-spin-order term as well as the zero-quantum coherence terms: ZQxand ZQy. Upon application of a
broadband (i.e., nonselective) pulse, which rotates both of the
1H nuclei by an angle, θ, all of these terms will give rise to
[image:6.625.84.277.66.277.2]NMR-observable magnetic states according to eq 3 (single-quantum states only).
Figure 7.Thermal1H NMR spectra of2: (a) fully coupled and (b)
with selective axial31P decoupling of the same sample. Pump−probe 1H NMR spectra (90°rf pulse,τ= 15 ms) of2: (c) fully coupled and
(d) with selective axial 31P decoupling. The signal-to-noise ratios
(SNR) are also shown.
Figure 8.Two-dimensional pump−probe NMR spectra of2where the vertical dimension corresponds to evolution duringτ and (a)1H is
[image:6.625.344.540.70.181.2]θ θ θ ⎯⎯⎯⎯⎯⎯⎯⎯→ + ⎯⎯⎯⎯⎯⎯⎯⎯→− + ⎯⎯⎯⎯⎯⎯⎯⎯→− − θ θ θ + + +
I S I S I S
I S I S
I S I S
1 2(2 )
1
2(2 2 ) 1 2 sin 2 ZQ 1
2(2 2 ) 1 2 sin 2 ZQ 1
2(2 2 ) sin
z z
I S
x z z x
x
I S
x z z x
y
I S
y z z y
( ) ( ) ( ) y y y y y y (3)
First, we note that the ZQx and longitudinal two-spin-order
terms give rise to the same single-quantum states but with opposite signs. This means that observable NMR signal can only be obtained from these terms if their amplitudes differ and
θ≠90°. Second, inspection of eq 3 shows that a 90°pulse will
in fact generate observable signal exclusively from the ZQy coherence, while other pulse rotation angles, such as 45°, can
be used to detect contributions from the other states, particularly the longitudinal two-spin-order term (2IzSz). All
of the spectra reported here were measured with a 90°pulse
and so show exclusively the evolution of ZQy during τ. This
contrasts with a traditional PHIP experiment, where a 45°pulse
is used because only the longitudinal two-spin-order term, 2IzSz,
is present, and it produces the maximum detectable response.30 The oscillation observed in the1H{31P} spectra of1(Figure
6b) is completely described by eq 1. The 2D1H pump−probe
spectrum of 1 in Figure 6c can be understood through the application of both eqs 1 and 2 to the initial ZQxstate. Because the longitudinal two-spin-order term does not evolve during the pump−probe delay and is not observed with a 90°rf pulse, it is
not considered further in this discussion. For the case of chemically inequivalent hydrides, the evolution due to the chemical shift and J coupling terms can be considered sequentially. As the pump−probe delay is changed, eq 1 shows that there will be a sinusoidal oscillation in the amplitude of the probed ZQy state, where the oscillation frequency is equal to the chemical-shift difference (δν= 1098 Hz in1). In a
2D spectrum, this will correspond to peaks at ±δν in the indirect (τ) evolution dimension. According to eq 2, there will be an additional oscillation due to the difference in the trans
and cis J couplings between the hydrides and the in-plane phosphorus nucleus,ΔJ=|J(PH)trans−J(PH)cis|= 89 Hz. This
oscillation will produce a further splitting in the indirect (τ) evolution dimension of the 2D spectrum with peaks at δν
+1/
2ΔJand δν −1/2ΔJ. This is precisely what is observed in
Figure 6c.62 In addition, the form of the hyperpolarized 1H
NMR spectrum in the direct dimension can be interpreted in a straightforward way. Each hydride gives rise to an antiphase doublet of triplets, where the antiphase splitting is equal to the homonuclear hydride−hydride coupling, the doublet splitting is equal to the equatorial 31P−1H coupling, and the triplet
splitting is equal to the axial31P−1H coupling.
In complex 2, the hydrides are chemically equivalent but magnetically inequivalent, so there is no evolution due to the chemical shift terms, as shown by eq 1. Equation 2 describes the evolution of ZQxwhen two magnetically inequivalent nuclei are coupled to a single third nucleus. The presence of two equatorial31P nuclei (TandR) in2can therefore be analyzed
by the application of eq 2 twice in succession (once for the coupling toTand once for the coupling toR, whereRreplaces
Tin eq 2) leading to an effective oscillation frequency ofΔJ
and peaks in the 2D 1H pump−probe spectrum at +ΔJ and
−ΔJ(Figure 8a). Although this approach does not take into account the effect of the strong coupling of the AA′XX′system,
it is sufficient to provide an intuitive understanding of the peaks
in the 2D1H pump−probe spectrum. In contrast, inclusion of
strong coupling is required to explain the observed hyper-polarization of the equatorial 31P nuclei in Figure 8b. The 1H−31P coupled state generated by eq 2, 2ZQ
yTz, does not
yield any observable single-quantum states following the application of an rf pulse on the phosphorus channel. Therefore, magnetic states of this type cannot account for the observed 31P hyperpolarization in the 2D 31P pump−probe
spectrum in Figure 8b. However, in the strong coupling regime the coupled state, 2ZQyTz, will evolve into 2(Iz−Sz)Tzunder the influence of the nonsecular part of the 1H−1HJ-coupling interaction,πJIS(2IxSx + 2IySy), as demonstrated by eq 4.43
π τ
π τ
⎯⎯⎯⎯⎯⎯⎯⎯⎯⎯⎯⎯⎯⎯⎯⎯⎯→
+ −
π + τ
T T J
I S T J
2ZQ 2ZQ cos(2 ) 1
22( ) sin(2 )
y z
J I S I S
y z IS
z z z IS
(2 2 )
IS x x y y
(4)
It is this 2(Iz − Sz)Tz state that gives rise to the 31P NMR
signals observed following the application of an rf pulse to the phosphorus channel in the 2D31P pump−probe spectrum in Figure 8b. While transfer frompara-H2-derived1H nuclei to a
heteronucleus has been achieved previously in combination with rf irradiation63or in the low-field regime,64,65 this is an
example of spontaneous transfer ofpara-H2hyperpolarization
to a heteronucleus in the highfield regime.
3. CONCLUSION
In this paper, we have demonstrated that NMR spectroscopy can be used in a laser pump−NMR probe mode to access microsecond to millisecond time scale events in an approach analogous to other laser based time-resolved spectroscopies. Our measurements were made possible by combining laser-synchronized chemical initiation with para-H2
hyperpolariza-tion. Crucially, in the pumping stage of the experiment, x−y
coherence is created through a chemical reaction that proceeds on a microsecond time scale. Thisx−ycoherence responds to the molecular environment as manifested in both the 1D spectra and the oscillatory evolution of the spectra as a function of the pump−probe delay. This chemically generated coherence contrasts with the normal situation for NMR spectroscopy where x−ycoherences are the direct result of a radio frequency pulse. Furthermore, this method differs
significantly from traditionalpara-H
2methods of PASADENA
and ALTADENA, which lack a synchronous initiation step and hence only yield time-averaged magnetic states prior to rf excitation.44For example, when transition metal complexes are examined, the oscillations of the zero quantum coherence are obscured because of the asynchronous H2cycling (multiple H2
addition and elimination). Similarly, multiple asynchronous catalytic steps normally cause time-averaging in instances where hydrogenation products are formed irreversibly.
In the two cases illustrated here, Ru(PPh3)3(CO)(H)2 (1)
and cis-Ru(dppe)2(H)2 (2), the signals oscillate for different
reasons. In the case of1, it is the creation of two chemically inequivalent hydrides that leads to an oscillation of frequency, 1101±3 Hz corresponding to their chemical shift difference.
For 2, however, it is magnetic inequivalence that results in a smaller oscillation frequency of 83±5 Hz corresponding to a
difference in spin−spin coupling, |J(PH)
trans − J(PH)cis|. This
approach therefore readily differentiates the spin topology of
the product and is applicable to compounds with either chemical inequivalence or magnetic inequivalence via diff
er-Journal of the American Chemical Society Article
ences in J-coupling. We have also demonstrated that we can monitor changes in the spectra observed with successive pump−probe delays differing from one another by 10 μs. The
rise time of the oscillations sets an upper limit for the formation of the product that is measured as 70μs in the case of1. The time scale of our experiments is defined by the frequency
difference between the two hydride resonances in the case of1
and by the difference in spin−spin coupling in the case of2.
The sensitivity of the method is illustrated by single scans with signal-to-noise ratios as high as 750:1 that detect nanomole amounts of product. The potential of this method as a diagnostic probe for photoinduced reactions is further demonstrated by chemical-shift imaging combined with laser irradiation that can differentiate thermal and photochemical
reactivityin situwithin the time frame of the experiment. We are currently working to develop a full theoretical framework and optimize the experimental parameters so as to extend the method to other types of reaction products that have been observed with para-H2 hyperpolarization.28 In the
future, we seek to exploit its remarkable potential to quantify chemical kinetics on a microsecond time scale while simultaneously benefiting from the structural information
provided by NMR detection. In principle, any system that can be initiated synchronously and sensitized with para-H2
could be followed using our method. Another potential application of this technique is as a test-bed for NMR pulse sequences designed to manipulate long-lived singlet states.
4. EXPERIMENTAL SECTION
All NMR spectra were recorded on a Bruker Avance widebore 600 MHz spectrometer fitted with a BBO probe. Laser photolysis was carried out with a pulsed Nd:YAG laser (Continuum Surelite II)fitted with a frequency tripling crystal (output 355 nm). Operating conditions were typically: 10 Hz repetition rate, flash lamp voltage 1.49 kV, and Q-switch delay increased from the standard to 320 ms yielding a laser power of 85 mW. The unfocused laser beam is directed at the base of the spectrometer and reflected up into the probe via a mirror (Figure 2a). Adjustment screws control the vertical and horizontal position of the mirror, which is on a kinematic mount. The system is fully shielded from the operator, and the screws of the kinematic mount can be adjusted from outside the shield. The laser radiation is incident on afixed mirror that is level with the sample and passes through a hole in the probe onto the NMR tube. Standard NMR tubesfitted with Young’s taps were used. The samples contained 1−2 mg of compound and approximately 0.4 mL of solvent. A sample of2in C6D6was used for laser alignment withpara-H2amplification
in real time.
Standard NMR pulse sequences were modified for use withpara-H2 by including a synchronized laser initiation sequence prior to NMR excitation (Figure 2b). A purpose-written program was used to control the laserfiring from the NMR console with the laser set on external triggering. Thefire signals are sent to the laser via a BNC cable. The program sets the laser tofire three warm-up shots before opening the shutter for thefire signal. The NMR pulse is initiated at a set delay time (τ) following thefire signal. The intrinsic time delay between sending thefire signal from the spectrometer and the actualfiring of the laser pulse was measured with a photodiode and an oscilloscope to be 140μs. This signal delay was incorporated into the pulse sequence such that synchronized measurements with a time delay, τ, were achieved by setting the spectrometer delay to τ + 140 μs. The precision of this delay between the laser and rf pulses is controlled by the 200 ns clock of the spectrometer.
Two-dimensional pump−probe NMR experiments were carried out by acquiring a series of 1D spectra in which the delay between the laser pulse and the rf excitation,τ, was incremented in the usual way to assemble a 2D data set. This 2D data set was subsequently Fourier
transformed under magnitude mode to generate 2D spectra such as those presented in Figures 6c and 8.
Chemical-shift imaging (CSI) was used to correlate the vertical position within the sample tube to chemical shift (Figure 5). The CSI method used here employs an incremented magneticfield gradient along thez-axis to encode spatial information into the phase of the detected signals. Subsequent Fourier transformation of the 2D data set gives a chemical shift spectrum in the directly observed dimension (F2) and position in the indirect evolution dimension (F1). The pulse sequence used for chemical-shift imaging is shown in the Supporting Information (Figure S3). The maximum gradient strength used is dependent on the number of increments and the length and shape of the gradient pulse. For the1H experiments, we used 1 ms half-sine
gradient pulses, with maximum strength of 5.99 G/cm, and 64 data points in the second dimension. This corresponds to afield of view of 2 cm (Figure S6, Supporting Information). A two-step phase cycle of the 180°pulse was used to remove artifacts in the image.
■
ASSOCIATED CONTENT*
S Supporting InformationNMR characterization data, additional spectra with simulations, and further technical descriptions. This material is available free of charge via the Internet at http://pubs.acs.org.
■
AUTHOR INFORMATIONCorresponding Authors
[email protected] [email protected]
Notes
The authors declare no competingfinancial interest.
■
ACKNOWLEDGMENTSWe are grateful for support to EPSRC (grant EP/K022792/1), the Ministerio de Ciencia e Innovación and the Fundación Española para la Ciencia y la Tecnologia (OT), and the Spanish́
MEC Consolider Ingenio 2010-ORFEO−CSD2007-00006
research programme (BE). Catherine Sexton, Sarah Henshaw, and Pedro Aguiar provided experimental help.
■
REFERENCES(1) Mann, B. E. InEncyclopedia of Nuclear Magnetic Resonance; Grant, D. M., Harris, R. K., Eds.; Wiley: Chichester, U.K., 1996; p 3400.
(2) Perrin, C. L.; Dwyer, T. J.Chem. Rev.1990,90, 935.
(3) Bart, J.; Kolkman, A. J.; Oosthoek-de Vries, A. J.; Koch, K.; Nieuwland, P. J.; Janssen, H.; van Bentum, P. J. M.; Ampt, K. A. M.; Rutjes, F. P. J. T.; Wijmenga, S. S.; Gardeniers, H.; Kentgens, A. P. M. J. Am. Chem. Soc.2009,131, 5014.
(4) Wagner, G. E.; Sakhaii, P.; Bermel, W.; Zangger, K. Chem. Commun.2013,49, 3155.
(5) Zewail, A. H.Angew. Chem., Int. Ed.2000,39, 2587. (6) Zhang, R.; Newcomb, M.Acc. Chem. Res.2008,41, 468. (7) Butler, J. M.; George, M. W.; Schoonover, J. R.; Dattelbaum, D. M.; Meyer, T. J.Coord. Chem. Rev.2007,251, 492.
(8) Kukura, P.; McCamant, D. W.; Mathies, R. A.Annu. Rev. Phys. Chem.2007,58, 461.
(9) Nibbering, E. T. J.; Fidder, H.; Pines, E.Annu. Rev. Phys. Chem.
2005,56, 337.
(10) Browne, W. R.; McGarvey, J. J.Coord. Chem. Rev.2007,251, 454.
(11) Anwar, M. S.; Blazina, D.; Carteret, H. A.; Duckett, S. B.; Halstead, T. K.; Jones, J. A.; Kozak, C. M.; Taylor, R. J. K.Phys. Rev. Lett.2004,93, No. 040501.
(13) Ampt, K. A. M.; Duckett, S. B.; Perutz, R. N.Dalton Trans.
2007, 2993.
(14) Schroder, L.; Lowery, T. J.; Hilty, C.; Wemmer, D. E.; Pines, A. Science2006,314, 446.
(15) Happer, W.Rev. Mod. Phys.1972,44, 169.
(16) Garimella, P. D.; Meldrum, T.; Witus, L. S.; Smith, M.; Bajaj, V. S.; Wemmer, D. E.; Francis, M. B.; Pines, A.J. Am. Chem. Soc.2014, 136, 164.
(17) Ardenkjaer-Larsen, J. H.; Fridlund, B.; Gram, A.; Hansson, G.; Hansson, L.; Lerche, M. H.; Servin, R.; Thaning, M.; Golman, K.Proc. Natl. Acad. Sci. U. S. A.2003,100, 10158.
(18) Müller-Warmuth, W.; Meise-Gresch, K.Adv. Magn. Reson.1983, 11, 1.
(19) Schaublin, S.; Wokaun, A.; Ernst, R. R.̈ J. Magn. Reson.1977,27, 273.
(20) Trease, D.; Bajaj, V. S.; Paulsen, J.; Pines, A.Chem. Phys. Lett.
2011,503, 187.
(21) Goez, M.; Kuprov, I.; Mok, K. H.; Hore, P. J.Mol. Phys.2006, 104, 1675.
(22) Harper, S. M.; Neil, L. C.; Day, I. J.; Hore, P. J.; Gardner, K. H. J. Am. Chem. Soc.2004,126, 3390.
(23) Kiryutin, A. S.; Morozova, O. B.; Kuhn, L. T.; Yurkovskaya, A. V.; Hore, P. J.J. Phys. Chem. B2007,111, 11221.
(24) Mok, K. H.; Nagashima, T.; Day, I. J.; Jones, J. A.; Jones, C. J. V.; Dobson, C. M.; Hore, P. J.J. Am. Chem. Soc.2003,125, 12484.
(25) Perrier, S.; Mugeniwabagara, E.; Kirsch-De Mesmaeker, A.; Hore, P. J.; Luhmer, M.J. Am. Chem. Soc.2009,131, 12458.
(26) Schaublin, S.; Wokaun, A.; Ernst, R. R.Chem. Phys.1976,14, 285.
(27) Duckett, S. B.; Mewis, R. E.Acc. Chem. Res.2012,45, 1247. (28) Green, R. A.; Adams, R. W.; Duckett, S. B.; Mewis, R. E.; Williamson, D. C.; Green, G. G. R.Prog. Nucl. Magn. Reson. Spectrosc.
2012,67, 1.
(29) Bowers, C. R.; Weitekamp, D. P.Phys. Rev. Lett.1986,57, 2645. (30) Bowers, C. R.; Weitekamp, D. P.J. Am. Chem. Soc.1987,109, 5541.
(31) Pravica, M. G.; Weitekamp, D. P.Chem. Phys. Lett.1988,145, 255.
(32) Eisenschmid, T. C.; Kirss, R. U.; Deutsch, P. P.; Hommeltoft, S. I.; Eisenberg, R.; Bargon, J.; Lawler, R. G.; Balch, A. L.J. Am. Chem. Soc.1987,109, 8089.
(33) Lopez-Serrano, J.; Duckett, S. B.; Aiken, S.; Lenero, K. Q. A.; Drent, E.; Dunne, J. P.; Konya, D.; Whitwood, A. C.J. Am. Chem. Soc.
2007,129, 6513.
(34) Godard, C.; Duckett, S. B.; Henry, C.; Polas, S.; Toose, R.; Whitwood, A. C.Chem. Commun.2004, 1826.
(35) Permin, A. B.; Eisenberg, R.J. Am. Chem. Soc.2002,124, 12406. (36) Giernoth, R.; Huebler, P.; Bargon, J. Angew. Chem., Int. Ed.
1998,37, 2473.
(37) Viale, A.; Santelia, D.; Napolitano, R.; Gobetto, R.; Dastru, W.; Aime, S.Eur. J. Inorg. Chem.2008, 4348.
(38) Bhattacharya, P.; Harris, K.; Lin, A. P.; Mansson, M.; Norton, V. A.; Perman, W. H.; Weitekamp, D. P.; Ross, B. D.Magn. Reson. Mater. Phys. Biol. Med.2005,18, 245.
(39) Bouchard, L.-S.; Burt, S. R.; Anwar, M. S.; Kovtunov, K. V.; Koptyug, I. V.; Pines, A.Science2008,319, 442.
(40) Adams, R. W.; Aguilar, J. A.; Atkinson, K. D.; Cowley, M. J.; Elliott, P. I. P.; Duckett, S. B.; Green, G. G. R.; Khazal, I. G.; Lopez-Serrano, J.; Williamson, D. C.Science2009,323, 1708.
(41) Duckett, S. B.; Sleigh, C. J.Prog. Nucl. Magn. Reson. Spectrosc.
1999,34, 71.
(42) Sorensen, O. W.; Eich, G. W.; Levitt, M. H.; Bodenhausen, G.; Ernst, R. R.Prog. Nucl. Magn. Reson. Spectrosc.1983,16, 163.
(43) Natterer, J.; Bargon, J.Prog. Nucl. Magn. Reson. Spectrosc.1997, 31, 293.
(44) Natterer, J.; Schedletzky, O.; Barkemeyer, J.; Bargon, J.; Glaser, S. J.J. Magn. Reson.1998,133, 92.
(45) Levitt, M. H.Annu. Rev. Phys. Chem.2012,63, 89.
(46) Pileio, G.; Bowen, S.; Laustsen, C.; Tayler, M. C. D.; Hill-Cousins, J. T.; Brown, L. J.; Brown, R. C. D.; Ardenkjaer-Larsen, J. H.; Levitt, M. H.J. Am. Chem. Soc.2013,135, 5084.
(47) Feng, Y.; Davis, R. M.; Warren, W. S.Nat. Phys.2012,8, 831. (48) Ahuja, P.; Sarkar, R.; Jannin, S.; Vasos, P. R.; Bodenhausen, G. Chem. Commun.2010,46, 8192.
(49) Carravetta, M.; Levitt, M. H.J. Am. Chem. Soc.2004,126, 6228. (50) Franzoni, M. B.; Buljubasich, L.; Spiess, H. W.; Muennemann, K.J. Am. Chem. Soc.2012,134, 10393.
(51) Zhang, Y.; Soon, P. C.; Jerschow, A.; Canary, J. W. Angew. Chem., Int. Ed.2014,53, 3396.
(52) Calladine, J. A.; Duckett, S. B.; George, M. W.; Matthews, S. L.; Perutz, R. N.; Torres, O.; Khuong, Q. V.J. Am. Chem. Soc.2011,133, 2303.
(53) Ball, G. E.; Brookes, C. M.; Cowan, A. J.; Darwish, T. A.; George, M. W.; Kawanami, H. K.; Portius, P.; Rourke, J. P.Proc. Natl. Acad. Sci. U. S. A.2007,104, 6927.
(54) Glorius, F.; Altenhoff, G.; Goddard, R.; Lehmann, C. Chem. Commun.2002, 2704.
(55) Clark, J. L.; Duckett, S. B.Dalton Trans.2014,43, 1162. (56) Eguillor, B.; Caldwell, P. J.; Cockett, M. C. R.; Duckett, S. B.; John, R. O.; Lynam, J. M.; Sleigh, C. J.; Wilson, I.J. Am. Chem. Soc.
2012,134, 18257.
(57) Colombo, M.; George, M. W.; Moore, J. N.; Pattison, D. I.; Perutz, R. N.; Virrels, I. G.; Ye, T. Q.J. Chem. Soc., Dalton Trans.1997, 2857.
(58) Cronin, L.; Nicasio, M. C.; Perutz, R. N.; Peters, R. G.; Roddick, D. M.; Whittlesey, M. K.J. Am. Chem. Soc.1995,117, 10047.
(59) Campian, M. V.; Perutz, R. N.; Procacci, B.; Thatcher, R. J.; Torres, O.; Whitwood, A. C.J. Am. Chem. Soc.2012,134, 3480.
(60) Schott, D.; Callaghan, P.; Dunne, J.; Duckett, S. B.; Godard, C.; Goicoechea, J. M.; Harvey, J. N.; Lowe, J. P.; Mawby, R. J.; Muller, G.; Perutz, R. N.; Poli, R.; Whittlesey, M. K.Dalton Trans.2004, 3218.
(61) Gunther, H.Angew. Chem., Int. Ed.1972,11, 861.
(62) The difference in couplings between the hydrides and the axial phosphorus nuclei is very small (<5 Hz). While we would expect an additional splitting in the 2D spectrum due to this difference, it is not resolved in Figure 6c.
(63) Roth, M.; Koch, A.; Kindervater, P.; Bargon, J.; Spiess, H. W.; Munnemann, K.J. Magn. Reson.2010,204, 50.
(64) Goldman, M.; Johannesson, H.C. R. Phys.2005,6, 575. (65) Hövener, J.-B.; Chekmenev, E. Y.; Harris, K. C.; Perman, W. H.; Robertson, L. W.; Ross, B. D.; Bhattacharya, P.Magn. Reson. Mater. Phys. Biol. Med.2009,22, 111.
Journal of the American Chemical Society Article