OFFICE STATISTIQUE DES COMMUNAUTES EUROPEENNES - STATISTICAL OFFICE OF THE EUROPEAN COMMUNITIES - STATIòTISCHES AW D O M U N I T A EUROPEE - BUREAU VOOR DE Sjjeoy 0378-4207 PESE GEMEENSCHAPPEN - DET STATISTISKE DEPARTEMENT FOR DE EUROPÆISKE FÆ LLESSKABER -OFFICE STAT 1 NAUTES EUROPEENNES - STATISTICAL OFFICE OF THE EUROPEAN COMMUNITIES - STATISTISCHES AMT DER EUROPAISCHEN GEMEINScl AFTEN - ¡STITUTO STATISTICO DELLE COMUNITÀ EUROPEE - BUREAU VOOR DE STATISTIEK DER EUROPESE GEMEENSCHAPPEN - DET S I ATISTISKE DEPARTEMENT FOR DE EUROPÆ ISKE FÆLLESSKABER - OFFICE STATISTIQUE DES COMMUNAUTES EUROPEENNES - STATISTT CAL OFFICE OF THE EUROPEAN COMMUNITIES - STATISTISCHES AMT DER EUROPAISCHEN GEMEINSCHAFTEN - ISTITUTO STATISTICO DEI LE COMUNITÀ EUROPEE - BUREAU VOOR DE STATISTIEK DER EUROPESE GEMEENSCHAPPEN - DET STATISTISKE DEPARTEMENT FOR Da UROPÆ ISKE FÆ LLESSKABER - OFFICE STATISTIQUE DES COMMUNAUTES EUROPEENNES - STATISTICAL OFFICE OF THE EUROPEAN C<J MMUNITIES - STATISTISCHES AMT DER EUROPAISCHEN GEMEINSCHAFTEN - ISTITUTO STATISTICO DELLE COMUNITÀ EUROPEE - BUREA| VOOR DE STATISTIEK DER EUROPESE GEMEENSCHAPPEN - DET STATISTISKE DEPARTE MENT FOR DE EUROPÆ ISKE FÆ LLESSKABER OFFICE STATISTIQUE DES C O M M |
DER EUROPAISCHEN GEMEINSC ESE GEMEENSCHAPPEN - DET s | NAUTES EUROPEENNES - STATU (AFTEN - ISTITUTO STATISTICO : TATISTISKE DEPARTEMENT FOR ICAL OFFICE OF THE EUROPEAN LE COMUNITÀ EUROPEE - BURL·/ EUROPÆ ISKE FÆ LLESSKABER MUNITIES - STATISTISCHES AMT OOR DE STATISTIEK DER EUROPA FICE STATISTIQUE DES COMMUN/? R EUROPAISCHEN GEMEINSCHAF GEMEENSCHAPPEN - DET STATI:
S EUROPEENNES - STATISTICAL OFFICE OF THE EUROPEAN COMMUNITIES
eurostat
COMMUNITIES - STATISTISCHES AMT DER EUROPAISCHEN GEMEINSC EAU VOOR DE STATISTIEK DER EUROPESE GEMEENSCHAPPEN - DET I - OFFICE STATISTIQUE DES COMMUNAUTES EUROPEENNES ■ STATISI MT DER EUROPAISCHEN GEMEINSCHAFTEN - ISTITUTO STATISTICO D E I DPESE GEMEENSCHAPPEN - DET STATISTISKE DEPARTEMENT FOR D E I NAUTES EUROPEENNES -STATISTICAL OFFICE OF THE EUROPEAN COlJ FTEN - ISTITUTO STATISTICO DELLE COMUNITÀ EUROPEE - BUREAU [ ATISTISKE DEPARTEMENT FOR DE EUROPÆ ISKE FÆ LLESSKABER O l AL OFFICE OF THE EUROPEAN COMMUNITIES -STATISTISCHES AMT ü l
STATISTISCHES AMT DER EUROPAISCHEN GEMEINSCHAFTE1 ISTITUTO STATISTICO DELLE COMUNITÀ EUROPEE - BUREAU VOOR DE STATISTIEK OER EUROPESE GEMEENSCHAPPEN - D E T STATISTISK! DEPARTEMENT FOR DE EUROPÆISKE FÆLLESSKABER - OFFICE STATISTIQUE DES COMMUNAUTES EUROPEENNES - STATISTICAL O F F I c l F THE EUROPEAN COMMUNITIES - STATISTISCHES AMT DER EUROPAISCHEN GEMEINSCHAFTEN - ISTITUTO STATISTICO DELLE COMUNll A EUROPEE - BUREAU VOOR DE STATISTIEK DER EUROPESE GEMEENSCHAPPEN - DET STATISTISKE DEPARTEMENT FOR DE EUROPÆ IS« E F Æ LLESSKABER - OFFICE STATISTIQUE DES COMMUNAUTES EUROPEENNES - STATISTICAL OFFICE OF THE EUROPEAN COMMUNITIES [ STATISTISCHES AMT DER EUROPAISCHEN GEMEINSCHAFTEN - ISTITUTO STATISTICO DELLE COMUNITÀ EUROPEE - BUREAU VOOR DE S T I TISTIEK DER EUROPESE GEMEENSCHAPPEN - DET STATISTISKE DEPARTEMENT FOR DE EUROPÆ ISKE FÆ LLESSKABER - OFFICE STATISI IQUE DES COMMUNAUTES EUROPEENNES - STATISTICAL OFFICE OF THE EUROPEAN COMMUNITIES - STATISTISCHES AMT DER EUROPAlJ CHEN GEMEINSCHAFTEN - ISTITUTO STATISTICO DELLE COMUNITÀ EUROPEE - BUREAU VOOR DE STATISTIEK DER EUROPESE GEMEENS! HAPPEN - DET STATISTISKE DEPARTEMENT FOR DE EUROPÆ ISKE FÆ LLESSKABER - OFFICE STATISTIQUE DES COMMUNAUTES EUROPI
eurostat
DE EUROPÆISKE FÆLLESSKABERS STATISTISKE KONTOR
STATISTISCHES AMT DER EUROPÄISCHEN GEMEINSCHAFTEN
STATISTICAL OFFICE OF THE EUROPEAN COMMUNITIES
OFFICE STATISTIQUE DES COMMUNAUTÉS EUROPÉENNES
ISTITUTO STATISTICO DELLE COMUNITÀ EUROPEE
BUREAU VOOR DE STATISTIEK DER EUROPESE GEMEENSCHAPPEN
L u x e m b o u r g . Centre Europeen Boite postale 1907 — Tel 43011 Telex Comeur Lu 3423 1049 Bruxelles Bâtiment B e r l a y m o n t . Rue de la Loi 200 (Bureau de liaison) — Tel 735 80 40
Editors : Mr L. Ronchi
Bâtiment Jean Monnet, bureau Β 3/091, tél. 4301/2042
Miss G. Conrath
Bâtiment Jean Monnet, bureau Β 3/093, tél. 4301/2040
Manuscript completed 10.2.1978
Printed in Belgium 1978
¿n
TABLE OP CONTENTS
1 - NEWS ITEMS
Appointments . 7 Survey on the structure of agricultural holdings 7 Sectoral income index 1977 · Forecasting of relative
change in the value added of agriculture per person 8 employed in 1977
2 - PUBLICATIONS
Annual publications 20 Special studies and publications 23
Periodicals 29
3 - ARTICLES
APPOINTMENTS
Mr. Guy BERTAUD, Director responsible for "Statistical Methods and Data processing" was elected last December, at the session held in New Delhi, to full membership of the International Institute of Statistics.
Mr. Niels AHRENDT has been appointed Assistant to the Director-General of the Statistical Office with effect from 1st February 1978.
SURVEY ON THE STRUCTURE OF AGRICULTURAL HOLDINGS
On 19th December 1977 the Council decided to have a survey carried out in the member etates on the structure of agricultural holdings (Regulation (EEC) n° 218/78. This survey will take place during the, period from 1st April 1979 to 15th June I98O and is within the framework of the FAO'ε recommandations for a world agricultural census.
SECTORAL INCOME INDEX 1977:
Forecasting of relative change in the value added of agriculture per person employed in 1977
1. Introduction
In a recent report ' the Statistical Office of the European Communities (SOEC) publishes estimates of the relative change between 1976 and 1977 in "the value added (total factor income) of agriculture in the individual Member States and in the Community as a whole. The Member States and the SOEC were encouraged to do this after observing that, in spite of all the difficulties encountered, the exercise carried cut jointly for the first time in 1976, had produced sat-isfactory results and despite the fact that the drought in summer 1976 created special forecasting problems.
The following methodological points should be borne in mind when considering the information contained in the report:
- The results cover the relative change in gross value added at factor cost in agriculture per worker in the calendar year 1977 as compared with the previ-ous year. Each calendar year, of course, comprises elements of two crop years.
- The estimates were made by the Member States or by experts in the Member States on the basis of a common methodology. The data represent joint esti-mations with no specified margin of error.
The estimates have been drawn up within the methodological framework of the
Economic Accounts for Agriculture which form part of the European System of
Integrated Economic Accounts (ESA). Complete harmonization of data has not
yet been achieved however. In principle the results cover the production
branch 'Products of agriculture and hunting', and not the activity sector
'Agriculture', which may be taken in very general terms to be the total of
economic activities of agricultural holdings.
The gross value added at factor cost in the production branch 'Agriculture'
is computed as follows:
Final production
— intermediate consumption
e gross value added at market prices
+ subsidies
- taxes linked to production
c gross value r.dded at factor cost
Gross value added at factor cost in agriculture comprises the total of factor
incomes in the agricultural production branch and fixed capital depreciation
(= the amount of fixed capital used up as a result of normal wear and tear
and obsolescence).
■ Gross value added at factor cost in agriculture is not an indicator for the
total household income of farmers. It should be recalled that in addition to
their purely agricultural income in the strict sense, agricultural holdings
or households may also receive incomes from other sources. The figures on
the relative change in gross value added at factor cost in agriculture per
worker do, however, give an important indication of changes in the purely
10
- The average rates of change for agricultural gross value added for the indi-vidual Member States and for the Community as a whole give no indication of the differences between regions and types of farm within the Member States.
- No comparison in absolute terms of gross value added at factor cost per worker can be made at the present time, principally because labour statis-tics have not yet been harmonized. Information can, however, be supplied on changes in relative terms - albeit with certain reservations.
- The data on the relative change in real terms of gross value added at factor cost per worker were obtained by deflating the corresponding nominal rates of change by the implicit GDP deflator. The values for this price index were supplied by Directorate-General II of the Commission of the European Communities. The real rates of change contained in the report do not, therefore, represent the results of a computation in volume terms.
2. Summary of results
1) 2)
For 1977 the value added of agriculture ' in the Community is expected to show a smaller increase than in 1976, a year which was initially regarded as poor but which subsequently proved rather better than expected. Accord-ing to the Member States' estimates, an increase-in the value added of agri-culture of some + 7/° in nominal terms is to be expected in 1977, compared with about + 115Í in 1976· Talcing account of the average rate of price in-crease in the Community (rate of inflation) ' of + 9.I5Í in 1977, the value added of agriculture in the Community is expected to show a decline of near-ly - 2/0 in real terms, whereas there was no change in real terms in the pre-vious year.
1) Gross value added at factor cost
11
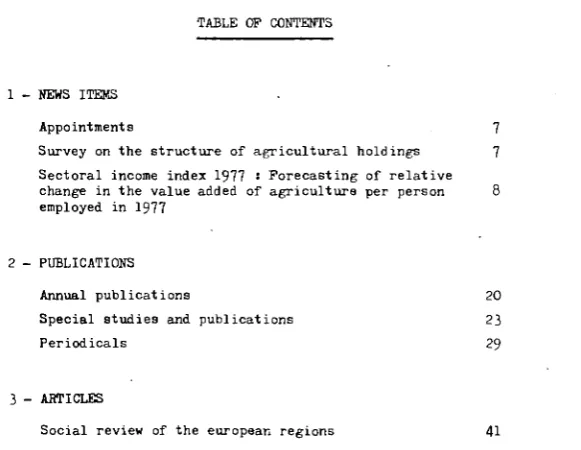
T a b l e 1 : E s t i m a t e d r a t e s of change i n t h e g r o s s v a l u e added a t f a c t o r c o s t o f a g r i c u l t u r e i n 1977 {'/■>)
C o u n t r y and d a t e of l a s t e s t i m a t e
D ( 1 2 . I . 7 8 )
F ( 2 6 . I O . 7 7 )
ι ( 1 5 . 1 1 . 7 7 ) NL ( I 8 . l l . 7 7 ) Β ( 2 8 . 1 2 . 7 7 ) L ( 2 4 . I I . 7 7 ) UK (Nov. 7 7 ) IRL ( 1 9 . I . 7 8 ) b ) DK ( 6 . I . 7 8 )
EUR9
T o t a l
n o m i n a l
5 . 9 + 1 3 . 1 + 1 4 . 9 + 0 . 1 3 . 6 + 7 4 + 13
+ 3 3 . 5 + I 7 . 9
+ 7 3
r e a l
9 1 + 3 . 8 3 . 0 6 . 1 I O . 4 + 0 . 9
1.0 + 1 8 . 0 + 8 . 2
1.7
P e r c a p i t a
n o m i n a l
4 . 8 + 1 8 . 4 + 1 5 . 5 + 1.1 + 0 . 4
+ 9 5 + 14 + 3 7 . 5 + 2 0 . 9
+ 97
r e a l
8 . 0 + 8 . 6
2 5 52 6 . 7 + 2 . 8 + 0 + 2 I . 5 + I O . 9
+ O.5
a ) iiounded t o t h e n e a r e s t whole p c i c e r . l b ) Rounded t o t h e n e a r e s t h a l f p e r c e n t
Since it is estimated that, as in previous years, there was a further re
duction in the number of agricultural workers (estimate for 1977: 1.9/ó)t
the picture is somewhat brighter in the case of per cani ta value added.
Thus, in 1977i compared with the previous year, the Community average per
capita gross value added at factor cost is expected to show an increase of
almost + 10/Ó in nominal terms and to remain almost the same in reol tenir
[image:13.459.77.381.162.372.2] 12
These figures indicate the effect of the reduction in the number of a g r i
c u l t u r a l workers, and therefore of the s t r u c t u r a l change in a g r i c u l t u r e ,
on the evolution of the per c a p i t a value added of a g r i c u l t u r e .
However,
the average r a t e of exodus of workers from a g r i c u l t u r e in the Community
has slowed appreciably in the l a s t three y e a r s
rf a l l i n g from 3.8% in
1975 to I.95Í in 1977· This trend was influenced f i r s t and foremost by
a lower r a t e of economic growth and the consecruent diminished a t t r a c t i o n
of n o n a g r i c u l t u r a l sectors of the economy for a g r i c u l t u r a l workers.
Table 2: Rates of change in the r e a l per c a p i t a 'gross value added at factor
cost of a g r i c u l t u r e
(%)
COUNTRY D F I ITL Β L UX IRL ΕΚ EUIÏ9
75 i 74
+
8.9
6.0
+
8.4
+
6.2
+ 53
+ 9.6
-
2·
7+ 16.8
2.4
+
2 . 6 ^
76 + +
-+ +
-+ + +
: 75
32 3 . 0 0 . 5
6 . 1 3 . 6 1.2
54
0.2
6 . 7
2 . 6 *
77 : 76
8.0
+
8.6
25
52
6.7
+ 2.8
0
D
+ 2 1 . 5
2'
+ IO.9
+
0 .
5«
3ycar
average
1
+
1.4
+
1.9
+
1.8
+ 2.4
;
+ 0.7
|
♦ 37
|
+ 0.9
i'
+ 12.7
. , .
j
3 ) î
11) Rounded to the nearest whole percent
2) Rounded to the nearest half percent
[image:14.459.119.350.290.474.2]13
Because of special features in individual y e a r s , for which n e i t h e r the
farmers themselves nor the makers of a g r i c u l t u r a l policy can be held
responsible ( e . g . the e f f e c t s of periods of drought), i t i s advisable
to take account of average t r e n d s in value added over several years in
the presentation and a n a l y s i s of the r e s u l t s .
Taking the average of
the l a s t three calendar years (19751977) the per capita gross value
added at factor cost of a g r i c u l t u r e has increased by almost + 145¿ in
nominal terms and + 2% in r e a l terms (cf. Table 2 ) .
This r e s u l t i s
c l e a r l y more favourable than the r e s u l t for 1977.
A comparison of the r a t e s of change in r e a l per c a p i t a gross value added
at factor cost reveals as in previous years considerable differences
between the various Member S t a t e s in 1977·
Increases in r e a l terms are
expected for Ireland (+ 21.5',^), Denmark (+ 10.9%), France (+
0.6%)
and
Luxembourg (+ 2.85a). With an increase of over
20p
Ireland i s well o u t
side the range of the r e a l r a t e s of change for the other c o u n t r i e s .
The
reasons for t h i s exceptional i n c r e a s e are f i r s t l y , the increases in the
volume of f i n a l crop and animal production (31 and 7Λ> r e s p e c t i v e l y ) , and
secondly, producer p r i c e s , which rose sharply in t h e case of animal prod
u c t s in p a r t i c u l a r (t 24$) ·
This i n c r e a s e in r e a l per c a p i t a gross value
added at factor cost in I r e l a n d must, however, be considered against the
background of a stagnation in r e a l terms in 1976.
In thè United Kingdom
r e a l per c a p i t a gross value added at f a c t o r cost i s expected to show no
change in 1977* In the other Member S t a t e s a decrease in r e a l terms i s
f o r e c a s t , ranging from 2.5/» for I t a l y t o 52% for the Netherlands,
6.7% for Belgium and 8.0;á for the Federal Republic of Germany.
In a f i n a l assessment of the r a t e s of change in r e a l per c a p i t a gross
value added at factor c o s t , which in 1977 as shov.n above i s in five
Member States expected e i t h e r to stagnate or in some cases to show a
marked decrease, account must also be taken of the fact t h a t in most
Member S t a t e s individual years offset one another.
Thus, Table 2 shows
t h a t the t h r e e y e a r a\
rerage of the r a t e s of change from 19751977 i s
14
Methodological note:
The real rates of change in the value added of the Community were calculated as a weighted average of the nine national real rates of change. The weighting factors used are the following percentage shares of the gross value added at factor cost of Community agriculture in 1976 (at current prices):
D F I
199% 28.8% 25.O7Î
NL Β L
7.2/0
3.4f" O.lfo
UK IRL DK
9 2
3
The nominal rates of change for the Community were calculated by inflating the real rates of change.
General note
Details of the changes in 1977 (compared with 1976) for all countries, and for the separate components of gross value added at factor cost (i.e. final pro duction of crops, animals and animal products plus subsidies less intermediate consumption and taxes linked to production) are given in the full report (ref erence D / S X / 3 4 ) which is available on demand.*
15
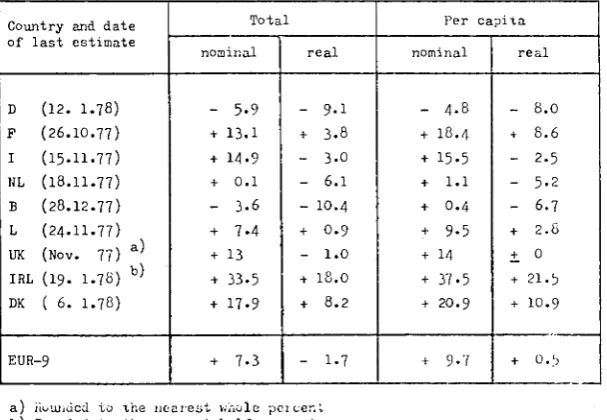
Anticipated relative change in real rross value added at factor cost in agriculture ocr person employed
15
10 +8,6 1977
+21,5
+2,8
+10,9
+0,5 Γ ~ ~ Ί
- 10 - 8 , 0
2,5
- 5 , 2
- 6 , 7
15
15 10
5
-+1,4 + 1'9 +l,E
1—1
I L i
Í
i?T5 1977
+2,4 +3,7
+0,7
I I
+ 1 2 , 7
+ 0 , 9
+ 5 , 1
+2,0
- 5
10
15
19
SUMMARY
P u b l i s h e d :
S p e c i a l p u b l i c a t i o n s and s e r i e s :
I n p u t - O u t p u t T a b l e s 1970, V o l . 1-5 24 S t r u c t u r e of e a r n i n g s in w h o l e s a l e and r e t a i l d i s t r i b u t i o n ,
banking and i n s u r a n c e in 1974, Vol. 1-4 26 C o n f i d e n t i a l i t y and b u s i n e s s s t a t i s t i c s in the EC
(DE, EN, FR, DK, IT) 23
December 1977 :
Gas s t a t i s t i c s 21 E l e c t r i c a l energy s t a t i s t i c s 21
Regional s t a t i s t i c s : P o p u l a t i o n , employment, l i v i n g s t a n d a r d s 25 Methodology of t h e EC-Index of p r o d u c e r p r i c e s of a g r i c u l t u r a l
p r o d u c t s 27 Gas p r i c e s 1970-76 28
J a n u a r y 1978 :
N a t i o n a l a c c o u n t s - ESA - Aggregates - Ì96O-I976 20
Yearbook of a g r i c u l t u r a l s t a t i s t i c s 20
Petroleum s t a t i s t i c s 2? Milk and milk p r o d u c t s 28
F e b r u a r y 1978 :
Demographic s t a t i s t i c s 25 Labour c o s t s i n . d i s t r i b u t i v e t r a d e s , banking and i n s u r a n c e .1974 27
To be p u b l i s h e d s h o r t l y :
20
-ANNUAL PUBLICATIONS
Purple series : National accounts - ESA - Aggregates - 1960-1976
Price : UKL 4 DKR 42,50 USD 7 BFR 250 lib pages Format A 4
Editions EN/FR/NL, DA/DE/IT published in January I978
Results of the principal aggregates of the national accounts drawn up according te ESA (European System of Integrated Economic Accounts). Seventeen years of developmental comparison between the Community as a whole (ETJR-9), the nine Member States, the United States and Japan. The data are expressed in monetary units (Eur and national currencies), in indices and in growth rates.
Green series : Yearbook of agricultural statistics
ISBN 92-825-OOI8-7 Price : UTL 5 DKR 51 USD 8 BFR 300 276 pages Format C 5
Multilingual edition published in January I978
This book is a kind of statistical vademecum containing the most important items published in "agricultural statistics". This publication is subdivided in 6 parts :
General
Agricultural and forestry accounts Structure
Production
Supply balance sheet Prices and price indexes.
Prices of fruit, vegetables and potatoes ISBN 92-825-OO8I-O
Approximately 125 pages Format A 4
Multilingual edition to be published inFebruary 1978
This edition is bringing up to date the prices published together with their descriptions in the special issue "Agricultural prices - Fruit, vegetables and potatoes" S 8/1973·
The new edition contains the definite prices of fruit, vegetables and potatoes for 1975 a11^ provisional figures for 1976.
21
Ruby series : Gas statistics
Price : UKL 1.60 DKR 17 USD 2.80 o BFR 100 54 pages Format A 4
Bilingual edition EN/FR published in December 1977
The publication "Gas statistics 1976" provides balance sheets and tables relative to the gas industry following an established harmonized methodology. It embraces the different combustible gases : natural gas, coke oven gas, blast furnace and works gas. The figures are not simply limited to the year 1976. In certain cases the values for 1970 and 1975 are given in order to indicate the short term trends.
A series of tables with the structural data ae well as an analysis of the transformations in gas works are also included in the brochure.
Electrical energy statistics Price : UKL
DKR USD BFR
3.20
34
5.60
200112 pages Format A 4
Bilingual edition EN/FR published in December 1977
This publication furnishes detailed harmonised and preponderantly definite data concerning the electrical economy during the past calendar year. It gives the specialist additional information and a rapid updating of time series published in the yearbook Energy.
22
Petroleum statistics
Price : UKL
DKR
USDBFR
1.60
17
2.80
100
76 pages Format A 4
Edition EN/PR published in January I978
This publication supplies the harmonized data for the petroleum industry during the course of the past year. It contains for the specialist com-lementary data and a rapid up date of the historical series published in the Energy Statistics Yearbooks. It covers the different petroleum products, presenting for each of them the various energy flows. A series of tables on the structure of the petroleum industry equipment is also included in this brochure.
Overall energy balance-sheets 1963-1976
ISBN 92-825-OI23-X Price : UKL
DKR
USDBFR
3.20
34
5.60
200
Approximately 70 pages Format A 4
Edition FR to be published in February I978 Second edition 1977
This brochure is drawn up in accordance with the layout and methodology developed by the Statistical Office of the European Communities. It con-tains energy balance-sheets in tonnes coal equivalent for each of the Member States and for the Community.
The presentation adopted is that of unified balance sheets and balance-sheets broken down by product. Data are provided for the years I963, 70, 71, 72, 73, 74 and 75, with two growth rate series.
- 23
S P E C I A L P U B L I C A T I O N S A N D S E R I E S
Orange series : Confidentiality and business statistics in the European Community
Price : UKL 3.20 DKR 31,30 UKL 5-40 BFR 200 147 pages Format C 5
Editions DA, DE, EN, FR, IT, NL
Published : DE, EN, FR, DA, IT
It is the constant concern of the official statistical services to safeguard the confidentiality of the information with which they are entrusted. Each Member Country has its own customary procedures taking the form, in many cases, of national laws defining the rules of con-fidentiality applicable to business statistics.
These rules, which were elaborated in a national context, are now applied to Community statistics where they have led, in combination, to a far more drastic shrinkage of information than that which they cause at a national level. At the same time, in industrial circles in every Member Country, there is evident reluctance to release more information than is released by the others, apprehensions conducive to the development of a restrictive approach.
For that reason, the Statistical Office of the European Communities has decided, in agreement with the national statistical services, to examin this problem with a view to its solution. This report is a major con-tribution to such an undertaking. Its preparation was rendered possible by the collaboration of the various National Statistical Institutes, which not only provided the author with the necessary information regarding the laws and practices relating to the confidentiality of business statistics in their respective countries but also submitted their comments on the first version of the report.· Nevertheless, as the author himself has emphasized in his preface, the opinions ex-pressed in this document are strictly his own, and are in no way to be taken as those of the national statistical services or of the Commission of the European Communities.
24
-Purple series : Input-output tables 1970
S p e c i a l o—volume s e r i e s P u b l i s h e d :
Volume 1 - Methodology 1
complete [TKL DKR USD BFR 2 Format A 4
970-1975 : 38 pag,
series
30.50
393,50
71.60
5OO
Ï SPr : ce
:
per UKL DKR USD BFR volume
4.25
55,-10.10
350
Editions FR, DE, EN, NL, IT, DA Volume 2 - United Kingdom I97O : 121 pages
Edition EN/FR
Volume 3 - Nederland I97O : II9 pages Edition NL/FR
Volume 4 - Italia 1970 : II9 pageB Edition IT/FR
Volume 5 - BelgiS/Belgique 1970 : 120 pages Edition NL/FR
Volume 1 of this series describes the methodology established by the SOEC for the construction of input-output tables calculated, from the year 1970 on, according to Community rules. A general description of the
input-output table is given, with some detail on its various components and their relationships. The classifications and the accounting rules which are used are defined by a number of references to the European System of integrated economic Accounts (ESA). The last chapter shows a few examples of the way in which the tables can be used for economic analysis.
Each of the volumes 2 to 7 deals with the input-output table of one country (United Kingdom, the Netherlands, Italy, Belgium, Oermany, France). In each volume, the first part describes the problems enoountered when using the Community classifications and methods and the adjustments made in order to improve comparability from one country to another. A short description of the table is also given. The second part is composed of the
input-output table expressed in units of account EUR, tables of direct coefficients (vertical and horizontal) and several tables of indirect coefficients (inverse matrix, content of imports, content of primary inputs in the final uses).
25
-Regional statistics : Population. Employment. Living standards
Price : UKL 4.75 DKR 31 USD 8.25 EFR 300 362 pages Format A 4
Multilingual edition published in December 1977
This publication contains the most recent statistics on social conditions in the 140 regions of the European Communities :
- Total population and population growth, birthB, deaths, trends in birth and death rates, age structure, trend of population, interregional movemer of population.
- Employment and structure of employment broken down by sex, age, categories of activity, branches of activity.
- Registered unemployment.
- Indicators of the quality of life : physical environment, education, health, miscellaneous indicators of standard of living, workers' earnings. The yearbook includes a folding map of the regions and 10 maps illustrating the main topics.
Yellow series : Demographic statistics 1960-1976
__ „ , Price : UKL 4.80
ISBH 92-825-OO46-? D K H 5 1
USD 8.3O
120 pages Format A 4 B F R 3°°
Multilingual edition published in February I978·
26
Structure of earnings in wholesale and retail distribut ion, banking; and insurance in 1974
Price :
complete series per volume UKL 55 UKL 7-30 DKR 708 DKR 94,50 BFR 4 500 BFR 600 USD 130 USD 17-20 Special series in 10 volumes Format A 4
Published :
Volume 1 - Methods and Definitions : 223 pages multilingual edition
Volume 2 - Luxembourg : 376 pages Edition EN/FR
Volume 3 - Danmark : 442 pages Edition EN/FR
Volume 4 - Belgique/België : 476 pages Edition EN/FR
This survey has been conducted simultaneously, and according to identical methods, in the 9 countries of the European Community.
27
Labour costs in distributive trades, banking and insurance - 1974
Price : UKL 6.30 DKR 65,50 USD 11 BFR 400 232 pages Format A 4
Multilingual edition published in February 1978
This publication contains the methodology and detailed results of the Community survey of labour costs in wholesale and retail distribution, in banking and in insurance in 1974«
These results cover the labour force and number of enterprises, the average annual hours worked, the wages and salaries and labour costs by employee. The structure of labour costs is analysed by typeB of expenditure. The results for wholesale and retail distribution are analysed according to the size of enterprises, measured by number of employees and the activities as definedin the General Classification of Economic Activities in the European Communities (NACE).
Methodology of the
Green series : EC-Index of producer prices of agricultural products
Price : UKL 6.20 DKR 62,50 USD 10.70
274 pages Format A 4 B P R 4°°
Multilingual edition published in December I977
This publication is a treatise. It contains the description of the method, the composition and, enriched by graphs, the evolution of the new EC-Index (EUR-9) of the producer prices for agricultural products (base I97O = 100).
The field of observations covered by the index has been enlarged with regard to the former EC-Index (EUR-6). Numerous seasonal products have been included. Whereas on the annual basis the index comprises also the prices for fruit and vegetables, this information is not yet available at monthly level.
28
Milk and milk products
Price : UKL 5.50 DKR 59 USD 1° BFR 350
102 pages Format A 4
Multilingual edition published in January I978
The brochure covers the period upt to 1976 in the nine Member States »rid contains the following information :
- data on the utilization of whole and skimmed milk at the level either
of agricultural holdings or of dairies;
- balance sheet for the utilization of butterfat in dairies; - suppliée statements for dairy produce;
- breakdown by region of milk and cream collection.
The retrospective series generally refer to the eix founder Member
States, but in certain cases comparable data were also obtained for the
three new Member States.
Ruby series : Gas prices
Price
264 pages Format A 4
Edition E/t· published in October 1977
.Edition D/l ίο b. published in December 1977
The study gives the results of the enquiry into gas prices for the period 1970-76 in the nine countries of the Community, with a break down covering 29 locations and indication of three values (price without taxes, taxes,selling price). The results are presented in tabular form, illustrated with graphs, and accompanied by a commentary for each country covering : organisation, regulations, tariffs, taxes and detailed analysis of prices. The study concludes with an inter national comparison for the gas industry overall.
£ DKr USJ FB
I3.9O
140,70
29
EUROSTAT PERIODICALS
Orange series : Monthly general statistics bulletin ISSN O378-3456
Annual subscription UKL DKR USD BFR
24 246
4I.5O 1 500
Single copy : UKL DKR USD BFR
3.20 32,80
5.5O
200 Approximately I88 pages Format A 4 monthlyPrincipal figures on the short-term economic evolution in the enlarged Community, i.e. : employment, industry, internal trade and services, transport, external trade, price and wage indices, finance, balance of payments.
Yellow series : Hourly earnings - Hours of work ISSN O378-3596
Annual subscription : UKL 9*60 DKR 98,50 USD I6.5O BFR 6OO
Single copy : UKL 6.40 DKR 65,55 USD 11.10 BFR 400 Approximately 266 pages Format A 4 half-yearly
This publication which is updated every six months contains harmonized data on workers1 hourly wages, on labour costs, and weekly hours worked,
30
Green series : Crop production ISSN O378-3588
Annual s u b s c r i p t i o n : UKL DKR
USD
BFR 40
410
69 2 5OO
S i n g l e copy : UKL
DKR USD BFR
4.8O 4 9 , 2 0 8 . 2 5 300
Approximately 120 pages Format A 4 11 issues per year The most recent information on
Crop production of arable land (area, yield, production) 1) or
Fruit and vegetable production (area, yield, production) 2) Areas sown (twice a year)
3) Stocks and deliveries of cereals and potatoes 4) Meteorological report
5) Supply balances for crop products (3 or 4 per year).
Monthly statistics of meat ISSN O376-3553
Annual subscription : UKL 40 Single copy : UKL 4.8O DKR 410 DKR 49,20 USD 69 USD 8.25 BFR 2 500 BFR 30O Approximately 100 pages Format A 4 11 issues per year
- 31
Monthly statistics of sugar
Annual subscription : UKL Single copy : UKL
DKR DKR USD USD BFR BFR Approximately 75 pages Format A 4 11 issues per year
Monthly balance sheets showing the main flows of sugar only, expressed as white sugar equivalent. Products containing sugar (sweetened products) are therefore excluded. The objective of the publication is two-fold : to make provisional annual data rapidly available at the end of the crop year, before the issue of final figures, and to follow the seasonal trends of the different flows.
Monthly statistics of milk
ISSN 0378-3545
Annual subscription : UKL 22.40 Single copy : UKL 2.90 DKR 229,50 DKR 29,50 USD 39 USD 5 BFR 1 4OO BFR 18O Approximately 60 pages Format A 4 8 to 10 issues per year Publication of weekly and monthly statistics transmitted by Member States in compliance with the Council directive of 31st July 1972, on the statistical surveys to be made by Member States concerning milk and milk products (72/28O/EEC).
The bulletin contains the data relating to cows milk collection and the production of processed products by the dairy industry. From time to time the bulletin may contain a commentary on the supply balance sheets and
- 32
Monthly s t a t i s t i c s of egfls
ISSN O378-3537
Annual subscription :
UKL
DKR
USD
BFR
22.40 229,50
39
1 400
Single copy : UKL
DKR
USD
BFR
2.9O
29,50
5
180
Approximately 75 pages Format A4 8 to 10 issues per year
Publication of monthly s t a t i s t i c s transmitted by Member States in compliance with the Council regulations 2782/75 and 1868/77 on the commercialisation of hatching eggs and farmyard poultry chicks. The bulletin contains data on the selection, multiplication and the uses by species as well as trade with third countries. In addition the bulletin may contain data on structure of hatcheries, commentaries (pink pages) and information on supply balance sheets.
Selling prices of vegetable products
ISSN O378-6714
Annual subscription : UKL 43.20 Single copy : UKL 4.80 (Selling prices of animal DKR 442,50 DKR 49-20 products included) USD 74.50 USD 8 . 2 5
BFR 2 700 BFR 300
Approximately 100 pages Format A 4 bi-monthly
33
Selling prices of animal products ISSN O378-6722
Annual subscription : (Selling prices of vegetable products included)
UKL 43.20 DKR 442,50 USD 74.50 BFR 2 700
Single copy : UKL 4.80 DKR 49-20 USD 8.25 BFR 300 Approximately 125 pages Format A 4 bi-monthly
Monthly and annual up-dating of the prices of the most important animal products and of a number of products processed by the food industry. The prices for each of the member countries are given in national currency and in EUA. The percentage variations refer to the comparable period of the year before. The monthly evolutions of the prices in EUA of most products are illustrated also by graphs.
Purchase prices of the means of production ISSU O378-6692
Annual subscription : UKL 11.20 DKR 115 USD I9.5O BFR 7OO
Single copy : UKL DKR USD BFR 4 41 6.9O 25O Approximately I40 pages Format A 4 quarterly
Up-dated monthly and annual figures for the principal products bought by farmerB. The seriee for each of the member countries cover animal feed, fertilizers, transport and heating fuels, seeds and pesticides.
EC-Index of producer prices of agricultural products
Annual s u b s c r i p t i o n : UKL DKH
USD BFR
1 1 . 2 0 115
I9.5O
700
Approximately 28 pages Format A 4
S i n g l e copy
bi-monthly : UKL DKR USD BFR 2.4O 2 4 , 6 0
4.I5
150
34
Fishery statistics
Annual subscription : UKL Single copy : UKL
DKR DKR USD USD BFR BFR Approximately 72 pages Format A 4 quarterly
The publication contains monthly statistics on the quantities and values of landings for the principal fish species in Member States.
Blue series : Industrial short-term trends ISSN O378-7427
Annual subscription UKL DKR USD 3FR
8
82 13.80 500Single copy : UKL DKR USD BFR 0.80 8,20 1.40 50
Approximately 50 pages Format A 4 monthly Publication of short-term industrial indicators.
The publication contains indices of industrial production for about 40 industrial branches and groups of branches. During 1978 the contenta will be gradually increased to include indices of turnover, new orders, employees, wages and salaries and hours worked.
Methodological supplements and retrospective series will complete the regular monthly publication.
Quarterly bulletin of industrial production ISSN O378-3529
Annual subscription : UKL 14*40 DKR 147,50 USD 25 BFR 9OO
Approximately 147 pages Format A 4 quarterly
Annual and quarterly indices of industrial production in the countries of the Community.
Data on production within the Community of certain raw materials and finished or semi-finished products.
35
Quarterly iron and steel bulletin ISSN O378-35IO
Annual subscription UKL I4.4O DKR 147,50 USD 25 BFR 9OO ¡s Format A 4
Single copy quarterly : UKL DKR USD BFR 4.80 49,20 8.25 300
Approximately 120 pages
Annual, quarterly and monthly statistics of production, deliveries, receipts and foreign trade in iron ore, pig iron, crude steel and rolled steel products, on the consumption of raw materials in the iron and steel industry and deliveries by merchants of steel products and of scrap, together with statistics of the labour force, hours of work and wages in the iron and steel industry.
Monthly iron and steel bulletin
UKL DKR USD BFR 6.40 65,50 11
400
Single copy : UKL DKR USD BFR 0.80 8,20 1.40 50 Annual subscription
Approximately 19 pages Format A 4 monthly (ll issues per year) Monthly statistics on the number of short-time workers; the production
of pig iron, crude steel and finished rolled products; new orders, order books and deliveries of ordinary steels; the production and deliveries of special steels; foreign trade in ECSC steel products; the consumption and net receipts of ferrous scrap by the iron and steel industry.
Ruby series : Coal - Monthly bulletin ISSN 0378-357X
Annual subscription UKL DKR USD BFR 4.80
49
8.50 300Single copy : UKL DKR USD BFR 0.65 6,50 1.15 40
Approximately 14 pages Format A 4 monthly (ll issues per year) Produce monthly the principal statistical series characterising the
-
36Hydrocarbons - Monthly bulletin ISSN O378-373I
Annual subscription UKL DKR USD BFR
9.6O 9 8 , 5 0 I6.5O 600
S i n g l e copy : UKL DKR
USD
BFR
O.95
9,85
1.65
60
Approximately 20 pages Format A 4 monthly (ll issues per year) Produce monthly the principal statistical series characterising the short term movements in the petroleum and gaB industries.
Electrical energy - Monthly bulletin ISSN O378-356I
Annual subscription : UKL 4.8O Single copy : UKL O.65 DKR 49 DKR 6,50 USD 8.5O USD 1.15 BFR 300 BFR 40 Approximately 12 pages Format A 4 monthly (ll issues per year) Produce monthly principal statistical series characterising the short term movements in the electrical economy in general and fuel consumption in power stations in particular.
Red series : Monthly external trade bulletin
ISSN O378-3723
Annual subscription : UKL 24 Single copy : UKL 2.9O DKR 246 DKR 29,50 USD 4I.5O USD 5 -BFR 1 5OO -BFR 180 Approximately 130 pages Format A 4 monthly (ll issues per year) General summary of foreign trade of the European Community by countries and by products.
37
Crimson series : Monthly tables of transport ISSN O378-3502
Annual subscription : UKL 20 Single copy : UKL 2.4O DKR 205 DKR 24.60 USD 34.5O USD 4.15 BFR 1 25O - BFR 150 Approximately 60 pages Format A 4 monthly
Monthly data on :
- Transport of pereons and goods by Railway, Inland Waterways, Merchant Shipping and Road
- Registration of motor vehicles - Road traffic accidents - Aviation
Contributions to european statistics (Studies, Analyses)
41
-SOCIAL REVIEW
OF THE EUROPEAN REGIONS
Bernard LANGEVLN
With the large set of data now available on various social aspects of the one hundred or so regions of the European Community* it is possible to carry out in—depth analyses and comparisons of the social realities in these regions. In this article I shall simply give a preliminary outline of the most striking findings on population, employment, unemployment and standards of living.
1. POPULATION
Territorial distribution
Available space per inhabitant is one of the resources which is least well distributed in Europe - the population per km2 ranges from 25 in Corsica to nearly 1000 in South Holland, a ratio of 1 : 40. Apart from pockets of high population density in the major cities of Europe, all the regions with a density of more than 300 inhabitants per km2 are situated along a median axis running from England along the Rhine to Northern Italy, while most of the peripheral regions of Europe have densities of less than 100 inhabitants/k»2.
Population migrations
The concentration of the population along this median axis is explained by the industrial revolution and the resulting industrial areas - comparison between the population density and the percentage of employment in industry is highly significant here. Much of the population growth in industrial regions resulted from an influx of rural population attracted to those areas. However, this traditional migration is now on the decline, as the 'reserv.ir' of
agricultural labour is drained — in most of the Community regions, the proportion of the agricultural population has fallen to less than 10 'f,.
42
On the other hand, new trends have emerged in the past few years :
— In the first place, the populations of cities appear to have stopped increasing, and in sone cases to be declining, as people nove towards the lese highly populated edges of their catchment areas· This trend
hits been apparent in the 'city—regions' such as Hamburg, Bremen and Brussels, where the migratory balances are now below thè national average, and are often even negative.
— Secondly, certain old industrial regions are having structural reorganization difficulties, while new industries are being established in less industrialized regions with the advantages of space, ease of communications and a pleasant environment. Hence favourable migratory balances for migration are founded towards the regions in the South of Germany, whereas the balance is unfavourable in regions such as the Saarland, Nord-Paa-de-Calais and Lorraine. There is therefore a new flow of emigration, no longer away from agricultural regions, but away from declining industrial regions.
— Finally, retirement is accounting for an increasing movement of older people away from industrial regions to regions with a more pleasant climate and environment, such as Provence-Alpes-C3te d'Azur, Liguria and the South West of England.
Natural movement of the population
-
43Birth rates
Population trends in the regions reflect the general marked decline in the birth rate since I966/67. After the last war, the birth rate remained in the region of 18 births per 1000 inhabitants, but then fell in less than 10 years to below I3 births per 1000 inhabitants, and with the present age structure of Europe's population, a net reproduction rate of 1 should give a birth rate of approximately I5 births per 1000 inhabitants.
Since 1972 the number of girls being born has been smaller than the number of girls in their parents' generations and in the long run, if there is no immigration, the population will decline. In 1975, more than 3/4 of the Community regions had birth rates below the self-renewal level, and in some parts ef Germany births did not even reach 2/3 of the figure required for self—renewal.
However, one should make a distinction between two different types of regions with low birth rates :
- regions where a low birth rate is a long-standing and relatively stable feature of the region, such as Piedmont and Liguria (and to a lesser extent, all the French and Italian regions around the Gulf of Lions and the Ligurian sea).
- regions where a low birth rate is a new phenomenon and where has been marked and rapid decline in the birth rate, such as almost all the regions of Germany and, to a lesser extent, all of Northern Europe.
In this respect Ireland is in an exceptional position in that its birth rate has remained at a fairly constant level of approximately 22 births per 1000 inhabitants - a rate which, in 1975, "as two and a half times that in the Saarland or Düsseldorf.
It is als· interesting to note that the birth rate has a rather marked 'national'character, often with clear differences on either side of frontiers.
Mortality rate
44
-are partly due to the age of the population, but cannot be wholly explained by such differences in population structures. Even with fairly similar structures, the mortality rates in Oberpfalz (Germany) and the North of England are still clearly higher than that in Denmark, for example.
These major disparities in mortality rates are mainly accounted for by the levels of infant mortality, which differ considerably from region to region - the risk of death in the first year of life is three times higher in Campania (Italy) than in Drenthe (Netherlands). The most striking feature of infant mortality is that it is distinctly national; for example, in all the regions of Germany without exception, the infant mortality rate was above 15 per thousand in 1975, and while the German regions bordering on the Netherlands had rates of between 21 and 24 deaths per thousand births, the rates in the Dutch regions on the other side of the frontier were between 9 and 12 deaths per thousand *
If we calculate the resultant of these birth and mortality rates we obtain a very different picture for the different regions. Ireland, Southern Italy and certain regions of the Netherlands have a rate of natural increase in the population of 1 ^ p.a. or more, while in many of the German regions, the indigenous population is declining; unless the trend is reversed, this decline will gradually spread to most of the regions of Northern Europe (except for Ireland) and to the South of France, with a gradual increase in the age of the population.
Population structure by age
It is not possible within the framework of this article to give a detailed analyste of the regional age pyramids created by the various natural and migratory movements and changes wrought by the two world wars. The
45
-transnational characteristics. The 'old' regions, for example, form a long strip along the Mediterranean coast from the South—West of France to Tuscany, with 'pockets' in Nidersachsen (Germany) and the South WeBt of England. The 'young' regions are in three corners of Europe: Southern Italy, Ireland, and a small strip formed by the eastern regions of the Netherlands and Belgian Limburg.
2. LABOUR FORCE
The size of the labour force available in a region depends partly on the size of the population of working age (cf. above) and partly on the activity rate of this section of the population.
Activity rate
The 'activity rates covers all people in the work force whether they have a job or not. There is a considerable difference between the activity rates for men and women.
The male activity rate is above 90 $ in all regions for men aged between 35 and 44; the lowest rates are found in the Mezzogiorno (South of Italy) and the Italian islands, in Hainaut and in Belgian and Dutch Limburg. However, there are considerable variations in both the age of entering the labour market and the age of retirement, and taken all in all, the activity rates for all men aged between 14 and 64 range from approximately 70 $ in the above-mentioned regions to nearly 90 $ in regions like East Anglia and the West Midlands in England.
For women, the situation is far less uniform. In the case of young women, the maximum activity rate, measured at national level*, occurs around the age of 20, but at regional level there are enormous differences - for example, for the 14 - 24 age group, the activity rates vary from over 55 ^ in Mittelfrankon, Lüneburg and Aurich (all in Germany) and Alsace, to lees than 10 ^ in Sicily. Thie low rate is a marked feature of the regions in the South of Italy, including Lazio, all of which without exception have activity rates below 25 /ί, which is lower than anywhere elee in Europe.
-
46.Many women leave the labour market to set up families and have children and then return gradually as the children grow up.
Depending on whether this return to the labour market is encouraged or discouraged for sociological or economic reasons, the following phenomena are observed:
- either an increase in the activity rate, peaking in the forties age group, as observed in central England and Scotland where 2/3 of the women work, and also in Hildesheim and Oldenburg (North Germany) where the level is slightly lower;
- or a continuing decline in the activity rate, as in all the Belgian regions, where the activity ratee are generally low;
- or, as in most of the regions of Europe, a stabilization of the activity rates, at levelB which may be above 55 % as in Ile de France, Basse Normandie, Denmark, Württemberg and Bavaria or, conversely, below 30 % as in Ireland and the majority of the Italian regions, but also in the Grand Duchy of Luxembourg, the Saarland and all the regions of the Netherlands. In fact the lowest activity rates in Europe are found in the Netherlands - in Friesland the activity rate is barely above 10 f=.
Taking all in all, the presence on the labour market of women aged 14 — 64 varies considerably from region to region, from an average of nearly 60 $ in Ile de France to less than 20 % in Friesland, Sardinia and Sicily. The regions where less than a third of all women work include all regions of the Netherlands, the eastern regions of Belgium, the Grand Duchy of Luxembourg, the Saarland, all regions of Italy except for Emilia-Romagna and Marche and, finally, Ireland. On the other hand, more than half of the
women work throughout Great Britain (except for Wales), and in the central
western regions of France, Franche—Comté, Bavaria and Tübingen, and Denmark.
Women's activity rates have a decisive effect on the overall activity
47
Unemployment
Two series of figurée are provided for unemployment :
— persons registering themselves as unemployed during the Community survey
on labour forces, and
— unemployed persona registered at labour exchanges.
To compare the levels of unemployment in different regions of the
Community, we shall for preference use the harmonized results of the Community
survey on labour forces, which gives unbiased and internationally comparable
results; however the results suffer as usual from the uncertainties inherent
in sample surveys. For evaluating trends in unemployment, we will use the more
precise figures on the registered unemployed since the bias due to national
differences in legislation has only a marginal effect on trends.
Up te 1973*, the rate of unemployment in the Community was very low
generally below 2 % — except in certain regions, usually agricultural ones,
where there was high and virtually permanent unemployment, as in most of the
regions of Italy (except for a few regions in the North), Ireland, and the
regions of North in England, Scotland and Northern Ireland.
Since 1974, there has been a considerable increase in unemployment.
In 1975, the average rate of unemployment had almost doubled over 1973 and
a fairly large number of regions, above all peripheral ones, had rates higher
than 5 $·· Certain sectors of the population, especially women and young people,
took the brunt. Female unemployment was particularly bad in France and Italy,
where the female unemployment rate Ì B double that for men in most regions.
The rate of unemployment of young people aged between 14 and 24 was on average
■ore than twice the total unemployment rate. This factor of two was common to
virtually all the regions of the Community, except for Italy, where it was
sometimes as high as four in Southern Italy and Liguria unemployment of young
people reached disturbingly high levels, in the region of 20 $.
48
On the other hand, there were particularly serious increases in levels of unemployment in the regions of Southern Germany, in Niedersachsen, and in Denmark, Scotland and Alsace.
Structure of employment
The relative share of agriculture, industry and the services in total employment is one of the main characteristics of a region. In 1975, agriculture accounted for only 8 $ of total employment in the Community. This shows the extent of the decline in this sector, which in 1950 still accounted for nearly a quarter of total employment*.
But even now there are some regions where more than 20 % of the population are employed in agriculture, namely the whole of the South of Italy, the West of France, Basse Normandie, Limousin and Languedoc—Rouesillon (all in France), Ireland and Niederbayern. These regionB generally have serious problems caused both by their structural and virtually permanent unemployment and by their relative poverty, due to the lower productivity levels of the farming sector.
The activity rate in these regions is similar to that found in the other regions — it is primarily the industrial sector which is depressed, rather than the services, and in a way employment in agriculture 'makes up' for the lack of jobs in industry.
The overall share of the industrial sector in total employment has remained fairly stable. The most striking feature of the sector is ite very slow rate of transfer to new regions — there are still some regions with very high industrial concentrations, such as Lombardy and Rhine—Alpes (where 60 $ and 45 io of employment is in industry) with neighbouring regions where industries have still not taken root, such as Languedoc—Roussillon, where the level of employment in industry is below 25 $·
In the period between I95O and 1975 the share of the services Bector in total employment increased from one third to a half. There is a direct correlation between the predominance of the services sector and the presence of capitals and large cities in a region, and also, more strangely, the
importance of this sector appears to increase with the old age of the populations.
-
493. STANDARD OF LIVING
Employment, and the structure of employment with the various sectoral differences in productivity, determine the level of the regional product; but the standard of living in a region can be better gauged from the product or income per inhabitant than from the product per employed person.
Dependence rate
One must therefore take account of the whole population, including the non—active persons who are dependent on the active population. The number of non—active persons (i.e. persons who are non—active although of working age, children, and old people) dependent on an active person is referred to as the dependence rate. It is influenced by the activity rate of persons aged between 14 and 64, and by the demographic structure of the region. Regional disparities in these two characteristics (cf. comments above) are usually fairly parallel. As a result, there are large variations in the dependence rate : in the South of Italy and in Dutch Limburg and the North-East of the Netherlands, every active person has more than two non—active dependents, but in Ile de France each active person has only one non—active dependent.
Product per inhabitant
In most cases the regional disparities in the dependence rate tally with those already noted in the product per employed person, and therefore simply intensify these divergences. As a result, the gross domestic product per inhabitant varies considerably, from an index of 200 for Hamburg to an index of 37 for Calabria; the poorest regions are in Southern Italy and Ireland.
The regions which are below the Community average can be divided into several different groups, according to the main factors responsible for this situation :
-
50— the regions in the South and West of France, and the North and South-East of Germany, which are still predominantly agricultural;
— the regions in the North-East of Italy where both of these factors play a part;
— all the regions of Great Britain, where the main reason appears to be low productivity;
— regions in Belgium such as Luxembourg, Hainaut and Limburg, where low productivity is combined with a low activity rate;
— Southern Italy and Ireland, which suffer from a combination of all these factors, together with a very high dependence rate in Southern Italy.
Income and consumption per inhabitant
In the countries for which figures are available, the range of disposable incomes per inhabitant appears to have narrowed more than the range of GDP per inhabitant. This illustrates the extent of income transfers between regions, and the role of these transfers in correcting inequalities of living standards.
For the most part, these disparities in income are reflected in
D E E U R O P Æ I S K E F Æ L L E S S K A B E R S S T A T I S T I S K ! K O N T O R
S T A T I S T I S C H E S A M T D E R E U R O P A I S C H E N G E M E I N S C H A F T E N
S T A T I S T I C A L O F F I C E O F T H E E U R O P E A N C O M M U N I T I E S
O F F I C E S T A T I S T I Q U E D E S C O M M U N A U T É S E U R O P É E N N E S
I S T I T U T O S T A T I S T I C O D E L L E C O M U N I T À E U R O P E E
B U R E A U V O O R D E S T A T I S T I E K D E R E U R O P E S E G E M E E N S C H A P P E N
Α. Dornonvill· d · la Cour Generaldirektør / Generaldirektor / Director-General Directeur général / Direttore generale / Directeur-generaal
Konsulent/Berater/Ad viaer/Coneelller/Coneigllere/Adviseur
Assistent/Assistent/ A s s i l t a n i / Assistent/Assistente/Assistant
D ¡rek tarer/Dirok tor on/D ¡ree t o r i / D i r o c t e u r e / D l r e t t o r l / Direct euren :
G . Bertaud Statistiske metoder, mlormation Stattstische Methoden, Informationswesen Statistical methods, information processing Méthodologie statistique, traitement de l'information Metodologia statistica, trattamento dell'informazione Methodologie van de statistiek, informatieverwerking
Almen statistik og nationalregnskab
Allgemeine Statistik und Volkswirtschaftliche Gesamtrechnung General statistics and national accounts
Statistiques générales et comptes nationaux Statistiche generali e conti nazionali Algemene statistiek en nationale rekeningen
Befolknings- og socialstatistik Bevölkerungs- und Sozialstatistik Demographical and social statistics Statistiques démographiques et sociales Statistiche demografiche e sociali Sociale en bevolkingsstatistiek
Landbrugs·, skovbrugs- og fiskenstatistik
Statistik der Landwirtschaft. Forstwirtschaft und Fischerei Agriculture, forests and fisheries statistics
Statistiques de l'agriculture, des forêts et de la pêche Statistiche dell'agricoltura, delle foreste e della pesca Landbouw-, bosbouw- en visserijstatistiek
H. Schumacher Industri- og miljøstatistik Industrie- und Umweltstatistik Industrial and environmental statistics Statistiques de l'industrie et de l'environnement Statistiche dell'industria e dell'ambiente industrie- en milieustatistiek
Handels-, transport- og servicestatistik Handels-. Transport- und Dienstleistungsstatistik Trade, transport and services statistics
S a l g s - o g abonnementskontorer · Vertriebsbüros · Sales Offices
Bureaux de vente ■ Uffici di vendita · Verkoopkantoren
Belgique - België
Moniteur belge Belgisch Staatsblad
Rue de Louvain 4 0 4 2 -Leuvensestraat 4 0 - 4 2 1 0 0 0 Bruxelles - 1 0 0 0 Brussel Tél. 5 1 2 0 0 2 6
CCP 0 0 0 - 2 0 0 5 5 0 2 - 2 7 Postrekening 0 0 0 - 2 0 0 5 5 0 2 2 7
Sousdépôts Agentschappen:
Librairie européenne - Europese Boekhandel
Rue de ta Loi 2 4 4 Wetstraat 2 4 4 1040 Bruxelles - 1 0 4 0 Brussel
CREDOC
Rue de la M o n t a g n e 3 4 Bte 1 1 -Bergstraat 34 - Bus 1 1 1000 Bruxelles 1 0 0 0 Brussel
F r a n c e
Service de vente en France des publica tions de:> Communautés européennes Journal officiel
2 6 . rue Desaix 7 5 7 3 2 Paris Cedex 15
Tél. (1) 5 7 8 6 1 3 9 - CCP Paris 2 3 - 9 6
I r e l a n d
Government Publications
Sales Office G.P.O. Arcade Dublin 1 or by post from
Stationery Office
Beggar's Bush Dublin 4 Tel. 68 84 33
N e d e r l a n d
Staatsdrukkerij en uitgeversbedrijf
Christoffel Plantijnstraat. s-Gravenhage Tel. (070) 81 4 5 1 1
Postgiro 42 5 3 0 0
U n i t e d K i n g d o m
HM Stationery Office
P.O. Box 5 6 9 London S E I 9 N H Tel. (01) 9 2 8 6 9 7 7 . ext. 3 6 5 National Giro Account 5 8 2 - 1 0 0 2
U n i t e d S t a t e s of A m e r i c a
European Community Information Service
2 1 0 0 M Street. N.W. Suite 7 0 7
W a s h i n g t o n , D C . 2 0 0 3 7 Tel. (202) 8 7 2 83 50
D a n m a r k
J. H. Schultz Boghandel
Møntergade 19 1116 København K Tel. 14 11 9 5 Girokonto 1 1 9 5
BR Deutschland
Verlag Bundesameiger
Breite Straße - Postfach 1 0 8 0 0 6 5 0 0 0 Köln 1
Tel. (02 21) 2 1 0 3 4 8 (Fernschreiber: Anzeiger Bonn 8 8 8 2 595)
Postscheckkonto 8 3 4 0 0 Köln
Libreria dello Stato
Piazza G. Verdi 10 0 0 1 9 8 Roma - Tel (6) 8 5 0 8 Telex 62008
CCP 1/2640
Agenzia
Via XX Settembre (Palazzo Ministero del tesoro) 0 0 1 8 7 Roma
G r a n d - D u c h é d e L u x e m b o u r g
Office des publications officielles des Communautés européennes
5. rue du Commerce
Boîte postale 1003 - Luxembourg Tél. 4 9 0 0 8 1 - CCP 1 9 1 9 0 - 8 1 Compte courant bancaire: BIL 8 - 1 0 9 / 6 0 0 3 / 3 0 0
S c h w e i z - S u i s s e - S v i z z e r a
Librairie Payot
6. rue Grenus 1211 Genève Tél. 3 1 8 9 50 CCP 1 2 - 2 3 6 Genève
S v e r i g e
Librairie CE. Fritze 2, Fredsgatan Stockholm 16
Postgiro 193. Bankgiro 7 3 / 4 0 1 5
España
Libreria MundiPrensa
Castellò 37 M a d r i d 1 Tel. 2 7 5 4 6 5 5
A n d r e l a n d e - A n d e r e L ä n d e r · O t h e r c o u n t r i e s · A u t r e s p a y s - A l t r i p a e s i ■ A n d e r e l a n d e n
Kontoret for De europæiske Fællesskabeis officielle Publikationer ■ Amt fur amtliche Veröffentlichungen der Europäischen Gemeinschaften ■ Office for Officisi Publications of the European Communities ■ Office des publications officielles des Communautés européennes ■ Ufficio delle pubblicazioni ufficiali delle Comunità europee ■ Bureau voor officiële publikaties der Europese Gemeenschappen
* *
KONTORET FOR DE EUROPÆISKE FÆLLESSKABERS OFFICIËLE PUBLIKATIONER AMT FUR AMTLICHE VERÖFFENTLICHUNGEN DER EUROPAISCHEN GEMEINSCHAFTEN OFFICE FOR OFFICIAL PUBLICATIONS OF THE EUROPEAN COMMUNITIES
OFFICE DES PUBLICATIONS OFFICIELLES DES C O M M U N A U T É S EUROPÉENNES UFFICIO DELLE PUBBLICAZIONI UFFICIALI DELLE C O M U N I T À EUROPEE BUREAU VOOR OFFICIËLE PUBLICATIES DER EUROPESE GEMEENSCHAPPEN
ISSN 0378-4207