DOI 10.1007/s10035-013-0476-y O R I G I NA L PA P E R
A linear model of elasto-plastic and adhesive contact deformation
Massih Pasha · Selasi Dogbe · Colin Hare · Ali Hassanpour · Mojtaba Ghadiri
Received: 6 November 2012 / Published online: 19 January 2014
© The Author(s) 2014. This article is published with open access at Springerlink.com
Abstract Rigorous non-linear models of elasto-plastic contact deformation are time-consuming in numerical cal-culations for the distinct element method (DEM) and quite often unnecessary to represent the actual contact deforma-tion of common particulate systems. In this work a simple linear elasto-plastic and adhesive contact model for spheri-cal particles is proposed. Plastic deformation of contacts dur-ing loaddur-ing and elastic unloaddur-ing, accompanied by adhesion are considered, for which the pull-off force increases with plastic deformation. Considering the collision of a spheri-cal cohesive body with a rigid flat target, the critispheri-cal stick-ing velocity and coefficient of restitution in the proposed model are found to be very similar to those of Thornton and Ning’s model. Sensitivity analyses of the model parameters such as plastic, elastic, plastic-adhesive stiffnesses and pull-off force on work of compaction are carried out. It is found that by increasing the ratio of elastic to plastic stiffness, the plastic component of the total work increases and the elastic component decreases. By increasing the interface energy, the plastic work increases, but the elastic work does not change. The model can be used to efficiently represent the force-displacement of a wide range of particles, thus enabling fast numerical simulations of particle assemblies by the DEM.
Keywords Distinct element model (DEM)·Contact force model·Cohesive powder·Plastic deformation·Coefficient of restitution·Normal impact·Adhesion
M. Pasha·S. Dogbe·C. Hare·A. Hassanpour·M. Ghadiri (
B
) Institute of Particle Science and Engineering,University of Leeds, Leeds LS2 9JT, UK e-mail: [email protected]
1 Introduction
α
f
αp
αcp
f
cpf
0k
p αk
e(
α-
αp)
k
c α [image:2.595.80.253.54.235.2]αmax
Fig. 1 Schematic diagram of force-overlap relationship in Luding’s
[20] model
the computational complexity of the models; however this comes at the expense of losing the accuracy of capturing the realistic behaviour. In the present work a model is proposed considering aspects of Thornton and Ning’s [18], Tomas’s [19], and Walton and Johnson’s [21] models. Sensitivity analyses of the proposed model parameters on bulk com-paction behaviour are also reported.
In the following an overview of the available linear mod-els reported in the literature for elasto-plastic and adhesive contact deformation is presented.
Luding’smodel[20]:
Figure1illustrates schematically the normal contact model of Luding [20] for elasto-plastic and adhesive contacts. In this model, the normal force will drop to a certain negative value,
f0, when two spheres come into contact due to van der Waals attractive forces [8–10]. On initial compression loading, the contact is considered to be plastically deforming; the contact force increases linearly with the overlapαat a ratekp(i.e. plastic stiffness) until an overlapαmax is reached (αmax is kept in memory as a history variable). During unloading the force drops on a line with the elastic stiffness (slope)ke. The force decreases to zero at overlapαp, which represents the plastic contact deformation. Reloading at any instant leads to an increase of the force along the same line with slopeke, until the previous maximum force is reached; ifαincreases fur-ther beyondαmax, the force again follows the line with plastic stiffness (slope)kpandαmaxhas to be adjusted accordingly. Unloading belowαp produces an adhesive force until the maximum tensile force, fcp, is reached at overlapαcp. Fur-ther unloading leads to a reduction in the attractive force on the adhesive branch with a negative “stiffness” (slope)
kc. The maximum tensile force in this model increases by having larger deformations, i.e. increasing αmax results in
a larger negative fcp. This is a linear simplification of the so-called adhesion limit as defined by Tomas [22,23]. Sim-ilarly, Thornton and Ning [18] modelled the pull-off force to overcome the adhesion based on the increase in radius of curvature of the contact area: the unloading path in Thornton and Ning’s model is considered to follow the JKR equation but with a larger radius of curvature due to plastic deforma-tion. Luding [20] considered an elastic stiffness,ke, which increased with the maximum overlap based on the work of Walton and Braun [14]. For overlaps greater thanα∗, elastic stiffness is equal tokˆe and for smaller overlaps the elastic stiffness is evaluated by:
ke=kp+
ˆ
ke−kp αmax
α∗ (1)
The plastic flow limit overlap, α∗, i.e. the overlap beyond which the elastic stiffness becomes independent of the max-imum overlap, was defined by:
α∗= kˆe ˆ
ke−kp
φf2R∗, (2)
wherekˆe is the maximum value of the elastic stiffness,φf is the dimensionless plasticity depth and R∗ is the reduced radius given by:
R∗=
1
R1 + 1
R2 −1
, (3)
where R1andR2are the radii of the spheres in contact. Luding’s model contains a shortcoming by which the behaviour of elasto-plastic and adhesive contacts is not real-istically simulated. Contacts “break” at zero overlap (α=0), regardless of loading or unloading history. This implies that plastic deformation has been ignored, which is unrealistic since plastic deformation is permanent and hence detach-ment must take place atα >0.
Waltonand Johnson’smodel[21]:
Fig. 2 Schematic force-overlap response according to Walton and
Johnsons’ model [21]
model, under compressive loading the contact is assumed to deform plastically with a linear stiffness ofkp. The contact unloading follows the line with slopekeuntil the unloading path intercepts with the locus of the pull-off force at fcp. Con-tact reloading before the unloading reaches the pull-off force
fcp follows the unloading path. Further unloading beyond this point follows a path with negative slopekce, until the contact breaks when the force reaches zero atαf p. A linear locus (dashed line) is considered for the pull-off force with a negative slope ofkcp. However if the contact is reloaded after unloading beyond the pull-off force (i.e. reloading on
kcebranch), the contact force is evaluated based on a stiffness whose response provides a line from the point of reloading toαp(see the two reloading responses in Fig.2denoted by grey dashed lines), from where further reloading follows the elastickeline.
2 The proposed contact model
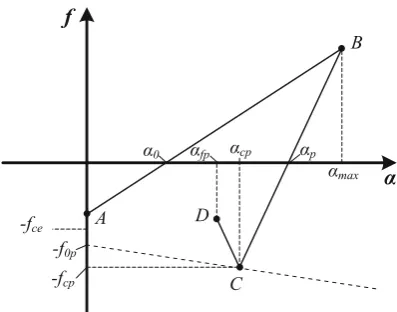
The proposed model is a linear elasto-plastic adhesive model with the detachment condition governed by the work of adhesion, and the normal force-overlap response shown in Fig.3. Similar to the models of Luding, Tomas and Thornton and Ning, the normal force drops to a certain negative value,
f0, when two spheres come into contact atα = 0 due to van der Waals attractive forces. The contact is assumed to be elastically deforming forα < αy. Forα ≥ αy the contact deformation is elasto-plastic until pointD. The initial elas-tic deformation is considered to be a linear version of JKR: the tensile force f0is equal to 8fce/9, where fceis the JKR elastic pull-off force (pointB) given by Eq. (4),
fce= − 3 2πR
∗Γ (4)
Fig. 3 Schematic diagram of the normal force-overlap relationship in
the proposed model
whereΓ is the interface energy. The contact is assumed to be elastically deforming with an elastic stiffness,ke, for line
BC, for which the contact force is given by Eq. (5),
f =keα+8
9fce (5)
Since the deformation is elastic, the unloading curve follows the same path on the BCline. Unloading beyond point B
is governed by a “stiffness” −ke. The contact breaks at a negative overlap,αf e, at pointAwith the contact force being 5fce/9.
On compressive loading beyond αy the contact reaches the yield stress and plastic deformation takes place which is governed by the plastic stiffness,kp, on lineCD.
f =kp
α−α0p (6)
The yielding force and deformation are given by Thornton [24] and Johnson [25]. Once the contact is unloaded from point D, the path lies on line from D to αp with elastic stiffnesske, as given by:
f =ke
α−αp, (7)
whereαpis the overlap at which the unloading force becomes zero. The unloading path continues until a maximum tensile force(fcp), known as the pull-off force, is reached (pointE). The calculation of fcpis provided in Sect.2.1. For unloading beyond the pull-off force (lineEF), a negative elastic stiff-ness,−ke, is considered. The governing equation for this part of contact force can be evaluated by Eq. (8),
f = −ke
[image:3.595.312.540.57.252.2]where αcp is the overlap at which the pull-off force is achieved. The contact is considered to break at an overlap which provides a force equivalent to 5fcp/9 similar to the JKR theory. Different from both previous models, deforma-tions expressed by Eq. (8) are reversible, i.e. reloading fol-lows the path of unloading, like for Eq. (7), and if reloading goes beyond pointD, the deformation is plastic and follows Eq. (6). If the two bodies come towards each other again after the contact is broken, the contact is considered to be established at an overlap slightly larger thanαcp (i.e.αc0) by analogy with JKR theory, considering the surfaces relax following detachment. At this point the contact force is equal to 8fcp/9. The increasing elastic stiffnesskedue to increased maximum overlap, as suggested by Walton and Braun [14] and implemented by Luding [20], is adopted for the simpli-fied model described later.
2.1 The load-dependent pull-off force
In order to account for the increase in the pull-off force due to plastic deformation (i.e. flattening of the contact area), the pull-off force is evaluated by applying an energy balance: the work of adhesion of the contacts is equated to ApΓ, where
Apis the contact area of the plastic deformation. The plastic deformation (overlap),αpd, is given by:
αpd =αp−αy, (9)
and the contact area can be estimated from the reduced radius of the sphere R∗ and the overlapαpd, hence the work of adhesion is,
|Wad| = Ap=π
2R∗αpd−α2pd
(10)
The work of adhesion is also the area under the unloading response fromαp toαf p (Fig.3), which can be derived to give (see Appendix I for the details of this derivation),
|Wad| = 137 162
fcp2 ke
(11)
By equating the right hand sides of Eqs. (10) and (11), and considering that the pull-off force is tensile, we get
fcp= −
162
137πR∗keαpd
2−αpd
R∗
(12)
as an expression for the pull-off force as a function ofαpd. However it is of interest to show the locus of the pull-off force, hence fcpis expressed in terms ofαcpin Fig.4for the case whereke=1,500 N/m,kp=210 N/m,Γ =0.02 J/m2 andR∗=2.45µm. The selection of these values is explained in Sect.3.
-25 -20 -15 -10 -5 0
0.0 0.1 0.2 0.3 0.4 0.5 0.6 0.7
fcp
(µ
N)
[image:4.595.310.541.51.193.2]cp (µm)
Fig. 4 Pull-off force as a function ofαcp
f
We
W
pW
adW
yW
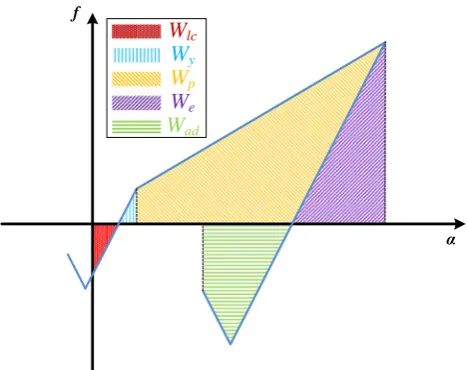
lcFig. 5 Schematic force-overlap response of the proposed model and
corresponding work of deformation
The magnitude of pull-off force increases with plastic deformation initially very rapidly and then more linearly, an observation which is also present in the elasto-plastic and adhesive models of Thornton and Ning [18], Tomas [19], Luding [20], and Walton and Johnson [21].αcp is directly related toαp, for which a similar functional relationship pre-vails.
2.2 Impact, rebound and critical sticking velocities
[image:4.595.308.542.238.423.2]work of adhesion, respectively. Considering the impact of a sphere against a large rigid body with a flat surface, the energy balance from the point where the contact is first made to where the velocity becomes zero is given by Ei,
Ei = 1 2mv
2
i =Wp+We+Wy− |Wlc| (13)
where vi is the impact velocity. The elastic strain energy,
We, is responsible for the rebound. There exists a critical balance between We and Wad which determines whether the sphere sticks or rebounds. The critical sticking veloc-ity, vs, is the maximum impact velocity at which the contact does not break, where the energy of adhesion cannot be overcome by the elastic strain energy. Hence,
We = |Wad| →vi =vs (14)
For impact velocities larger than vs, the unloading leads to detachment of the contact. The rebound velocity, vr, can be derived based on the following energy balance,
Er = 1 2mv
2
r =We− |Wad| (15)
where Er is the rebound kinetic energy. The rebound velocity derived from Eq. (15) is given by Eq. (16),
vr = fmax
αmax−αp
m −
137 81
fcp2
mke
1/2
(16)
and Eq. (13) can be re-arranged for an expression in terms of vi (Eq. 17), based on which the coefficient of restitution, i.e. the ratio of vr to vi can be calculated. Details of these derivations are provided in Appendix II.
vi = fmax+fy αmax−αy
+αy−α0fy−α0|f0|
m
1/2
(17)
Figures6, 7 and8 show the coefficient of restitution as a function of impact velocity for different values of the inter-face energy, elastic and plastic stiffnesses, respectively. In all cases the fixed properties are as follows:ke = 1,500 N/m,
kp = 210 N/m, Γ = 0.02 J/m2, and R = 2.45µm. The selection of these values is explained in Sect.4. The criti-cal sticking velocities are given in captions of Figs.6,7and 8.
The coefficient of restitution reaches an asymptote at very high impact velocities. The asymptotic value is a function of contact properties. Increasing the interface energy results in a reduction of the coefficient of restitution since the cohesion is increased. Increasing the elastic stiffness also reduces the coefficient of restitution, since the plastic work is increased.
0.0 0.1 0.2 0.3 0.4
0 0 1 0
1 1
1 . 0
Coefficient of
restit
u
tion (-)
Impact velocity (m/s) = 0.02 J/m2
= 0.1 J/m2 = 0.2 J/m2 = 0.5 J/m2
Fig. 6 Coefficient of restitution as a function of impact velocity for
different interface energies:ke=1,500 N/m,kp=210 N/m. The
crit-ical sticking velocity for the four data sets are 0.451, 2.228, 4.387 and 10.485 m/s
0.0 0.2 0.4 0.6 0.8
1.0
0.01 0.1 1 10 100
Coefficient of
restit
u
tion (-)
Impact velocity (m/s) ke = 300 N/m
ke = 500 N/m ke = 1100 N/m ke = 1500 N/m
Fig. 7 Coefficient of restitution as a function of impact velocity for
different elastic stiffnesses:kp=210 N/m,Γ =0.02 J/m2. The
criti-cal sticking velocity for the four data sets are 0.031, 0.102, 0.317 and 0.451 m/s
0.0 0.2 0.4 0.6 0.8
1.0
0.001 0.01 0.1 1 10 100
Coefficient of
restit
u
tion (-)
Impact velocity (m/s) kp = 100 N/m
kp = 210 N/m kp = 500 N/m kp = 1200 N/m
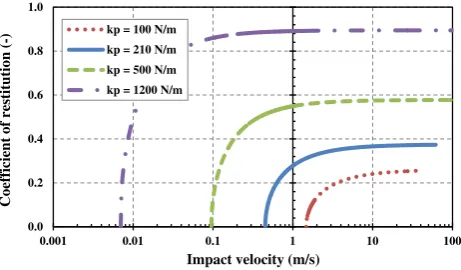
Fig. 8 Coefficient of restitution as a function of impact velocity for
different plastic stiffnesses:ke = 1,500 N/m,Γ = 0.02 J/m2. The
critical sticking velocity for the four data sets are 0.007, 0.095, 0.451 and 1.471 m/s
[image:5.595.308.543.56.190.2] [image:5.595.310.541.467.602.2]2.3 Linearization of the locus of pull-off force
Figure4showed that the locus of pull-off force for different extents of plastic deformation is governed by the specific sur-face energy and the flattened contact area. The locus is not linear at very small deformations, yet becomes linear towards large deformations, see Sect.2.1; for more details see refer-ence [26]. In an attempt to propose a more computationally cost-effective model, the locus of the pull-off force is consid-ered to be only the linear part of the locus. Hence the pull-off force can be approximated as,
fcp= −kcpαcp+ f0p (18)
wherekcp is the slope of the linear fit and f0pis the inter-section of the fit with the force-axis. The part of the pull-off force locus for large deformations (larger than 6 % of particle radius) and the linear fits for different interface energies are shown in Fig.9.
Furthermore, in a number of cases the initial elastic defor-mation may be small as compared to the total defordefor-mation, as it is the case for materials with notable plastic deformation in which case the model can be simplified further. In real con-tacts, the presence of surface asperities always leads to plastic deformations right from the beginning of loading. If the ini-tial elastic deformation is ignored, the force-overlap response can be simplified to the model that is shown schematically in Fig.10. Once the contact is established atα=0, the contact force drops to a tensile force which is equivalent to 8fce/9, where fce is the JKR pull-off force given by Eq. (4). The contact is plastically deformed on the lineα0toBwith force
f =kpα−8
9 fce (19)
-120 -100 -80 -60 -40 -20 0
0.0 0.1 0.2 0.3 0.4 0.5 0.6 0.7
fcp
(µ
N)
cp (µm)
= 0.5 J/m2 = 0.2 J/m2 = 0.1 J/m2 = 0.02 J/m2
Fig. 9 Pull-off force as a function ofαcpfor different interface
ener-gies:ke=1,500 N/m,kp=210 N/m, andR∗=2.45µm. Thedashed
linesare the fitted lines to the linear part of the loci given by Eq.18(i.e. deformation larger than 6 % of the particle radius)
Fig. 10 Schematic force-overlap response of the simplified model
The unloading curve lies on a line with the elastic stiffness
ke(lineBC), so that
f =ke
α−αp (20)
The unloading path continues until the pull-off force (fcp) is reached at
αcp= keαp− f0p
ke+kcp
(21)
For unloading beyond the pull-off force (lineCD), a negative elastic stiffness,−ke, is considered, leading to the contact force
f = −ke
α−2αcp+αp (22)
The contact is considered to break at an overlap which pro-vides a force equivalent to 5fcp/9, i.e. similar to the JKR the-ory. If the two bodies come towards each other again after the contact is broken, the contact is considered to be established at an overlap slightly larger thanαcp(i.e.αc0) in line with the previous model, see Fig.3, representing surface relaxation following detachment. At this point the contact force is equal to 8fcp/9.
3 Comparison of the proposed model with that of Thornton and Ning [18]
Ning [3] simulated the impact of an ammonium fluorescein particle to a silicon target using Thornton and Ning’s [18] model. The parameters in these simulations are summarized in Table1.
[image:6.595.325.524.53.209.2] [image:6.595.52.287.474.664.2]Table 1 Properties of ammonium fluorescein particle and silicon wall
used in Ning’s [3] simulations
Property Particle Wall
Radius (µm) 2.45 –
Density(kg/m3) 1,350 1,350
Elastic modulus (GPa) 1.2 182
Poisson’s ratio (−) 0.3 0.3
Interface energy(J/m2) 0.2 Contact yield pressure (MPa) 35.3
-10 0 10 20 30 40 50
0 50 100 150 200 250
Norm
a
l cont
a
ct force
(µ
N)
Overlap (nm)
v = 2 m/s
v = 5 m/s
[image:7.595.52.290.75.361.2]v = 10 m/s
Fig. 11 Normal force-overlap responses of impact of an ammonium
fluorescein particle to a silicon target using Thornton and Ning’s [18] model with three different impact velocities [3]. The data are obtained by digitizing the results of Thornton and Ning
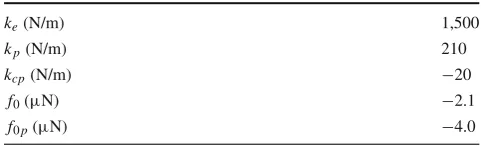
Table 2 Model parameters obtained by determining the slopes of the
responses in Fig.11
ke(N/m) 1,500
kp(N/m) 210
kcp(N/m) −20
f0(µN) −2.1
f0p(µN) −4.0
the elastic, plastic and adhesive stiffnesses are evaluated by determining the slopes of the responses from Fig.11. The values are summarized in Table2.
It is noteworthy that the elastic stiffness,ke, in Table2is the average value of the initial unloading slopes in Fig.11. The proposed simplified model with the linear pull-off force locus (shown in Fig. 9) was implemented as a subroutine for EDEM software provided by DEM-Solutions, Edin-burgh, UK. Using the parameters in Table2, the impact of a 2.45µm radius sphere on a flat wall at three impact veloc-ities of 2, 5 and 10 m/s was simulated, with no additional viscous/velocity dependent contact damping. The responses using the proposed model are shown in Fig.12.
-10 0 10 20 30 40 50
0 50 100 150 200 250
Norm
a
l cont
a
ct force
(µ
N)
Overlap (nm) v = 2 m/s
v = 5 m/s
[image:7.595.309.542.252.389.2]v = 10 m /s
Fig. 12 Normal force-overlap responses of impact of a 2.45µm radius
particle to a wall with the parameters in Table2using the simplified proposed model for three different impact velocities
0 0.1 0.2 0.3 0.4 0.5 0.6 0.7 0.8
0.9 1
0 0 1 0
1 1
e (-)
Impact velocity (m/s)
Thornton and Ning
Proposed Model
[image:7.595.49.290.456.529.2]Equation (15)
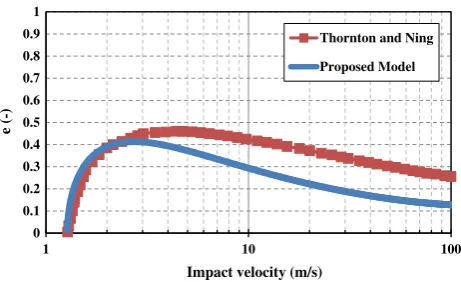
Fig. 13 Coefficient of restitution as a function of impact velocity using
different contact models for a 2.45µm radius ammonium fluorescein particle impacting to a silicon target. Thedashed lineis obtained ana-lytically by applying an energy balance as described in Sect. 3.2 and the data points with the marker(diamond)are from EDEMsoftware simulations
Comparing Figs.11and12a good agreement is observed between the simplified proposed model and that of Thornton and Ning in terms of the maximum overlap and permanent plastic deformation at different impact velocities.
In order to provide a more in depth comparison, the coef-ficient of restitution as a function of impact velocity was calculated from the impact and rebound velocities obtained from the numerical simulations data using EDEMsoftware as well as from the energy balance given by Eq. (15). The results for the 2.45µm radius ammonium fluorescein particle impacting at the silicon target are shown in Fig.13for these models. For the simplified proposed model, the data points are from the simulation data and the continuous curves are from the energy balance approach. For the Thornton and Ning model [18], the data are taken directly from Ning [3].
simulation results of the proposed model lie on the analytical curves, it can be concluded that the energy balance consider-ations in Sect.2.2are correct. The critical sticking velocity in the proposed model is very similar to that of Thornton and Ning (∼1.6 m/s). With the proposed model, the coefficient of restitution increases initially, however it reaches an asymp-totic value of∼0.38 for impact velocities larger than about 10 m/s. The reason for this is attributed to a constant elastic stiffness, for which the ratio of elastic work(We)to plastic work(Wp)is always constant. At very high impact velocities, the elastic strain energy becomes very large relative to the work of adhesion(Wad), so the elasto-plastic process
dom-inates since the plastic-cohesive stiffness,kcp, is normally smaller than the plastic stiffness,kp. Hence the asymptote has a value of (kp/ke)1/2[14]. This asymptotic behaviour is not in line with the experimental evidence [27,28], where it is shown that at sufficiently high velocity the impact energy far exceeds the adhesion energy and the coefficient of resti-tution is primarily a function of the energy loss due to plastic deformation.
In order to account for a decreasing coefficient of resti-tution at high impact velocities, the elastic unloading stiff-ness must be made load-dependent. Now, considering that the stiffness increases proportionally with the contact area, which in turn is a function of the maximum overlap,αmax, the stiffness,ke, is given by Eq. (23),
ke ∝r2=2R∗αmax−α2max (23)
whereris the contact radius. Assuming the maximum elastic stiffness,kˆe, is at an overlap ofR∗, then
ke =
r R∗
2 ˆ
ke (24)
For very small deformations, Eq. (24) gives elastic stiffness values which can be smaller than the plastic stiffness. In order to avoid such values forke, following the approach of Luding [20] as per Eq (1), Eq (24) can be modified as follows,
ke =kp+
r R∗
2 ˆ
ke−kp
(25)
The elastic stiffness can be evaluated by finding the tangent to the Hertz response of the contacts in Fig.11and finding the best match to the Hertz curve for initial stage of unloading. For the values given in Tables1 and2, a maximum elastic stiffnesskˆeof 13,000 N/m was calculated using Eq. (25).
The coefficient of restitution as a function of impact velocity is shown in Fig.14 for the proposed model with a load-dependent elastic unloading stiffness. This response is obtained by the same energy balance approach as described in Sect.2.2. The prediction from Thornton and Ning’s model is also given for comparison.
0 0.1 0.2 0.3 0.4 0.5 0.6 0.7 0.8
0.9 1
0 0 1 0
1 1
e (-)
Impact velocity (m/s)
Thornton and Ning
[image:8.595.310.541.54.195.2]Proposed Model
Fig. 14 Coefficient of restitution as a function of impact velocity using
the proposed model with a load-dependent unloading stiffness and Thornton and Ning model
As expected a decreasing coefficient of restitution is observed at high impact velocities, although showing a devi-ation form Thornton and Ning’s model.
New experimental data are needed to check the validity of the model’s predictions, as a larger data set than that avail-able for ammonium fluorescein particles would provide more certainty.
There are clear differences between this model and those of Walton and Johnson [21] and Luding [20] in (1) the point of contact detachment, (2) reloading on the adhesive branch and (3) most importantly in the work of adhesion. The latter strongly influences the sticking velocity, as it depends on the balance between elastic strain energy and work of adhesion. Hence a rigorous test of these models is to experimentally verify the sticking velocity of materials, whose model para-meters have been independently characterised.
4 Sensitivity analysis of the proposed model parameters
A set of simulations were carried out in order to investigate the effects of the model parameters on the elastic and plastic components of work during loading and unloading of bulk compression. The tangential stiffness,kt, was equated to the elastic stiffness,ke, throughout the simulations. The model with a linear pull-off locus and with a constant unloading stiffness was used in these simulations. The model parame-ters for the particles are summarized in Table3.
The sensitivity of bulk compression response to the plastic stiffness(kp)was evaluated with two fixed values of elastic stiffness,ke, (1,000 and 5,000 N/m) in order to achieve the same stiffness ratio(ke/kp)with different plastic stiffnesses. This facilitates the sensitivity analysis of stiffness ratio as well as sensitivity of elastic and plastic stiffnesses. The walls were considered to be elastic with zero adhesion (i.e. f01 =
Table 3 Model parameter
values used in the simulations Parameter varied kp(kN/m) ke(kN/m) kcp(kN/m) Γ (J/m
2)
ke 10 50, 100, 500, 1,000 0 0
kp 10, 50, 100, 250, 500 1,000 0 0
kp 50, 100, 500, 1,000, 2,500 5,000 0 0
kp=ke 100 100 0 0
Γ 100 1,000 5 0.05, 0.1, 1, 2, 5
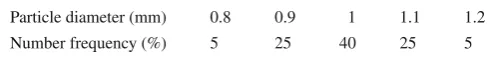
Table 4 Size distribution of the generated particles
Particle diameter (mm) 0.8 0.9 1 1.1 1.2
Number frequency (%) 5 25 40 25 5
a mean diameter of 1 mm and a normal size distribution (as shown in Table4) were generated inside a cylindrical die of 12 mm diameter. This number of particles provided a bed height of approximately 36 mm. The density of the particles was set to be 1,000 kg/m3.
The time-step is calculated based on a mass-spring system as
t=0.2tcr i t =0.2
m∗
kcr i t∗ (26)
wheretcr i tis the critical time-step for a mass-spring system,
m∗=msmallest/2 is the equivalent mass of the smallest par-ticle, andk∗cr i t=ksmallest/2 is the largest equivalent stiffness in the system. The coefficient of sliding friction was 0.25 for both the particle–particle and particle–wall contacts. The compression was simulated at a strain rate of 0.28 s−1. In order to define the dynamics of the process, the dimension-less shear strain rate,γ˙, of Tardos et al. [29] is evaluated using Eq. (27),
˙ γ =γ
dp
g 1/2
(27)
whereγis the shear strain rate,dpis the mean particle diam-eter andg is the gravitational acceleration. The strain rate of 0.28 s−1 provides a dimensionless shear strain rate of ∼0.003. It is shown by Tardos et al. [29] that for dimension-less shear strain rates of<0.15, the process is quasi-static, therefore the inertial effects on the stresses throughout the bulk are negligible. The assembly was compressed by mov-ing the top platen until a bulk strain of 11 % (for non-cohesive cases) or a solid fraction of 0.58 (for cohesive cases) was achieved, after which the platen was unloaded with the same speed as the compression. The non-cohesive simulations all had very similar initial solid fractions and applying the same amount of strain produced similar final solid fractions. In
0 20 40 60
80 100 120 140 160 180 200
0 0.5 1 1.5 2 2.5 3
F
orce (N)
Displacement (mm)
Plastic work
Elastic work
Fig. 15 Typical loading–unloading curve of compaction (kp =
10 kN/m andke=50 kN/m)
contrast, the cohesive simulations provided different initial packing fractions since the cohesion was introduced prior to generation of particles, therefore the compression simula-tions were not strain-controlled and were run to the same final solid fractions. Figure15shows a typical force-displacement curve of the top platen during the bulk compression using EDEMsoftware.
The plastic work (i.e. irrecoverable work) on loading is calculated as the closed area underneath the curve (the green shaded area in Fig. 15). The elastic work (i.e. recoverable work) is calculated as the area underneath the unloading curve (the red hatched area in Fig.15). The total input work is the addition of the plastic and elastic work components. The normalized elastic and plastic work components are defined as the elastic and plastic work, respectively, divided by the input work. Figure16shows the normalized elastic and plas-tic work components as a function of stiffness ratio,ke/kp, for all the cohesionless cases (first 4 rows of Table3).
[image:9.595.46.291.196.225.2]0 0.2 0.4 0.6 0.8
1
0 0 1 0
1 1
Norm
a
liz
e
d
work (-)
ke/kp(-)
[image:10.595.308.544.56.193.2]Elastic Plastic
Fig. 16 Normalized work as a function of stiffness ratio for all the
cohesionless cases
0 2 4 6
8
10 12 14
0 1 2 3 4 5 6
W
ork (mJ)
(J/m2)
Plastic
Elastic
0.04 0.044 0.048
0.052 0.056
0 1 2 3 4 5 6
[image:10.595.55.286.57.194.2]Elastic
Fig. 17 Elastic and plastic work components as a function ofΓ(kp=
100 (kN/m),ke=1,000 (kN/m),kcp= −5 kN/m)
either the plastic stiffness is decreased or the elastic stiffness is increased. If the plastic stiffness is decreased while the elastic stiffness is kept constant (softer particles), more work is expended in deforming contacts to reach the same force. This leads to an increase of the total work, while the elastic work remains the same. Therefore normalized elastic work decreases and normalized plastic work increases accord-ingly. In the case where the elastic stiffness is increased while plastic work is kept constant, the total input work does not change, but the fraction of elastic work decreases. This leads to a decrease in the normalized elastic work and con-sequently normalized plastic work increases. It can also be seen from Fig.16that there exists a limit for the stiffness ratio (ke/kp≈20) beyond which almost all of the work input into the system is used in plastic deformation.
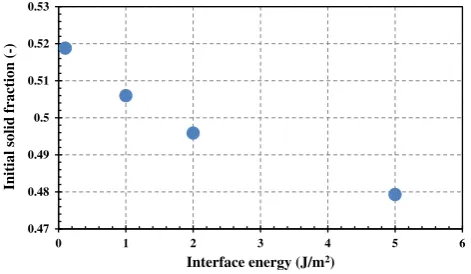
Figure17shows the plastic and elastic works as a function of increasing the interface energy. By increasing the interface energy, the plastic work increases; however the elastic work is very small for the range ofΓ investigated here and it does not change significantly with the interface energy. This obser-vation is attributed to the differences in the initial packing of the powder beds due to cohesion. This is shown in Fig.18as a function of the interface energy. As it can be seen, the ini-tial solid fraction decreases with increasing interface energy. Therefore in order to get to the solid fraction of 0.58, more
0.47 0.48
0.49 0.5 0.51 0.52 0.53
0 1 2 3 4 5 6
Initi
a
l soli
d
fr
a
ction (-)
Interface energy (J/m2)
Fig. 18 Initial solid fraction as a function ofΓ (kp =100(kN/m), ke=1,000(kN/m),kcp= −5 kN/m)
cohesive beds will undergo higher strains, i.e. increasing the total input work.
5 Conclusions
A new linear elasto-plastic and adhesive contact model for spherical particles has been proposed based on the models of Luding [20] and Walton and Johnson [21] and consider-ing aspects of Thornton and Nconsider-ing’s [18] and Tomas’s [19] contact models. Plastic deformation of contacts during load-ing and pure elastic unloadload-ing, accompanied by adhesion are considered, for which the pull-off force increases with plastic deformation and for which the detachment is gov-erned by the work of adhesion. Considering the collision of an adhesive spherical body with a rigid flat target, the critical impact velocity above which rebound occurs, as predicted by the proposed model, is found to be very similar to that of Thornton and Ning’s model. This agreement is improved by considering a load-dependent unloading stiffness.
Sensitivity analyses of the model parameters on work of compaction reveal that by increasing the stiffness ratio (ke/kp) the normalized plastic work increases and the nor-malized elastic work decreases. By increasing the interface energy, the plastic work increases, however the elastic work does not change notably. This highlights the flexibility of the model in representing the mechanical behaviour of a wide range of particulate materials. The linear nature of the model leads to time efficient simulations, whilst still capturing the complex material behaviour.
Acknowledgments The financial support of the Engineering and Physical Sciences Research Council, UK, through the Grant EP/G013047 is gratefully acknowledged. The authors are also grateful to the construc-tive critical comments of Professor Stefan Luding and the reviewers.
[image:10.595.55.287.232.361.2]Appendix I: Derivation of work of adhesion
The work of adhesion is the negative area underneath the unloading curve (see Fig.3), which consists of a triangle (with area of|Wc1|) and a trapezoid (with area of |Wc2|), hence,
|Wad| = |Wc1| + |Wc2| (28)
The triangle area|Wc1|is,
|Wc1| = 1 2
αp−αcp fcp, (29)
whereαcpcan be derived as follows,
@αcp: −fcp=ke
αcp−αp
⇒αcp =αp−fcp
ke
(30)
Substituting Eq. (30) into (29) gives,
|Wc1| = 1
2 αp−αp+
fcp
ke
fcp
⇒ |Wc1| = 1 2
fcp2
ke
(31)
The trapezoid area|Wc2|is,
|Wc2| = 1 2
αcp−αf p fcp+ 5 9fcp
⇒ |Wc2| = 7
9fcpαcp−αf p
(32)
Substituting Eq. (30) into (32) gives,
|Wc2| = 7
9fcp αp−
fcp
ke −αf p
(33)
αf pis derived as follows,
@αf p : −ke
αf p−2αcp+αp
= −5 9fcp
⇒αf p=2αcp−αp+ 5 9
fcp
ke
(34)
Substituting Eq. (30) into (34) gives,
αf p = 2 αp− fcp
ke
−αp+5 9
fcp
ke
⇒αf p =αp− 13
9
fcp
ke
(35)
Substituting Eq. (35) into (33) gives,
|Wc2| = 7
9fcpαp− 7 9
fcp2
ke −
7 9fcp
× αp−13 9
fcp
ke
⇒ |Wc2| = 28 81
fcp2
ke
(36)
Substituting Eqs. (31) and (36) into (28) gives,
|Wad|= 1 2
fcp2
ke +
28 81
fcp2
ke ⇒ |
Wad|= 137 162
fcp2
ke
(37)
Appendix II: Derivation of impact and rebound velocities
The force-overlap response of the proposed model is shown schematically in Fig.19. Different areas under the response lines, corresponding to different energies, are shaded and coloured.Wlc,Wy,Wp,WeandWadcorrespond to the initial loading adhesive work, elastic compressive work until the yield point, plastic work, elastic unloading work and work of adhesion, respectively.
The equations of these energies are derived as follows,
Wlc:
|Wlc| = 1
2α0|f0| (38)
Wy:
Wy= 1 2
αy−α0 fy (39)
We:
We= 1 2fmax
αmax−αp (40)
Wp consists of a trapezoid with area ofWp1and a triangle with area ofWp2:
Wp=Wp1+Wp2 (41)
The trapezoid area is,
Wp1= 1 2
fy+ fp αp−αy (42) α f We Wp Wad Wy Wlc
α0 αfpαcp
αp αmax
-|fcp|
-| f0|
fy
αy
fp
[image:11.595.44.547.95.713.2]fmax
Fig. 19 Schematic force-overlap response of the proposed model and
The triangle area is,
⇒Wp2= 1 2fp
αmax−αp (43)
Substituting Eqs. (42) and (43) in (41) gives,
Wp= 1 2
fy+ fp αp−αy
+1 2fp
αmax−αp (44)
Wadis given by Eq. (37).
Considering the impact of a sphere against a large rigid body with a flat surface, the energy balance from the point where the contact is first made to where the velocity becomes zero is given byEi,
Ei = 1 2mv
2
i =Wp+We+Wy− |Wlc| (45)
wherevi is the impact velocity. Substituting Eqs. (38)–(41) into (45) gives,
1 2mv
2 i =
1 2
fmax+ fy αmax−αy
+1 2
αy−α0fy
−1
2α0|f0| ⇒vi
= fmax+fy αmax−αy
+αy−α0 fy−α0|f0|
m
1/2
(46)
For impact velocities larger than the critical sticking veloc-ity, the unloading leads to detachment of the contact. The rebound velocity,vr, can be derived based on the following energy balance,
Er = 1 2mv
2
r =We− |Wad| (47)
whereEris the rebound kinetic energy. Substituting Eqs. (40) and (37) into (47) gives,
1 2mv
2 r =
1 2 fmax
αmax−αp−137 162
fcp2
ke
⇒vr = fmax
αmax−αp
m −
137 81
fcp2
mke 1/2
(48)
References
1. Cundall, P.A., Strack, O.D.L.: A discrete numerical model for gran-ular assemblies. Geotechnique 29, 47–65 (1979)
2. Zhu, H.P., Zhou, Z.Y., Yang, R.Y., Yu, A.B.: Discrete particle sim-ulation of particulate systems: theoretical developments. Chem. Eng. Sci. 62, 3378–3396 (2007)
3. Ning, Z.: Elasto-Plastic Impact of Fine Particles and Fragmen-tation of Small Agglomerates. PhD Thesis, Aston University (1995)
4. Hertz, H.: Über die Berührung fester elastischer Körper. Jour-nal für die reine und angewandte Mathematik 92, 156–171 (1882)
5. Di Renzo, A., Di Maio, F.P.: Comparison of contact-force models for the simulation of collisions in DEM-based granular flow codes. Chem. Eng. Sci. 59, 525–541 (2004)
6. Thornton, C., Cummins, S.J., Cleary, P.W.: An investigation of the comparative behaviour of alternative contact force models during elastic collisions. Powder Technol. 210, 189–197 (2011) 7. Thornton, C., Yin, K.K.: Impact of elastic spheres with and without
adhesion. Powder Technol. 65, 153–166 (1991)
8. Johnson, K.L., Kendall, K., Roberts, A.D.: Surface energy and the contact of elastic solids. Proc. R Soc. A 324, 301–313 (1971) 9. Krupp, H.: Particle adhesion theory and experiment. Adv. Colloid
Interface Sci. 1, 111–239 (1967)
10. Derjaguin, B.V., Muller, V.M., Toporov, Y.P.: Effect of contact deformation on the adhesion of particles. J. Colloid Interface Sci.
53, 314–326 (1975)
11. Yen, K.Z.Y., Chaki, T.K.: A dynamic simulation of particle rearrangement in powder packings with realistic interactions. J. Appl. Phys. 71, 3164–3173 (1992)
12. Yang, R.Y., Zou, R.P., Yu, A.B.: Computer simulation of the pack-ing of fine particles. Phys. Rev. E 62, 3900–3908 (2000) 13. Israelachvili, J.N.: Intermolecular and Surface Forces. Academic
Press, London (1991)
14. Walton, O.R., Braun, R.L.: Viscosity, granular-temperature, and stress calculations for shearing assemblies of inelastic, frictional disks. J. Rheol. 30, 949–980 (1986)
15. Thornton, C., Cummins, S.J., Cleary, P.W.: An investigation of the comparative behaviour of alternative contact force models during inelastic collisions. Powder Technol. 233, 30–46 (2013)
16. Thornton, C.: Coefficient of restitution for collinear collisions of elastic perfectly plastic spheres. ASME J. Appl. Mech. 64, 383–386 (1997)
17. Vu-Quoc, L., Zhang, X.: An elastoplastic contact force– displacement model in the normal direction, displacement-driven version. Proc. R Soc. Lond. Ser. A Math. Phys. Eng. Sci. 455, 4013–4044 (1999)
18. Thornton, C., Ning, Z.: A theoretical model for the stick/bounce behaviour of adhesive elastic–plastic spheres. Powder Technol. 99, 154–162 (1998)
19. Tomas, J.: Fundamentals of cohesive powder consolidation and flow. Granul. Matter 6, 75–86 (2004)
20. Luding, S.: Cohesive, frictional powders: contact models for ten-sion. Granul. Matter 10, 235–246 (2008)
21. Walton, O.R., Johnson, S.M.: Simulating the effects of interparticle cohesion in micron-scale powders. AIP Conf. Proc. 1145, 897–900 (2009)
22. Tomas, J.: Adhesion of ultrafine particles—a micromechanical approach. Chem. Eng. Sci. 62, 1997–2010 (2007)
23. Tomas, J.: Adhesion of ultrafine particles–energy absorption at con-tact. Chem. Eng. Sci. 62, 5925–5939 (2007)
24. Thornton, C.: Coefficient of restitution for collinear collisions of elastic-perfectly plastic spheres. J. Appl. Mech. Trans. ASME 64, 383–386 (1997)
25. Johnson, K.L.: Contact Mechanics. Cambridge University Press, Cambridge (1985)
26. Pasha, M.: Modelling of Flowability Measurement of Cohesive Powders Using Small Quantities. PhD Thesis, The University of Leeds (2013)
27. Wall, S., John, W., Wang, H., Goren, S.L.: Measurements of kinetic energy loss for particles impacting surfaces. Aerosol Sci. Technol.
12, 926–946 (1990)
28. Kharaz, A.H., Gorham, D.A.: A study of the restitution coefficient in elastic-plastic impact. Philos. Mag. Lett. 80, 549–559 (2000) 29. Tardos, G.I., McNamara, S., Talu, I.: Slow and intermediate flow of
a frictional bulk powder in the Couette geometry. Powder Technol.
![Fig. 1 Schematic diagram of force-overlap relationship in Luding’s[20] model](https://thumb-us.123doks.com/thumbv2/123dok_us/7954632.197752/2.595.80.253.54.235/fig-schematic-diagram-force-overlap-relationship-luding-model.webp)
![Fig. 2 Schematic force-overlap response according to Walton andJohnsons’ model [21]](https://thumb-us.123doks.com/thumbv2/123dok_us/7954632.197752/3.595.312.540.57.252/schematic-force-overlap-response-according-walton-andjohnsons-model.webp)

![Bulletin of the European Communities [Index to] Contents 1978 (11th year)](data:image/gif;base64,R0lGODlhAQABAIAAAP///wAAACH5BAEAAAAALAAAAAABAAEAAAICRAEAOw==)