promoting access to White Rose research papers
White Rose Research Online
eprints@whiterose.ac.uk
Universities of Leeds, Sheffield and York
http://eprints.whiterose.ac.uk/
This is the author’s version of an article published in
Physical Review E:
Statistical, Nonlinear, and Soft Matter Physics
White Rose Research Online URL for this paper:
http://eprints.whiterose.ac.uk/id/eprint/75529
Published article:
Das, C, Sheikh, KH, Olmsted, PD and Connell, SD (2010) Nanoscale mechanical
probing of supported lipid bilayers with atomic force microscopy. Physical Review
E: Statistical, Nonlinear, and Soft Matter Physics, 82 (4). ISSN 1539-3755
arXiv:1006.3937v2 [physics.bio-ph] 12 Oct 2010
microscopy
Chinmay Das,1, 2,∗ Khizar H. Sheikh,1, 3 Peter D. Olmsted,1,† and Simon D. Connell1
1
School of Physics and Astronomy, University of Leeds, Leeds LS2 9JT, United Kingdom 2
Unilever R &D, Port Sunlight, Wirral, CH63 3JW, United Kingdom 3
UCD Conway institute for Biomolecular and Biomedical Research, Dublin, Ireland
(Dated: October 14, 2010)
We present theory and experiments for the force-distance curve F(z0) of an atomic force
mi-croscope (AFM) tip (radius R) indenting a supported fluid bilayer (thickness 2d). For realistic conditions the force is dominated by the area compressibility modulusκAof the bilayer, and, to an
excellent approximation, given byF =πκARz02/(2d−z0) 2
. The experimental AFM force curves from coexisting liquid ordered and liquid disordered domains in 3-component lipid bilayers are well-described by our model, and provides κA in agreement with literature values. The liquid ordered
phase has a yield-like response that we model as due to the breaking of hydrogen bonds.
PACS numbers: 87.16.D-, 87.16.dm, 87.80.Ek, 68.37.Ps
I. INTRODUCTION
Atomic Force Microscopy (AFM) [1] has become a standard tool for imaging surfaces at high resolution and probing local mechanical properties [2]. Force-distance curves for indentation of AFM tips have been used to characterize the mechanical properties of biological mem-branes [3–5], and the usual approach is to approximate the bilayer as an elastic solid undergoing a Hertzian con-tact [6–8]. However, at physiological conditions most bio-logical membranes are in a fluid bilayer phase [9], whose free energy is described by a bending modulus κ and the area compressibility modulus κA. These are exper-imentally accessible through, for example, micropipette aspiration experiments [10], which give the average value of the elastic moduli over the whole vesicle. However, biological membranes often have different local composi-tions, and thus different local mechanical properties and physiological functions.
Despite the growing use of AFM to study lipid bilay-ers, the flexibility of using it to measure local mechanical properties has not been fully exploited. An AFM tip can bend a freely suspended membrane, and compress a supported membrane. In recent work, Steltenkamp et al. [11] showed how to extract the bending modulus of
lipid bilayers from AFM force-distance curves for bilay-ers deposited over well defined sized holes (indentation of ‘nanodrums’), in which they could safely ignore area com-pression due to the lack of a supported surface. Another issue neglected in previous AFM studies is the double leaflet form of lipid bilayers, which is known to influence the dynamics of fluctuations [12]. Since an AFM tip in-duces an asymmetric response in a supported bilayer [13], the distinction between the two leaflets will be important
∗Electronic address: c.das@leeds.ac.uk
†Electronic address: p.d.olmsted@leeds.ac.uk
to accurately model the mechanical response.
In this paper we consider the force-distance curves ob-tained by indenting an AFM tip into a fluid bilayer sup-ported on a solid substrate. The force-distance curves are calculated from a static analysis of the deformation of the two leaflets and differs from usual Hertzian result of the deformation of elastic bodies. We analyze exper-iments on a dioleoyl-phosphatidylcholine (DOPC) - egg sphingomyelin (SM) - cholesterol (CHOL) phase sepa-rated supported bilayer, which is a model mixture repre-sentative of typicalin vivomembranes [14]. For certain composition ratios of the components, this system spon-taneously phase separates into coexisting liquid ordered (Lo, rich in SM and relatively thick because of strong
ne-matic order in the acyl tails) and liquid disordered (Ld,
rich is DOPC and relatively thin because of the more disordered tails) phases. We show how to determine the area compressibility moduli of the coexisting Lo and Ld phases of a single sample, and find values in agreement with literature values. To the best of our knowledge, this is the first time that the area compressibilities of the two coexisting compositions in fluid bilayers have been ex-tracted directly. This technique should prove invaluable for studying the composition dependence of mechanical properties in lipid bilayers, and can be easily extended to consider more complex interactions between AFM tip and the bilayer.
II. THEORY
2
are included later in the paper when comparisons are made with experiments. Since the lipid bilayer is not anchored it remains tension free. We assume that the volume is conserved at the molecular level: as the tip penetrates the bilayer it occupies a volume δV, so that
δN =δV /(a0d) lipids are expelled into the surrounding bilayer. Here,a0is the area per lipid in the absence of the AFM tip. The surface area increases by δA, due to the curved spherical surface of the AFM tip, and the increase in area per head groupδa≡a−a0 is given by
δa= A+δA
N−δN −a0=a0d
A+δA
V −δV
−a0. (1)
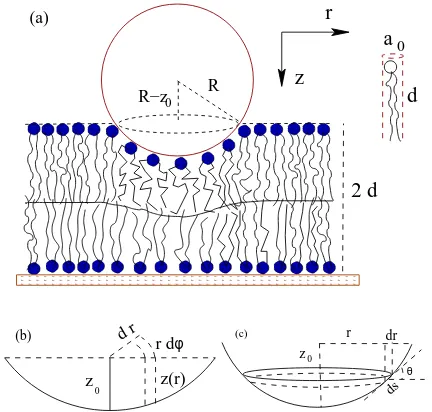
This increased area induces an elastic cost due to the stretching elasticity of the lipid leaflets. We calculate this not by averaging over the entire spherical cap, but by considering small increases in radius dr, and evaluating
δa/a0at eachr(Fig. 1).
0
z 0
r dr ds (c) θ z 0 z(r) r d d r (b) φ R z r 2 d
R−z 0 (a)
d a
FIG. 1: (color online) (a) Schematic geometry of an AFM tip of radiusRindenting a fluid bilayer of thickness 2dby an amountz0. The leaflet dividing surface at hb(r) is shown as
a solid line. (b) Cylindrical volume elements of depthz(r) at the distancerfrom the center of the tip. (c) The area 2πr ds
of such an element in contact with the lipid.
We assume that both leaflets have the same area per lipid a0 and stretching modulus κA/2 for lipid head groups on a flat surface. This should be valid in the absence of specific interaction of the lipid with the sub-strate, although experiments have shown that the sur-face often does have specific interactions [13]. The head groups in the top leaflet are forced to lie on a curved sur-face below the AFM tip. This affects both the area/lipid, and the stretching modulus for the lipids on the top leaflet. We model the local lipid free energy as a sum of a surface energy and a harmonic tail stretching, g(L)≃ γaL/cosθ+α/a2L, whereγis a surface tension,α penal-izes tail stretching, andaLis the projected area for leaflet
thicknessL. Here,θ(r) = sin−1(r/R) (Fig. 1c) is the tilt angle of the lipid surface. Minimizing g at fixed lipid volumev ≃LaL leads to an effective stretching modu-lus ˜κA/2≃κA/2 sec2/3θ and an effective area per lipid
at
0=a0 cos1/3for the top leaflet.
Using the modifications due to the curved surface for the head-groups in the top leaflet, the excess free energy due to the increase in the area per lipid during indenta-tion is
G(z0) =
κA 4
Z
S
d2r "
sec2/3θ(r)
δa a0 2 t + δa a0 2 b # , (2)
wheretandbrefers to the top and bottom leaflets and the integration extends over both leaflets. The lower leaflet will generally deform to accommodate the large energy change due to removing too many lipids from the upper leaflet. We let the lower and upper leaflets have thick-nesseshb(r) andht(r) respectively, withhb(r) +ht(r) = 2d−z0+R[1−cosθ(r)]. The area changes at each radius
rare given by (Fig. 1)
δa at 0 2 t =
dsec1/3θ(r)
ht(r) −1 2 , (3a) δa a0 2 b = d
hb(r)− 1
2
. (3b)
The measure isd2r=r dφdr. The dividing surfaceh b(r) is determined by minimizing the free energy at each r.
For equal stretching moduli in both leaflets, an explicit solution forhb(r) is possible for small tilt angle,
hb(r) =
2d−z0+R(1−cosθ(r))
1 + sec1/3θ . (4)
For realistic valuesz0 ∼2nm, d∼3nm andR ∼10nm,
this approximation introduces less than 0.1% error in
hb(r) for the entire range ofr. We use this approximation in the rest of the paper to derive analytic expressions for the free energy and force.
Usinghm(r) from Eq. 4, the free energy is
2G(z0)
πκAR2 =
Z 1
1−z0 R
x1 +x−2/3
×
"
1 +x1/3
x1/3 2−z0
d + R
d(1−x) −1
#2
dx, (5)
and the force on the AFM tip is given byF =∂G/∂z0.
We use the numerical force derived from Eq. 2 when per-forming fits to the data. For small penetrations z0 the force can be written as
F ≃ πκAR
4 "
1 + d 3R+
d
3R
2#z 0
d
2
+O(z3
0). . . (6)
[image:3.612.69.285.280.486.2]forR= 3dand much better for largerR, is
F = πκAR
4
2z0
2d−z0
2
. (7)
The force diverges as z0 approaches 2d because the
area/lipid diverges in order to preserve molecular vol-ume. The quadratic free energy (Eq. 2) is no longer valid there. Experimentally this divergence is preempted by pore formation (see below).
For comparison, the contact force between two solid (elastic) bodies much larger than the radius of contact (Hertzian contact) is F ∼ z03/2 [15]. More relevant for AFM experiments, the force to indent a finite elastic layer scales as F ∼ R2z3
0/d
3 if the layer is bonded to
the substrate and F ∼ Rz2
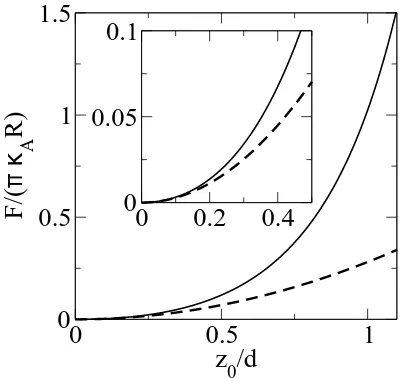
0/d if the layer can slip [7]. The response of fluid bilayers in eqn. 6 scales differently than all of these scenarios, and force is proportional to the area compressibility modulus instead of the Young’s modulus. For realistic experimental values the region of validity for this quadratic behavior is limited, as shown in Fig. 2(b).
0
0.5
1
z
0/d
0
0.5
1
1.5
F/(
π κ
A
R)
0
0.2
0.4
0
0.05
0.1
FIG. 2: Scaled force F/(πκAR) as a function of tip depth
z0/d(solid line) for tip radiusR/d= 3, according to Eq. 5.
The dashed line shows only the leading quadratic term in
z0/d, Eq. 6. Inset: Behaviour at small z0/d. On this scale the approximation of Eq. (7) is indistinguishable from the numerical solution of Eq. (5).
III. EXPERIMENTS
To test the theory we performed experiments on a sup-ported bilayer comprising DOPC, SM and CHOLat over-all molar ratios DOPC:SM:CHOL=40:40:20. At room temperature this system phase separates into coexisting
DOPC-richliquid disordered andSM-richliquid ordered domains (Fig. 3). The hydrocarbon tails have large ne-matic order in the Lo phase, leading to a thicker bilayer
and higher area compressibility modulus. In contrast, the tails have lower nematic order in the Ld phase with
concomitant smaller thickness and lower moduli. DOPC, CHOL (purchased from Sigma) and egg SM (purchased from Avanti) were dissolved in chloroform, dried under a stream of argon for 30 minutes, and then vacuum desic-cated for 30 minutes. The lipid was resuspended in PBS buffer at pH 7.4 to a concentration of 1 mg/ml by vor-texing. To make small single unilamellar vesicles (SUVs), the cloudy lipid suspension was tip sonicated (IKA, U50) at less than 5◦C for 25 mins (until the solution became
clear). The mica (Agar Scientific Ltd.) surface was in-cubated with the SUVs atat 50◦C and cooled down to
room temperature in a incubator over 15 minutes. Af-ter 1h, the sample wasgently rinsed with PBS buffer to remove any excess vesicles.
Force measurements were performed at 27◦C in PBS
buffer using a Nanoscope IV Mulitmode AFM (Veeco) equipped with a temperature control stage, using can-tilevers (NP, Veeco) with nominal spring constants of 0.12 N/m. Spring constants were measured using the thermal noise method [16] in air, and optical lever sensitivity de-termined against a clean mica surface.The force curves analysed in this paper were all taken from a single force-volume map of the phase separated bilayer shown in Fig-ure. 4, and exported using Nanscope software v5.12r30.
[image:4.612.76.278.318.507.2]Scanning electron microscopy (Camscan series III, FEG-SEM operating at 5 kV with magnification 160k) was used to measure the tip radius. Inset of Fig. 4 shows the tip image with dashed lines along the edges of the four pyramidal faces. The end of the tip can be approx-imated as spherical. The drawn circle (Fig. 4 inset) has a radius of 10 nm. The contrast of the image is poor. Consequently the uncertainty of the exact value of the radius is large. In our analysis we consider the tip radius to beR= 10±5 nm.
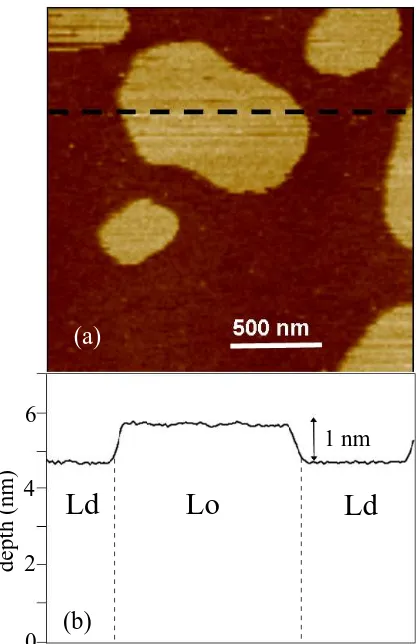
Fig. 3 shows a tapping mode image of the bilayer along with a one dimensional cross section. There is a∼5 nm thick Ldmatrix enclosing∼6 nm thick Lodomains(The
heights reported here include the thickness of any wa-ter layer between the bilayer and the mica surface). The composition of the two phases were determined by fol-lowing the tie lines on the ternary phase diagram, which were calculated using Atomic Force Microscopy [17]:
Ld : (DOPC:SM:CHOL) = (68 : 27 : 5) (8a)
Lo: (DOPC:SM:CHOL) = (3 : 71 : 26) (8b)
Phase diagrams on similar ternary mixtures have been calculated using NMR, and the compositions of the liquid-disordered and liquid ordered phases are similar [18]. The uncertainty in the compositions from place-ment of the tie lines is estimated to be less than 2% of the quoted values. For both Lo and Ld phases, force curves from contact mode AFM were used from at least 10 different measurements from different points within different regions (‘patches’, as in Fig. 3) of the sample.
4
1 nm
0
2
4
6
depth (nm)
(b)
(a)
Ld
Lo
Ld
FIG. 3: (color online) Phase separated lipid bilayer with liquid ordered and liquid disordered domains. (a) Tapping mode AFM image showing the height profile of the bilayer. (b) One dimensional section along the dashed line in (a).
0
2
4
6
8
10
2 d - z
0
(nm)
0
2
4
6
8
[image:5.612.71.281.49.371.2]F (nN)
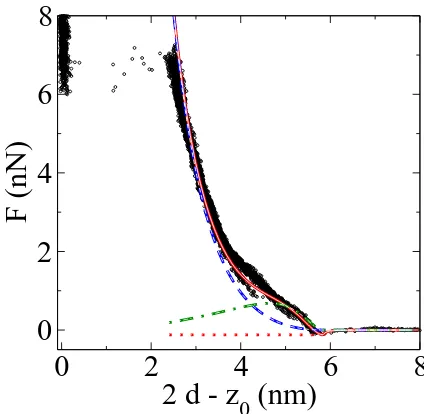
FIG. 4: Force-distance curve for a DOPC rich bilayer in the liquid disordered phase. The data points are from AFM ex-periments and the line is a fit for the theoretical prediction withκA= 0.12 N/m. Inset: SEM image of the tip to measure
the tip radius. The dashed lines are along the pyramidal face edges. The circle drawn at the end of the tip has a radius 10 nm.
stretching contribution considered so far, the tip experi-ences an attractive force due to van der Waals interaction and a short range repulsive force due tothe electric dou-ble layerson the tip surface and the membrane top sur-face. In principle the van der Waals interaction can be calculated from a knowledge of the dielectric constants of the tip, membrane, and the PBS buffer [19]. Simi-larly, the repulsive interaction can be estimated by know-ing the detailed charge distribution and solvknow-ing Poisson-Boltzmann equation. Phenomenologically, we model the van der Waals attraction as an interaction energy of the form−A/ξ6between volume elements of the tip and the membrane separated by a distanceξ.
Since these forces are short-ranged, we consider the tip as a sphere and for the volume integration over the mem-brane, consider the membrane as infinitely thick. We further assume that the repulsive interaction is strong enough to avoid adsorption. As the tip approaches the bilayer, the bilayer deforms. The extent of the deforma-tion is governed by the minimum of the stretching free energy and the long range interactions (van der Waals and screened Coulomb). We assume that the deforma-tion can be modeled as hard interacdeforma-tion from a tip with radiusRclarger than the physical tip radiusR. Although A is poorly known and depends on the detailed dielec-tric properties of the membrane, its precise value only changes Rc and controls the details of the force near
contact. For deeper contact the force is overwhelmingly dominated by the stretching modulus κA, so that the
force-distance curves yield the sameκA, independent of
A.
The drawn line in Fig. 4 shows the fit from our the-oretical analysis, using a downhill simplex method [20] to minimize the mean square fractional deviation of the prediction from the experimental data over the fitted range. The best fit for the compressibility modulus for
R = 10 nm is κA = 0.12 N/m. Because of the uncer-tainty in the tip radius, the range ofκA for R between 5 nm and 10 nm is between 0.25 N/m and 0.08 N/m, re-spectively. Our estimate compares well with the litera-ture valuesκA = 0.13−0.6 N/m from osmotic pressure measurements [21] andκA = 0.18±0.04 N/m from mi-cropipette aspiration of GUVs [22] made of pure DOPC. Our model provides an excellent fit until 2d−z0≃2.5nm, at which point the elastic energy of the deformed bilayer overcomes the cost of forming a hole [23] and the tip abruptly penetrates the full bilayer.
IV. RESPONSE OF LIQUID ORDERED DOMAINS
The AFM force curves for the SM rich liquid ordered phase are qualitatively different from those in the coex-isting liquid disorded phase (Fig. 5). The initial deforma-tion (5 nm≤2d−z0≤6 nm) shows a high modulus
con-sistent with the tightly packed character of the Lophase.
[image:5.612.68.281.444.638.2]0
2
4
6
8
10
2 d - z
0
(nm)
0
2
4
6
8
F (nN)
0
4
6
1
2
3
FIG. 5: (color online) Force-distance curve from AFM (sym-bols) in the SM rich liquid ordered phase superposed with two separate theoretical fits (lines,using Eq. 5) involving two different κA at small and large tip penetrations z0. Inset:
Closeup of the crossover region.
a much lower modulus. The symbols in Fig. 5 are from 12 separate force-distance measurements. While the ex-perimental data fall on the same curves away from the crossover region, the transition from stiff to soft behav-ior occurs at different values ofz0,which may be due to
either the stochastic behaviour of an activated event or flucuations in composition from region to region.
We first attempt to model these force curves as due to an effective stretching modulus that differs for small and large penetrations far from the crossover region. Hence we fit the data at small penetration (2d−z0 >5.3 nm)
and large penetration (2d−z0 <3.5 nm), with effective
stretching moduli according to Eq. (5). For R= 10 nm, the small z0 fit gives κA = 1.1 N/m. Recent experi-ments on a bovine brain SM and CHOL equimolar mix-ture foundκA= 2.1±0.2 N/m [24]. Since egg SM (16:0 SM) has shorter fatty acid chains than does bovine SM (18:0 SM), and the current composition has compara-tively smaller amounts of CHOL, we expect the mem-brane to be softer (smallerκA), as found.
The large penetration (z0) region has a stretching mod-ulusκA= 0.05 N/m,which is much closer to that of the
Ldphase shown in Fig. 4 than the unperturbed Lophase.
The AFM tip forces the bilayer immediately below it to decrease in thickness, which thus destroys the strong ne-matic order of the Lo phase and induces a yielding or
phase transition of the Lo phase into an Ld phase. It is
likely that the composition of this induced Ld phase
dif-fers from that of the Ldphase that characterizes
equilib-rium coexistence far from the AFM tip (Eq. 8a), because of slow kinetics of composition changes under the AFM
0
2
4
6
8
2 d - z
0
(nm)
0
2
4
6
8
F (nN)
FIG. 6: (color online) Force-distance curve from AFM (sym-bols) in the SM rich liquid ordered phase superposed with a
microscopically-motivated fit that accounts for a separate en-ergetic contribution from hydrogen-bond breaking (solid line, based on Eq. 9). Also shown are the separate contributions from the van der Waals interaction (dotted line), from the hy-drogen bonds (dot-dashed line) and the area compressibility term (dashed line).
tip. Our separate fits to extractκA suffer from narrow
available fit window (∼0.3 nm) for smallz0and the lack
of small force data for the largez0 fit. Also, this
proce-dure does not elucidate the reason for two distinct elastic regions separated by a crossover.
To understand the qualitatively difference force re-sponses of the Lo and Ld phases, we propose a
microscopically-motivated model. SM has both hydro-gen bond donor and acceptor groups and is known to form inter-SM hydrogen bonds [25, 26]. The free energy in the Ld phase, as represented in Eq. 2, is dominated
by solvent and tail packing entropies. Hence, to describe the Lo phase we separately include the short range
en-ergy of hydrogen bond breaking through a simple Morse potential: U(b) =ED[1−exp (−(b−b0)/λm)]2, whereb is the separation between the donor and acceptor group andb0 is the equilibrium separation. For typical hydro-gen bonds the dissociation energyED∼2−7 KCal/mol and the rangeλm ∼0.02−0.07 nm [27, 28]. For small changes in area/lipid and affine deformation the contri-bution to the free energy from distortion of hydrogen bonds is approximately
GHB(z0) =eHB
Z
d2r (
ht(r)
d
1−e−
1 λ
δa a0
t
2
+ hb(r)
d
1−e−
1 λ
δa
a0
b
2)
. (9)
[image:6.612.68.284.49.271.2] [image:6.612.330.542.50.257.2]6
per area andλ∼31/4λ
m/√a0for hexagonal arrangement of the lipids. As before, the total free energy, now com-prising contributions from Eqs. (5, 9), is minimized at each r to find the dividing surface between the leaflets and the force is calculated fromF =∂G/∂z0.
In the limit of small penetrations this model gives an effective stretching modulusκeff
A in the Lophase of
κeff
A =κA+ 4
eHB
λ2 , (10)
whereκA is thus the stretching modulus of the Ld phase
that is left after the Lo phase has been destabilized and
there is no remaining hydrogen bond contribution. The fit to the data is shown in Fig. 6. The stochastic nature of the force curves near the rupture point (2d−z0 ≃5.7),
limits the ability to obtain excellent fits. Our fit gives
κA= 0.13 N/m,eHB= 0.006 N/m andλ= 0.1.
Assuming an area per lipid a0 ∼ 0.6 nm2, the fitted
valueλimplies that the range of the Morse potential is
λm ∼ 0.06 nm. Simulations show about 0.5 hydrogen
bonds per lipid in SM bilayer [25]. Assuming an average hydrogen bond energy of 3.5 KCal/mol, our value foreHB
give 0.4 hydrogen bonds broken per lipid. The initial deformation is dominated by the contribution from the hydrogen bonds, and the corresponding force curve leads to an area compressibility modulusκef fA ≃2.7 N/m.
V. DISCUSSION
We have assumed a static force response, despite typ-ical tip velocitiesvtip ≃102nm/s. We can estimate the correction due to finite tip velocity by considering the dissipation from two dimensional viscosityη of the lipid layer. The dissipative force is found to be
FD(z0) =
ηπz0(2R−z0)
2d2 vtip. (11)
The two dimensional shear viscosity for fluid bilayers is expected to be of the order of 10−10N-s/m [29], leading to
FD ≃10−8 nN, much smaller than the elastic contribu-tions. Hence our static approach is sufficient to describe the AFM force-distance curves on fluid lipid layers.
In our calculations we have assumed that the two leaflets have the same area compressibility and preferred area per head group. This may not always be the case, because of surface interactions [13]; for example, sup-ported bilayers often have different melting temperatures than their counterparts in giant unilamellar vesicles. In-corporation of asymmetric membranes into the model is straightforward, although more complex. We have also
neglected splay or bending energies. Part of the elastic cost of this is already included in the increased area/lipid against the curved surface, in Eq. 2, but there may also be an additional negligible free energy cost due to the splay of the lipid tails, through the bending modulus of each leaflet.
In our analysis, the initial deformation for the Lophase
is described in terms of the stretching of hydrogen bonds. This can be explicitly tested by performing experiments with varying concentrations of SM or using chemicals that disrupt hydrogen bonds. However, this is beyond the scope of the present work.
Evidently, local applied pressure can melt the liquid ordered phase into the thinner Ld phase, which is not
surprising. We have proposed an explicit microscopic mechanism in terms of breaking hydrogen bonds that are implicated in stabilizing Lo phase. An alternative and
more general description could include a Landau theory for the free energy of the Lo-Ld phase transition, with
local pressurepadded as an external field to destabilize the Lo phase, ∆G∼pψ, whereψ is an order parameter
proportional to thickness whose value decreases upon a transformation to the Ld phase [30]. The phase
trans-formation would then occur first at constant composi-tion, and then one may expect the composition to change slowly as the external force changes the local preference for the different lipid species. The subject of kinetics and composition as a function of applied pressure is interest-ing and important, and we leave this for further work.
In summary, we have presented, and validated by ex-periments, a theory for describing the force distance
F(z0) relationship for AFM experiments on fluid bilayers, which leads to a remarkably simple expression forF(z0), Eq. (7). This provides a method for finding the area compressibility modulus and the amount of inter-lipid hydrogen bonds of fluid bilayers. The agreement with the existing literature values for the area compressibility is excellent. The main uncertainty in our prediction is due to the uncertainty in the tip radiusR. However, the simple linear dependence onR means that relative mea-surements taken with the same tip can be compared very accurately.
Acknowledgments
The authors thank A. Ferrante, R. Marriot, M. Noro and B. Stidder for useful discussions. This work was sup-ported by Yorkshire Forward through the grant YFRID Award B/302. CD acknowledges SoftComp EU Network of Excellence for financial support.
[1] G. Binnig, C. F. Quate, and C. Gerber, Phys. Rev. Lett.
56, 930 (1986).
[2] H.-J. Butt, B. Cappella, and M. Kappl, Surface Science
Reports59, 1 (2005).
[4] K. Vo itchovsky, S. A. Contera, M. Kamihira, A. Watts, and J. F. Ryan, Biophys. J.90, 2075 (2006).
[5] K. D. Costa, A. J. Sim, and F. C. Yin, J. Biomech. Eng. Trans. ASME128, 176 (2006).
[6] I. N. Sneddon, Internat. J. Engin. Sci.3, 47 (1965). [7] R. S. Chadwick, SIAM J. Appl. Math.62, 1520 (2002). [8] Y. T. Cheng, W. Ni, and C.-M. Cheng, Phys. Rev. Lett.
97, 075506 (2006).
[9] R. Lipowsky, Nature349, 475 (1991).
[10] E. Evans and W. Rawicz, Phys. Rev. Lett. 64, 2094 (1990).
[11] S. Steltenkamp, M. M. M uller, M. Deserno, C. Hennesthal, C. Steinem, and A. Janshoff, Bio-phys. J.91, 217 (2006).
[12] U. Seifert and S. A. Langer, Europhys. Lett. 23, 71 (1993).
[13] C. Xing, O. H. S. Ollila, I. Vattulainen, and R. Faller, Soft Matter5, 3258 (2009).
[14] S. L. Veatch and S. L. Keller, Phys. Rev. Lett.94, 148101 (2005).
[15] L. Landau and E. Lifshitz, Theory of elasticity
(Butterworth-Heinemann, Oxford, 1986), p. 26, 3rd ed. [16] J. Hutter and J. Bechhoefer, Rev. Sci. Instrum.64, 3342
(1993).
[17] S. D. Connell, G. Li, P. D. Olmsted, N. M. Hooper, and D. A. Smith (2010), to be published.
[18] S. L. Veatch, K. Gawrisch, and S. L. Keller, Biophys. J.
90, 4428 (2006).
[19] J. Israelachvili,Intermolecular and surface forces (Aca-demic Press, New York, 1992), 2nd ed.
[20] W. H. Press, S. A. Teukolsky, W. T. Vetterling, and B. Flannery, Numerical Recipes (Cambridge university press, Cambridge, 1992), 2nd ed.
[21] S. Tristram-Nagle, H. I. Petrache, and J. F. Nagle, Bio-phys. J.75, 917 (1998).
[22] N. Fa, L. Lins, P. Courtoy, Y. Dufrˆene, P. van Der Smis-sen, R. Brasseur, D. Tyteca, and M.-P. Mingeot-Leclercq, BBA-Biomem1768, 1830 (2007).
[23] H.-J. Butt and V. Franz, Phys. Rev. E66, 031601 (2002). [24] W. Rawicz, B. A. Smith, T. J. McIntosh, S. A. Simon,
and E. Evans, Biophys. J.94, 4725 (2008).
[25] E. Mombelli, R. Morris, W. Taylor, and F. Fraternali, Biophys. J.84, 1507 (2003).
[26] T. R´og and M. Pasenkiewicz-Gierula, Biophys. J. 91, 3756 (2003).
[27] Y. Gao, K. V. Devi-Prasad, and E. W. Prohofsky, J. Chem. Phys.80, 6291 (1984).
[28] D. Thierry, M. Peyrard, and A. R. Bishop, Phys. Rev. E
47, 684 (1993).
[29] M. Sickert and F. Rondelez, Phys. Rev. Lett.90, 126104 (2003).