THE ROLE OF DIFFUSION WEIGHTED MAGNETIC RESONANCE IMAGING AND APPARENT DIFFUSION COEFFICIENT QUANTIFICATION IN THE EVALUATION OF PULMONARY LESIONS WHICH ARE INDETERMINATE
ON CONTRAST ENHANCED COMPUTED TOMOGRAPHY
CERTIFICATE
This is to certify that the dissertation entitled “The role of diffusion weighted magnetic resonance imaging and apparent diffusion coefficient quantification in the evaluation of pulmonary lesions which are indeterminate on contrast enhanced computed tomography” is the bonafide original work of Dr. Shweta Singh submitted in partial fulfilment of the requirement of the M.D. Radiodiagnosis (Branch VIII) Degree Examination of the Tamil Nadu Dr. M.G.R. Medical University, Chennai to be held in May 2019.
Guide:
Dr. Binita Riya Chacko
Professor,
Department of Radiology,
Christian Medical College,
CERTIFICATE
This is to certify that the dissertation entitled “The role of diffusion weighted magnetic resonance imaging and apparent diffusion coefficient quantification in the evaluation of pulmonary lesions which are indeterminate on contrast enhanced computed tomography” is the bonafide original work of Dr. Shweta Singh submitted in partial fulfilment of the requirement of the M.D. Radiodiagnosis (Branch VIII) Degree Examination of the Tamil Nadu Dr. M.G.R. Medical University, Chennai to be held in May 2019.
Dr. Sridhar Gibikote
Professor and Head
Department of Radiology
Christian Medical College
CERTIFICATE
This is to certify that the dissertation entitled “The role of diffusion weighted magnetic resonance imaging and apparent diffusion coefficient quantification in the evaluation of pulmonary lesions which are indeterminate on contrast enhanced computed tomography” is the bonafide original work of Dr. Shweta Singh submitted in partial fulfilment of the requirement of the M.D. Radiodiagnosis (Branch VIII) Degree Examination of the Tamil Nadu Dr. M.G.R. Medical University, Chennai to be held in May 2019.
Dr. Anna B. Pulimood
Principal
Christian Medical College
ACKNOWLEDGEMENTS
This study was made possible by the unified and untiring efforts of various individuals to whom I am deeply grateful.
Firstly, I wish to thank my thesis guide, Dr. Binita Riya Chacko, Dr. Aparna Irodi and Dr. Leena R. Vimala for their inspiring ideas, direction and continued support in performing this study.
I also wish to thank Dr. D. J. Christopher, Dr. Balamugesh and the department of pulmonary medicine and other referring units for their invaluable help with
recruitment of patients for the study, and for performing the bronchoscopic biopsies and to Dr. Neelaveni Duhli and her team for the performing the histopathological examination of the lung biopsy specimens.
I am deeply grateful to Mr. Nixon, Mr. Victor, Mr. Stephen and their team of radiographers who worked tirelessly to help perform the MR studies.
I would also like to thank Dr. Vinod J. Abraham, Mr. Bijesh and Ms. Hepsi for their help with the statistical analysis of the data.
I would like to thank my family for their continued support.
Lastly, and most importantly, I wish to thank God for his grace without whom the completion of this thesis would not be possible.
CONTENTS
Abstract ... 1
Introduction ... 5
Aims and objectives ... 7
Review of literature... 8
Materials and methods ... 35
Results ... 43
Discussion ... 73
Conclusions ... 80
Limitations ... 82
Bibliography ... 83
Appendix 1 (Proforma) ... 88
Appendix 2 (Consent form) ... 90
Appendix 3 (Data sheet)………...96
INDEX OF TABLES AND FIGURES
S no. Title Page no.
Fig 1: Interstitial pneumonia with eosinophilic granulomas presenting as a solid left lower lobe pulmonary nodule
12
Fig 2: Superior Sulcus Tumour 22
Fig 3: Consolidation in adenocarcinoma in situ 23
Fig 4: CT angiogram sign 24
Fig 5: "Cheerios in the chest"- cavitatory pulmonary lesions 24 Fig 6: Small cell carcinoma of the right upper lobe with ipsilateral
mediastinal lymphadenopathy
26
Fig 7: Column graph demonstrating age distribution of patients 43 Fig 8: Column graph demonstrating distribution of patients according to
method of biopsy
45
Fig 9: Stacked column graph depicting division of patients based on diagnostic categories
45
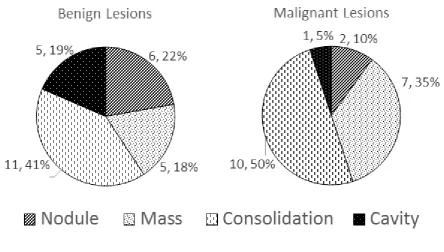
Fig 10: Distribution of infection based on the causative pathogen 47 Fig 11: Pie charts demonstrating the distribution of type of lesion in benign
versus malignant lesions
49
Fig 12: Box plot showing significant difference in average signal intensity of the solid component in benign versus malignant lesions on DWI (b= 1000 s/mm2) (p value =0.002; 95% CI 18.13 to 80.69)--
54
Fig 13: : Box plot showing significant difference in LSR on DWI (b= 500 s/mm2) in benign versus malignant lesions (p value=0.002; 95% CI 0.97 to 0.24)
Fig 14: Box plot showing significant difference in LSR on DWI (b= 1000 s/mm2) in benign versus malignant lesions (p value= 0.001; 95% CI 0.29 to 1.06)
56
Fig 15: Box plot showing significant difference in the ADC of the solid component in benign versus malignant lesions (p value= 0.001; 95% CI 0.111 to 1.621 x 10⁻³ mm2/s)
57
Fig 16: ROC curve for diagnostic performance of LSR (on DWI b=500 s/ mm2) for differentiation of malignant from benign pulmonary lesions. Cut-off value of 1.234 had a 70.0% sensitivity and 74.1% specificity for differentiating the two. (AUC= 0.761)
60
Fig 17: ROC curve for diagnostic performance of LSR (on DWI b=1000 s/ mm2) for differentiation of malignant from benign pulmonary lesions. Cut-off value of 1.141 had a 70% sensitivity and 85.2% specificity for differentiating the two (AUC = 0.765)
62
Fig 18: Figure 18: ROC curve for diagnostic performance of ADC values for differentiation of malignancies from benign pulmonary lesions. Cut-off value of 1.248 X 10⁻³ mm2/s had a 80% sensitivity and 74.1%
specificity for differentiating the two. (AUC= 0.735)
64
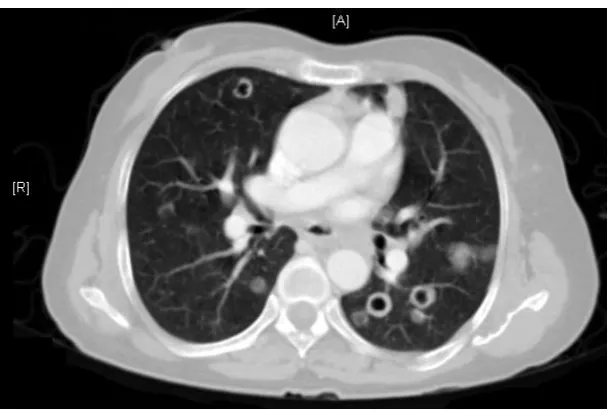
Fig 19: CECT axial section showing an irregular lesion in the right upper lobe with spiculated margins
66
Fig 20: T2W MR axial section showing an irregular heterogeneously T2 isointense lesion in the right upper lobe
66
Fig 21: Diffusion weighted images showing no diffusion restriction (isointense on DWI and ADC images). The values obtained from ROI placed within the solid areas shows the following values.
Fig 22: CECT axial section HR cuts shows a solitary pulmonary nodule in the right lower lobe
67
Fig 23: T2W MR axial section showing an T2 isointense nodule in the right lower lobe
68
Fig 24: Figure 24: Diffusion weighted images showing diffusion restriction (hyperintense on DWI with corresponding dark areas on ADC).The values obtained from ROI placed within the solid area shows the following values
68
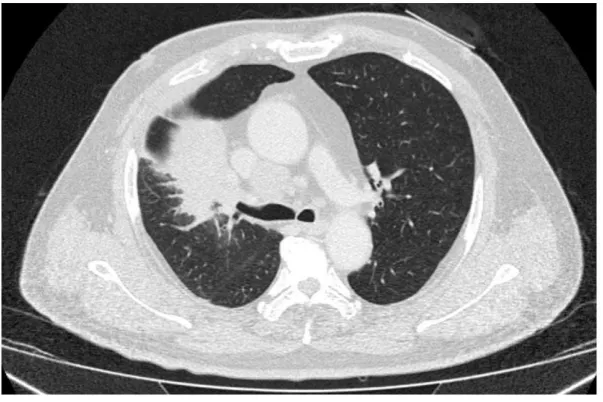
Fig 25: CECT axial section showing an irregular heterogeneously enhancing lesion in the left upper lobe with central non-enhancing necrotic areas
69
Fig 26: T2W MR axial section showing an irregular heterogeneously T2 hyperintense lesion in the left upper lobe with central T2 hypointense areas
69
Fig 27: Diffusion weighted images showing peripheral diffusion restriction (hyperintense on DWI with corresponding dark areas on ADC) with central T2W hypointense areas showing no restriction. The values obtained from ROI placed within the solid areas shows the following values
70
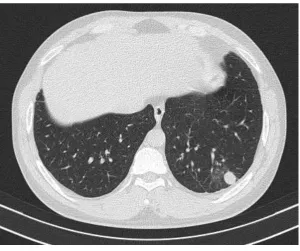
Fig 28: Contrast enhanced CT axial section (lung window) showing scattered sub-solid nodules and areas of consolidation predominantly involving the left lower lobe
71
Fig 29: T2W axial sections through the thorax showing T2 hyperintense areas of consolidation predominantly involving the left lower lobe
[image:10.595.73.536.64.736.2]Fig 30: Diffusion weighted images showing T2 shine through effect. The valued derived from the ROIs placed in the areas of consolidation area as shown below
[image:11.595.72.537.180.772.2]72
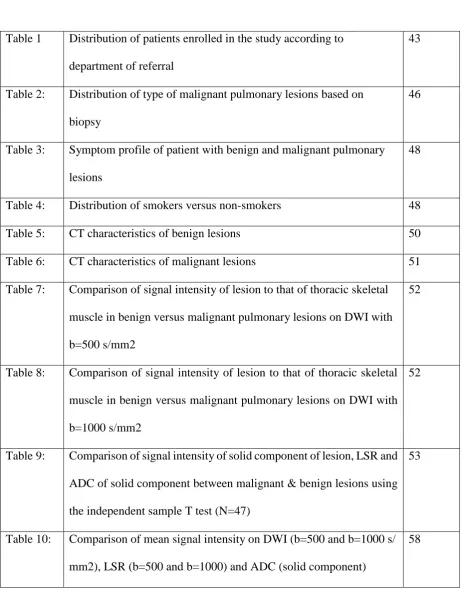
Table 1 Distribution of patients enrolled in the study according to department of referral
43
Table 2: Distribution of type of malignant pulmonary lesions based on biopsy
46
Table 3: Symptom profile of patient with benign and malignant pulmonary lesions
48
Table 4: Distribution of smokers versus non-smokers 48
Table 5: CT characteristics of benign lesions 50
Table 6: CT characteristics of malignant lesions 51 Table 7: Comparison of signal intensity of lesion to that of thoracic skeletal
muscle in benign versus malignant pulmonary lesions on DWI with b=500 s/mm2
52
Table 8: Comparison of signal intensity of lesion to that of thoracic skeletal muscle in benign versus malignant pulmonary lesions on DWI with b=1000 s/mm2
52
Table 9: Comparison of signal intensity of solid component of lesion, LSR and ADC of solid component between malignant & benign lesions using the independent sample T test (N=47)
53
Table 10: Comparison of mean signal intensity on DWI (b=500 and b=1000 s/ mm2), LSR (b=500 and b=1000) and ADC (solid component)
between tuberculosis and non-tuberculous lesions using the independent samples T-test (N=24)
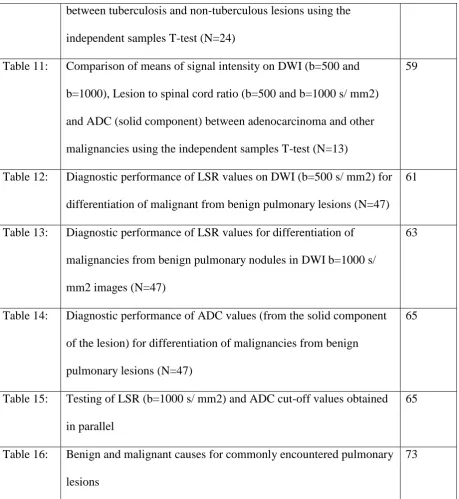
Table 11: Comparison of means of signal intensity on DWI (b=500 and b=1000), Lesion to spinal cord ratio (b=500 and b=1000 s/ mm2) and ADC (solid component) between adenocarcinoma and other malignancies using the independent samples T-test (N=13)
59
Table 12: Diagnostic performance of LSR values on DWI (b=500 s/ mm2) for differentiation of malignant from benign pulmonary lesions (N=47)
61
Table 13: Diagnostic performance of LSR values for differentiation of malignancies from benign pulmonary nodules in DWI b=1000 s/ mm2 images (N=47)
63
Table 14: Diagnostic performance of ADC values (from the solid component of the lesion) for differentiation of malignancies from benign pulmonary lesions (N=47)
65
Table 15: Testing of LSR (b=1000 s/ mm2) and ADC cut-off values obtained in parallel
65
Table 16: Benign and malignant causes for commonly encountered pulmonary lesions
1 ABSTRACT
Title:
The role of diffusion weighted magnetic resonance imaging and apparent diffusion
coefficient quantification in the evaluation of pulmonary lesions which are indeterminate on contrast enhanced computed tomography.
Aims and objectives:
To assess the value of absolute signal intensity, lesion to spinal cord ratio (LSR) and apparent diffusion coefficient (ADC) values obtained from the solid and necrotic components of indeterminate pulmonary lesions in differentiating benign from malignant lesions.
Materials and methods:
Forty seven consecutive patients with indeterminate pulmonary lesions detected on contrast enhanced CT of thorax who fulfilled the selection criteria for the study underwent MRI with T2 weighted and diffusion weighted imaging (DWI) (b= 0, 500, 1000 s/mm2). On DWI, the
absolute signal intensity, signal intensity of the lesion as compared subjectively to that of the thoracic skeletal muscles (hypointense, isointense or hyperintense) and the LSRs (average of 3 values) were obtained following which ADC values of the solid and necrotic parts of the lesion were assessed. The values for benign and malignant lesions and were compared using the independent samples T- test. Receiver operating characteristic curves (ROC) were plotted and diagnostic cut-off values were obtained.
Results:
Of the total of 47 patients enrolled (32 men; 15 women), 43 were diagnosed on histopathology and the rest, on sputum culture or follow up after antibiotic therapy. On performing a qualitative analysis comparing the signal intensity of the lesion on DWI (b=500 and 1000 s/mm2) to that
2
to be hyperintense on DWI with no statistically significant difference on b=500 s/mm2 images (p value = 0.590) and b= 1000 s/mm2 images (p value = 0.590). On comparing benign versus
malignant lung lesions, statistically significant difference was seen between the absolute signal intensity of the solid component of the lesion on DWI (b=1000 s/mm2) (p value =0.002; 95% CI 2.04 to 105.22), LSR on DWI (b=500 s/mm2 (p value=0.002; 95% CI 0.24 to 0.97) and b= 1000 s/mm2 (p value= 0.001; 95% CI 0.29 to 1.06)) and ADC of the solid component (p value= 0.006; 95% CI 0.079 to 0.969 x 10⁻³ mm2/s). There was no statistically significant difference
between absolute signal intensity values of benign and malignant lesions on b=500 s/mm2 images (p value= 0.059; CI =105.22 to 2.04 x 10⁻³ s/mm2).
For differentiation of malignant from benign lesions, ROC curves for LSR on DWI b=500 s/mm2 yielded a cut-off value of 1.234 with 70.0% sensitivity and 74.1% specificity (AUC= 0.761), LSR on DWI b=1000 s/mm2 yielded a cut-off value of 1.141 with 70% sensitivity and 85.2% specificity (AUC = 0.765) and ADC values of the solid component yielded a cut-off value of 1.248 x 10⁻³ mm2/s with 80% sensitivity and 74.1% specificity (AUC= 0.735). Higher LSR values and lower ADC values are suggestive of malignancy. Some malignant lesions like mucinous adenocarcinoma (2/4) and squamous cell carcinoma (2/5) showed ADC values higher than the said cut-off value and a few cases benign lesions of tuberculosis (2/11), fungal infection (1/3) and a case of amyloidosis showed ADC values lower than that of the cut-off. 12 of 27 benign and 5 of 20 malignant lung lesions had areas of necrosis with no significant difference in the ADC of the necrotic components in the two groups (p value= 0.132; 95% CI 1.393 to 0.201 x 10⁻³ mm2/s).
Conclusion:
3
from malignant lesions with no significant difference in diagnostic performance between the them (p value= 0.779). If a lesion tests positive for malignancy for either of the tests, the overall sensitivity can be increased up to 94% (specificity = 63.1%). In patients with high risk for lung biopsy, DWI & ADC maps in addition to CECT, can further assess the likelihood of malignancy and help direct further management.
Keywords: diffusion weighted magnetic resonance imaging, b factor, absolute signal
5
INTRODUCTION
With the advent of computed tomography (CT), there has been an increase in the number of pulmonary lesions detected in patients undergoing CT of thorax for related or unrelated reasons. In a patient detected to have a pulmonary lesion, it is vital to arrive at a diagnosis which would direct further management. CT of the thorax with contrast (CECT) has significantly improved the ability to localize and characterize pulmonary lesions over plain chest radiograph (1). It is often possible to arrive at a single diagnosis based on CT findings and the clinical presentation of the patient. However, in some cases, it may not be possible to further characterize the lesions and differential diagnosis could include infectious, inflammatory causes and malignancy.
6
Diffusion weighted imaging (DWI) which has shown promising results in differentiating malignant from benign lesions in the brain and prostate is now being explored for its possible use in evaluating pulmonary lesions. There have been a few studies in the recent past which have looked at differences in DWI and ADC in biopsy proven benign and malignant lesions with promising results. On review of literature, we found no dedicated studies assessing the additional role of DWI to evaluate pulmonary lesions which cannot be diagnosed on CT as probably malignant or probably benign. When CT findings are equivocal, the use of advanced imaging help identify the cases where the risk to benefit ratio of performing lung biopsy is great.
7
AIMS AND OBJECTIVES
Aim:
To assess the role of diffusion weighted magnetic resonance imaging and apparent diffusion coefficient quantification in the evaluation of pulmonary lesions which are indeterminate on contrast enhanced CT of the thorax.
Primary objectives:
1. To assess the average ADC values from the solid component of the lesions and assess difference in ADC values between malignant and benign lesions.
2. To obtain the absolute signal intensity of pulmonary lesions on DWI b=500 s/mm2and b=1000 s/mm2 images and assess the difference in absolute signal intensity between
malignant and benign lesions.
3. To obtain the lesion to spinal cord signal intensity ratio (LSR) and assess difference in LSR between malignant and benign lesions.
4. To grade the signal intensity of pulmonary lesions on DWI images in comparison to the thoracic skeletal muscle and assess difference between that of malignant and benign lesions.
Secondary objectives:
1. To assess the difference in ADC values obtained from necrotic areas within benign and malignant lesions.
8
REVIEW OF LITERATURE
In a patient detected to have a pulmonary lesion, it is vital to arrive at a diagnosis which would help direct further management, be it conservative follow up or aggressive medical or surgical treatment (1). Lung lesions can be categorised on CT in to consolidation, cavity, nodule, mass, and ground glass opacity. Malignancy, infection and inflammatory causes can have these appearances on CT.
Consolidation
Consolidationis a term used to describe filling of airspaces in the pulmonary tree with a material which increases its relative attenuation with that of the surrounding normal lung parenchyma (2). A consolidation is an area of increased lung parenchymal attenuation with obscuration of the pulmonary vessels (sometimes with an air bronchogram) without any significant volume loss of the affected segment. A ground glass opacity is defined as increased lung parenchymal attenuation without obscuration of the pulmonary vessels. The increase in parenchymal attenuation may occur due to filling of air-spaces with fluid
(pulmonary edema), pus cells or other inflammatory cells (pneumonia), blood (haemorrhage), protein (alveolar proteinosis) or malignant cells (bronchoalveolar carcinoma). The
distribution may be patchy (incomplete airspace filling with incontiguous areas of residual gas within alveoli), lobar (homogenous increase in attenuation of a lobe with clear delineation of adjacent normal lung) or multifocal. Definitive etiological diagnosis is determined by clinical presentation, microbiological and or histopathological correlation.
Based on the pattern of involvement, the causes can be classified as 1. Lobar
9
b. Malignant - lung carcinoma with obstructive atelectasis or pneumonia, adenocarcinoma with endobronchial spread
c. Vascular - contusion, infarction
d. Others - organizing pneumonia, eosinophilic pneumonia, sarcoidosis 2. Diffuse
a. Edema – pulmonary edema (cardiogenic, renal), acute respiratory distress syndrome (ARDS), hypoalbuminemia
b. Infection – Viral, Pneumocystis jiroveci, staphylococcal bronchopneumonia
c. Haemorrhage- Wegener’s granulomatosis, Henoch Schonlein purpura (HSP), systemic lupus erythematosis (SLE)
d. Others – Acute hypersensitivity pneumonitis, pulmonary alveolar proteinosis etc.,
3. Multifocal
a. Bronchopneumonia (Klebsiella, Staphylococcus, Legionella, Gram negative bacteria, tuberculosis)
b. Vascular – septic emboli, Wegener’s granulomatosis
c. Neoplasms- adenocarcinoma with endobronchial spread, lymphoma. d. Others- organizing pneumonia, eosinophilic pneumonia, lipophilic
pneumonia
10
infection (bacterial, mycobacterial, fungal etc), the bulging fissure sign associated with
Klebsiella pneumonia, air-fluid sign which may indicate an abscess within and the split pleural sign which indicates as associated empyema. The feeding vessel sign is suggestive of septic emboli, but can also be present in pulmonary metastases (3).
Cavity
Pulmonary cavities are air-filled space within a consolidation, mass or nodule and may be seen both on plain chest radiographs or CT. The causes of pulmonary cavities are as follows-
Infection
o pulmonary tuberculosis
o pulmonary bacterial abscess/cavitating pneumonia
o septic pulmonary emboli
other rare infections (coccidioidomycosis, actinomycosis, nocardiosis , melioidosis, cryptococcosis)
Cavitating malignancy
o primary bronchogenic carcinoma (especially squamous cell carcinoma)
o cavitating pulmonary metastases (squamous cell carcinoma, adenocarcinoma, sarcoma, tumours of the gastrointestinal tract and breast)
Non-infective granuloma
o rheumatoid nodules
o granulomatosis with polyangitis Vascular
11
These lesions are typically thick walled (2-5mm). A study done by Honda et al (2007) showed that presence of a notch in a cavitatory nodule and irregular internal wall was more commonly associated with malignancy while the presence of satellite nodule, linear margins, associated bronchial wall thickening and surrounding ground glass attenuation were more commonly associated with benign nodules (4). Post contrast enhancement, on the other hand can be seen in the walls of both infectious and malignant cavitatory lesions.
Nodule:
Pulmonary nodules are solitary or multiple focal, radiographic opacities. A classic
solitary pulmonary nodule (SPN) is defined as a single, spherical, well-circumscribed,
radiographic opacity measuring less than or equal to 30 mm in diameter and is surrounded
completely by aerated lung. Pulmonary nodules may be solid or sub-solid. The latter group is
further subdivided into part- solid and pure ground glass nodule. A solid nodule is an air-space opacification with higher density than the surrounding parenchyma which may obscure underlying bronchovascular structures while a ground glass nodule is an ill-defined area of high attenuation which does not obscure bronchovascular structure. Solid pulmonary nodules could represent various etiologies like-
Benign granulomas
Intrapulmonary lymph node Focal scar
12
[image:24.595.73.374.132.383.2]These nodules have considerable overlap in their radiological features and follow up based on size recommended by the Fleischner’s guidelines.
Figure 1: Interstitial pneumonia with eosinophilic granulomas presenting as a solid left lower lobe pulmonary nodule in a patient.
Subsolid nodules (especially ground glass nodules) are often transient and are caused by haemorrhage or infection. However, persistent subsolid nodules could be representative of malignancy of the adenocarcinoma spectrum.
13
Shi et al (6) studied the relationship between the size of a SPN and the chance of malignancy in a cohort at high risk for lung cancer and found that nodules <4mm) were least likely to be malignant. Central, popcorn like and laminated calcifications are likely to be of benign etiology. In a study by Henschke et al (7), solid nodules were malignant in 63% of part-solid nodules, 18 % of pure ground glass nodules and 7 % of part-solid nodules were found to be malignant. Presence of intranodular fat is indicative of a hamartoma. On the other hand, margins that are spiculated / irregular and distortion or encasement of adjacent
bronchovascular structures are more commonly associated with malignancy(8). Post contrast enhancement of less than 15 HU is in favour of a benign lesion. A large number of lesion detected on CT, however, do not show features characteristic of either are and termed
indeterminate. Thus there still remains a grey area of overlap in some lesional characteristics like attenuation values, presence of cavitation/ central necrosis and wall thickness among infectious and malignant lesions. Also, lesions like active granulomas and hypervascular benign tumors may show significant post contrast enhancement. In such cases PET-CT, MRI are other investigative modalities used for further characterization of the lesions as benign or malignant (9).
PET-CT, although known for its high sensitivity ( 95 %) has a low specificity (~81%) and granulomatous lesions (10) like those due to pulmonary tuberculosis may show false positive results, which is problematic in a country like India, which has a high prevalence of the disease .
14
Due to the overlapping features of benign and malignant pulmonary lesions manifesting as nodules, cavities, consolidations or masses on CECT, there is a need to use other imaging modalities and techniques, to differentiate between the two due to implications related to their management (including further imaging, need for biopsy and histopathological examination of these lesions which would direct treatment).
Pulmonary infections
Pulmonary infections are common pulmonary pathology. The appearance of these infections on CECT depend on the causative organisms, their mode of spread and the immune status of the host among other factors. These infections can spread through the tracheobronchial tree (through inhalation), via the pulmonary vessels (haematogeneously) or through continuous spread from adjacent structures.
Bacterial infections
15 Tuberculosis
The imaging features of pulmonary tuberculosis (caused by Mycobacterium tuberculosis) vary depending on the host and whether it is a case of primary or post-primary tuberculosis. Patient often have low-grade or chronic symptoms and its radiological appearances are so varied that it sometimes results in diagnostic confusion it sputum examination does not yield the acid-fast bacilli.
In those with primary pulmonary TB, in an immunocompetent patient, the initial caseating granuloma, calcified forming a Ghon’s focus (often peripherally located in the upper lobe or apical segment of the lower lobe), and may be associated with pleural effusion (commoner in adults). If, accompanied by mediastinal or hilar lymphadepathy, it is called a Ranke complex (which may be calcified in upto 35% of cases).
Post-primary TB is a result of reactivation and more commonly manifests as cavitations (20-45% of cases) and commonly involve the upper lobes (85%). The cavity may erode a nearby bronchus resulting in and air-fluid level within. Endobronchial spread results in a ‘tree-in bud’ appearance (branching peribronchial thickening with fine nodules) on HRCT and may be associated with hilar adenopathy.
Miliary tuberculosis, which results from haematogeneous dissemination of the bacillus, appears on CT as 1-3 mm nodules of uniform size and distribution.
In patients with co-existing HIV infection, which CD4 counts are between 350 and 200 cells/ mm3 the manifestations resemble that of post-primary tuberculosis while in those with counts below 200 cells/ mm3, military TB is more common with generalized lymphadenopathy (13)
16
Other mycobacterial pulmonary infections, of which Mycobacterium avium-intracellulare is the most common, pulmonary manifestation seen on CT include ground-glass opacities, ‘tree-in bud’ appearance associated with endobronchial spread, areas of patchy consolidation and bronchiectasis with bronchial wall thickening (‘tram-track sign’) and pleural thickening. These lesions tend to have a predilection for the upper lobe, right middle lobe and lingual (14).
Fungal infections
These are commonly seen in immunocompromized patients who are diabetic, on long term steroid therapy, immunosuppressants or chemotherapy and those with HIV infection with low CD4 counts. Etiological agents include molds like Aspergillus sp. (most common), yeasts like
Candida sp., and dimorphic fungi like Histoplasma capsulatum, Coccidoides immitis, Blastomyces sp. etc. Pulmonary aspergillosis has varied radiological manifestations that depend largely on the immune response of the host.
Allergic bronchopulmonary aspergillosis is a result of a hypersensitivity reaction to the same and commonly manifests on CT as transient pulmonary alveolar ground glass opacities or centrilobular nodules and mucus plugging resulting in the typical ‘finger-in glove’
appearance. Over a long period of time, it can result in bronchiectasis and scarring.
17
Invasive aspergillosis is typically seen in immunocompromised host and may result in broncho-invasive or angio-invasive disease. Radiologically, broncho-invasive disease manifests as obstructive tracheobronchitis (characterized by bronchial wall thickening), bronchiolitis (imparting a ‘tree in bud appearance’) or bronchopneumonia (seen as peribronchial areas of patchy consolidation). Angio-invasive disease, seen in profoundly immunosuppressed patients, particularly in the setting of neutropenia (<500cell/mcL) post bone marrow transplant, typically manifests on HRCT as a nodule surrounded by ground glass opacitiy (which represents haemorrhage), known as the ‘halo-sign’ (12).
Pneumocystis pneumonia
The organism is a yeast-like atypical fungus that almost exclusively affecting
immunocompromised hosts, especially HIV positive patients with a 200 cells/ mm3. HRCT of the thorax shows predominantly perihilar pulmonary ground-glass opacities with a ‘crazy paving’ pattern of involvement with pneumatocoeles
Viral infections
These are causes by a host of RNA and DNA viruses, including the influenza viruses, the manifestations of which vary depending on the viral strain and host factors. On CT, the most common findings are bilateral peribronchial thickening in the perihilar regions with
interstitial infiltrates and areas of patchy atelectasis and air-trapping(15).
18
This is a group of benign inflammatory pulmonary conditions which encompasses airspace predominant, vascular predominant and interstitial predominant disease. The air-space predominant lesions and some combined air-space/ interstitial disease like sarcoidosis often mimic infectious and malignant pulmonary lesions on CECT or HRCT (16).
Airspace predominant inflammatory lung disease
Eosinophilic pneumonias, especially the chronic subtype, is seen in the setting of asthma or a hypersensitivity response to certain drugs or part of fungal infections. CT shows areas of non-segmental peripherally located air-space consolidations and band like opacities parallel to the pleura which may later progress to fibrosis.
Organizing pneumonia is a non-specific response to pulmonary injury. The more common radiological appearance on CT is that of peripheral bilateral lower lobe predominant
consolidations with air bronchograms and subpleural sparing and the ‘atoll sign’ which is an area of ground glass opacity surrounded by a rim of consolidation is typically described in this condition. However, occasionally, it may present as multiple lung masses that are PET avid and mimic carcinoma, leading to diagnostic confusion in such cases. Most of these case often resolve without specific treatment.
19 Vasculitis
This encompasses a group of inflammatory disorders mainly affecting the blood vessels of the lung and are often associated with systemic vasculitis. Among other subtypes mentioned in the Chapel Hill classification, they have varied appearances. In ANCA associated
vasculitis, pulmonary nodules and areas of consolidation with cavitation are common and may be accompanied by mediastinal or hilar adenopathy and pleural effusion while on the other hand, Churg-Strauss syndrome presents with transient nodule, ground-glass opacities or patchy areas of mosaic attenuation and inter-lobular septal thickening with no specific lobar predilection. These appearances, however, may not be diagnostic. Thus, the clinical
presentation, serum markers and imaging findings together help reach a diagnosis in most cases (17).
Sarcoidosis
It is a benign inflammatory systemic disorder characterized by noncaseating granulomatous disease. Pulmonary and mediastinal involvement in seen in up to ~90% of cases of
sarcoidosis. CT features include ground glass opacities, interlobular septal thickening with centilobular nodules, confluence of smaller nodules that may mimic a consolidation often with enlarged mediastinal and hilar lymph nodes and in later stages, honeycombing and tractional bronchiectasis. Nodular sarcoidosis, in particular, often resembles primary or metastatic lung cancer on CT and is avid on PET. Differentiating it from lung carcinoma is important as it heralds a good prognosis and responds well to corticosteroid therapy(18).
20
Lung carcinoma is one of the most common causes of cancer related deaths, worldwide, in the last few decades and the global burden of disease study done in 2020 estimates that the economic burden of healthcare related costs for lung cancer and substantial (19). The incidence of lung cancer is 1.8 million (as of 2012) and is the responsible for 1.6 million cancer-related deaths that occur annually. It has a much lower five-year survival rate of 17.8% than most other causes of cancer (20).
In India, alone, it constitutes 6.9% of newly detected cases of cancer and 9.3% of deaths related to cancer, especially among males, with a rising trend among females. The disease also occurs more commonly in the elderly, with more than 70% of death occurring after the age of 65. The highest incidence is reported in the state of Mizoram (females and males) at age adjusted rates of 28.3 per 100,000 males and 28.7 per 100,000 females. The incidence of lung cancer has also risen in Metropolitan cities like Chennai, Bengaluru and Delhi (21). Although lung cancer is strongly associated with smoking, there is an increasing incidence of non-smokers who are affected by the disease. Adenocarcinoma is the most common
histological type among these patients who, more often, are females and in some Asian populations, constitute up to ~25% of the patients with lung cancer (22). The high incidence of pulmonary tuberculosis in India further increases the risk of lung cancer in the affected population due to the parenchymal scarring which occurs as a sequel to previous infection (23).
Histopathology
21
cigarette smoking. There has been a rising incidence of adenocarcinoma in the last few decades which has now overtaken squamous cell carcinoma as the most common type.
With rapid improvements in molecular techniques, it is now of increasing importance to identify specific genetic mutations associated with the different types of lung carcinoma. Epidermal growth factor is a protein that stimulates tyrosine kinase. Up to 15% of patients in the USA have tested positive for epidermal growth factor receptor (EGFR) mutations. Overexpression of this receptor due to mutations in the tyrosine kinase domain of the EGFR gene, leads to increase tumour growth. This mutation is most often seen in non-smoking females with adenocarcinoma. In these patients treatment with targeted therapy using monoclononal antibodies like erlotinib can increase the response rate up to 70%.
Other mutations of genes encoding K-Ras protein, anaplastic lymphoma kinase (ALK) have also been studied to develop targeted therapy for patients with these mutations.
Environmental risk factors for lung carcinoma Smoking
It is the most strongly associated risk factor which increases proportionately with the dose as confirmed in the landmark study by Doll and Hill (24). The tar and other components are carcinogenic which nicotine can promotes tumour growth.. It has been found that cessation of smoking decreases lung cancer risk (especially squamous cell and small cell carcinoma) which drops by 50% after a period of 15 years post cessation (25).
Pollutants and other carcinogens
22
associated with occupational lung disease, asbestos exposure (especially to chrysolite fibres) is a known risk factor for both lung and pleural carcinoma (26).
Influence of cell-type on radiological appearance of lung carcinoma
Up to 2% lung tumours can have varied cellular composition (27) and multiple synchronous primary lung tumours of various histopathological types can co-exist (28). Despite these discrepancies, certain radiological appearances suggest certain histological types of lung carcinoma.
Adenocarcinoma
This tumour most commonly presents as a peripherally located solitary pulmonary mass and is often associated with large hilar lymphadenopathy. Some of these masses, at the time of diagnosis, may show evidence of mediastinal involvement.
23
It may present as a superior sulcus tumour, also known as a Pancoast tumour. This variety often invades the adjacent visceral and parietal pleura and the chest wall. Horner’s syndrome (ptosis, miosis, enophthalmos and loss of ciliospinal reflex) with neck, shoulder pain and wasting of the lumbrical muscles is secondary to invasion of the superior cervical
[image:35.595.72.375.243.475.2]sympathetic ganglion and lower roots of the brachial plexus, respectively.
Figure 3: Consolidation in adenocarcinoma in situ
Adenocarcinoma in situ, formerly known as bronchoalveolar carcinoma, can show varied radiological appearances. It may present as a solitary pulmonary nodule in up to 43 %, consolidation or multicentric disease. Its presentation as diffuse consolidation can be explained by its unique pattern of growth, as it uses the alveoli as scaffolding stroma upon which it can grow and spread. Certain types of adenocarcinoma metastases (from primary tumours like the colon, pancreas and biliary tree) also may have a similar appearance.
24
another described appearance (29) characterized by a peripheral heterogeneously enhancing lung mass with central areas of lucency and irregular margins forming a star-like pattern.
Figure 4: "CT angiogram sign"
Figure 5: "Cheerios in the chest"- cavitatory pulmonary lesions
[image:36.595.72.377.134.371.2] [image:36.595.72.379.433.639.2]25
appears prominent against the background of consolidated lung with relatively lower attenuation. Other differential diagnoses for this radiological sign include pulmonary lymphoma and post-obstructive pneumonia (30)
Other radiological presentations include
Atelectasis
Expansile areas of consolidation without an air bronchogram
Multifocal cavitatory lesions (cheerios sign) which is unusual in adenocarcinoma in situ due to lower propensity to outstrip its blood supply and undergo necrosis and its tendency to preserve the pulmonary architecture (31).
Squamous cell carcinoma (SCC)
These tumours are most commonly central in location. They may originate from the epithelial lining of the main or lobar or segmental bronchi. They form proliferative growths which result in bronchial obstruction and subsequently erode the bronchial walls.
Intraluminal tumours cause bronchial obstruction and post-obstructive collapse of the respective lobes. The resultant volume loss results in ipsilateral mediastinal shift and
26
Squamous cell carcinoma and adenocarcinoma can be associated with scar tissue occurring as a result of previous tuberculosis and other conditions. Enlargement of the scar on follow up images must raise the suspicion of carcinoma at the site of the scar (31).
SCC can invade the surrounding structures in the mediastinum including the aerodigestive tract and encase the great vessels. These tumours also metastasize frequently to the bone, liver and adrenal glands by hematogenous spread.
Small cell carcinoma
[image:38.595.74.376.468.669.2]These are highly malignant neuroendocrine tumours which metastasize early in the course of the disease, hence harbour a relatively poorer prognosis. Most tumours are centrally located and associated with mediastinal lymphadenopathy. Less commonly, they may present as a peripherally located solitary pulmonary nodule, which carries a better prognosis.
27 Large cell undifferentiated carcinoma
These constitute nearly 10% of the cases of lung cancer. Histopathologically, they lack squamous, glandular or small-cell differentiation. These tumours grow rapidly, are large in size, often, peripherally located and associated with necrosis. They can potentially invade the pleura resulting in malignant pleural effusion and metastasize early.
Bronchial carcinoid
Bronchial carcinoid tumours are neuroendocrine lung tumours which originate in the bronchial or bronchiolar epithelium. They are typically endobronchial nodules or hilar or perihilar masses causing bronchial obstruction and post-obstructive collapse or consolidation. They show marked arterial phase enhancement due to rich vascular supply and may present with carcinoid syndrome due to secretion of various peptide hormones and neuroamines. (34). The peripheral, type, however, is a rare presentation, more commonly associated with smoking, that presents as a 10-30mm solitary pulmonary nodule with non-specific imaging features and are more often not associated with carcinoid syndrome. Although most cases are 18 FDG-PET avid, up to a fourth of these lesions may not show increased uptake(35).
Pulmonary lymphoma
28 Screening for lung cancer
Chest radiograph
It is the earliest tool used for lung cancer screening. Although cost-effective and readily available at most centres, it is limited by its lower sensitivity and specificity. A few trials, carried out in Japan studied the use of chest radiographs as a screening tool and concluded that, in conjunction with sputum cytology, it conferred some advantage in early cancer detection and 5-year survival rates over no screening, but with no overall advantage for long term (20 year) survival (37),(38).
CT screening
With the advent of low-dose techniques, the use of CT in screening for lung cancer has been extensively studies. These studies looked at high-risk populations. The first few studies performed in Japan (39). In these studies, follow up of detected nodules was based on size (large nodule were subject to biopsy/ FNAC, nodule of intermediate size were screened at defined intervals and very small nodules were not followed up). This, along with later studies like Henschke et al’s “Early Lung Cancer Action Project” (7) showed that lung cancer diagnosed at earlier stage using CT for screening had better treatment response and prognosis that those detected at later stages.
29
radiologist’s detection of nodules, while allowing the latter to use his/her discretion to deem them as clinically significant. Whatever be the technique, radiologists, world over use standard diagnostic and reporting guidelines like those laid out by the Fleischner Society.
Diffusion weighted imaging
Diffusion weighted imaging is a technique in MRI that is based on differential Brownian motion of water molecules in various tissue and helps evaluation the micro-architecture of these tissues. Intracellular water molecules have greater diffusion restriction than free water. Thus depending on the tissue architecture, degree of cellularity and the varying proportions of intracellular and extracellular compartments, the degree of diffusion restriction also varies between tissues and also between pathological areas within the a tissue against its normal background . Certain high grade malignancies and tissues that have undergone acute infarction show diffusion restriction due to the increased proportion of intracellular to extracellular water molecules. Diffusion weighted imaging thus helps qualitatively and quantitatively identify and measure diffusion restriction.
30
In order to obtain a DWI sequence, a diffusion sensitization gradient is applied on both sides of the 180 degree refocussing pulse. The ‘b value’ a measure of the degree of applied diffusion weighting. It is represented by the following equation –
b = γ² G² δ² (Δ−δ/3)
G = amplitude
δ = time of applied gradients
Δ = duration between paired gradients
Therefore, larger ‘b values’ may be obtained by widening the time interval between paired gradient pulses and increasing the duration and gradient amplitude.
Therefore, to detect smaller lesions and slower moving water molecules within their intracellular compartments, a higher ‘b value’ is considered more suitable (i.e. b= 500 to 1000 s/mm2). ADC values are calculated using a dedicated software and a parametric map generated which reflects the degree of diffusion restriction by drawing regions of interest (ROIs) on the map. An ideal choice of b value would be such that-
B value X ADC ~ 1.
Tissues with restricted diffusion are hyperintense in diffusion weighted images and hypointense on the corresponding ADC map. Accepted ADC values depend on the tissue being imaged and the pathology.
MRI techniques used for pulmonary diffusion weighted imaging
31
10 excitations produce good fat suppression and higher signal to noise ratio (SNR) than other techniques like breath hold techniques with 2 excitations and chemical shift selective pulse.
Application of DWI in lung malignancy
Malignant tumours have increased cellularity and are biologically aggressive. DWI has been used to help diagnose tumours in various organs in the body as a tool for both qualitative and quantitative assessment.
Qualitatively, the images can be visually assessed for relative increase in signal intensity of the lesion on comparison with normal tissue enabling both detection and, to some extent, characterization of the lesion (43). There have been a studies that have proven the effectiveness of DWI in helping visually, differentiate malignancy from post-obstructive lung collapse (44) and benign nodules (45) based on signal intensity. However, lesion characteristics were not typical of either and could not be used to differentiate between the two.
Quantitative assessment of the lesion can be done by ADC calculation, which is related to the diffusion of water molecules within the intracellular and extracellular components of the lesion. In most malignant lesions, the ADC values are reduced. This can be attributed to increased cellular density within the tissue. Additionally, the altered cell membranes, organelles, intracellular cytoskeleton and macromolecular composition also play a role in contributing towards diffusion restriction within these lesions. (46). Many studies have shown a significant relationship between low ADC values with renal, hepatic, prostate and certain brain tumours (47,48).
32
lesion to spinal cord ratio and compared with absolute ADC measurement of the lesions concluding that the latter showed better correlation (50).
A study conducted by Liu et al (50) recruited sixty two patients who underwent DWI for evaluation of benign and malignant pulmonary lesions and compared the signal intensity of the lesion with that of skeletal muscle (b=500 s/mm2) and found no statistically significant difference between benign and malignant lesions. However, Uto et al (2009) in their study of 67 patients compared lesion to spinal cord ratio (LSR) on DWI (b=1000 s/mm2) and ADC and
found that LSR > 1.135 was found to have an accuracy of nearly 85.7 % in diagnosing malignant lesions (51). Gumustas et al (2012) later conducted a study on 62 patients who underwent DWI and the absolute signal intensity of the lesion of interest (SI) was estimated on DWI ( b=1000) and signal intensity of >277 in malignant lesions showed a sensitivity of 93 %, specificity of 69 % and positive predictive value of 85 % (52).
Mori et al (2008), in a study including 140 pulmonary nodules, showed that lesions with an ADC less than 1.1x 10ˉ³mm²/s were significantly more likely to be of malignant etiology (53). Similarly Liu et al (2010) in a study including 66 patients with pulmonary nodules (12 benign and 54 malignant) showed that a cut-off ADC value of more than 1.4 x 10ˉ³ mm²/s to represent a benign lesion, showed a sensitivity of 83.3% and a specificity of 74.1% (50).
In the context of lung malignancies, the role of diffusion weighted magnetic resonance imaging in predicting the invasiveness of the NSCLC has also been assessed by Kanauchi et al (2009). In this study performed on a total of 41 patients with NSCLC (10 invasive and 31 non-invasive), the lesion to spinal cord ratio was found to be an independent predictor of invasive lung carcinoma with a sensitivity of 90% and a specificity of 81%. (54).
33
Presence of necrosis within both malignant and infectious lesions significantly alters the ADC value. Karaman et al(55) compared the wall/ necrosis ratio of benign infectious to malignant lesions and found the cut-off value of 1.12 showing sensitivity of 100% & specificity of 98% specificity for malignancy with good intra and inter-observer reliability.
Role of DWI and ADC in differentiating types of malignancy
In order to determine disease prognosis, staging and guide treatment, lung cancer can be classified as SCLS (small cell lung carcinoma) and NSCLC (non-small cell lung carcinoma). SCLS, apart from merely, its unique histopathological appearance and immune-histochemical markers, unlike NSCLC is more aggressive, often presents with metastases or para-neoplastic syndromes at the time of diagnosis and is associated with a poorer prognosis (56). There are also significant differences between the treatment options for both types. While surgery is the preferred treatment for stages 1- 3A for NSCLC, unresectable non-small cell carcinoma required chemo-radiation (57).
Therefore, it is of vital importance to obtain a histopathological diagnosis prior to initiating treatment. This, however, poses some challenges and limitations. Trans-bronchial biopsies for peripherally located lesions and those with a diameter < 2cm, sufficient representative samples may not be obtained and sensitivity (in case of negative bronchoscopy) could be as low as ~ 40% (58) and CT guided biopsy, although more suited for peripherally located tumours is fraught with complications like pneumothorax and haemorrhage.
34
cell surface and is activated by binding of its specific ligands, including epidermal growth factor and transforming growth factor α (TGFα). Mutations that lead to EGFR overexpression (up regulation) or over activity have been associated with a number of cancers. Without kinase activity, EGFR is unable to activate itself, which is a prerequisite for binding of downstream adaptor proteins. Ostensibly by halting the signalling cascade in cells that rely on this pathway for growth (EGFR tyrosine kinase inhibitors), tumour proliferation and migration is diminished. (59) .
Diffusion weighted imaging, carries the inherent advantage of being non-invasive and not exposing the patient to ionizing radiation, hence its importance increased further in patients who are unable to undergo biopsy. A study conducted by Matoba et al (2007) which recruited 30 patients with lung carcinoma showed a significant difference in ADC value in squamous cell carcinoma and large cell carcinoma compared to benign lesion ( p< 0.05), and a significantly higher ADC value in well differentiated compared to moderately and poorly differentiated carcinoma ( p<0.05) (60).
35
MATERIALS AND METHODS
Design of data collection:
• Outpatients and inpatients who undergo CECT thorax were identified.
• Those patients who satisfied the inclusion criteria for the study were identified and recruited after ruling out exclusion criteria and obtaining informed consent.
• MRI of the thorax was performed in the Radiology department with a Siemens 1.5 T MRI machine.
• The scan was reported by the principal investigator using a standardized format • Final diagnosis was obtained through biopsy, other corroborative investigations and
follow up.
• Patients without a definite final diagnosis or lost to follow up were excluded from the study.
Cases:
Patients with indeterminate pulmonary lesions based on CECT thorax in the time period between October 2016 and September 2018 (2 year period).
Methodology:
Forty seven consecutive patients with indeterminate pulmonary lesions detected on CECT thorax who fulfilled the selection criteria for the study underwent T2 weighted imaging, diffusion weighted imaging (b=0, b=500, b=1000 s/mm2) and ADC quantification after informed consent.
36
Patients >18 years of age who had undergone CECT of the thorax showing indeterminate pulmonary lesions
Lesion with greatest diameter > 1cm (nodules or mass or masses or cavity or consolidation) Reported as ‘could be infection or malignancy’
Exclusion criteria:
Patients who have already undergone biopsy of the lesion of interest that may alter the signal intensity of lesion on MRI.
Patients who have already undergone any treatment in the form of surgery or chemotherapy or radiotherapy or other medical treatment that may alter the pulmonary lesion.
Patients for whom MR imaging is contra-indicated due to the presence of aneurysmal clips, pacemakers, defibrillators that are not MRI compatible
Patients with severe claustrophobia, conditions that preclude ability to lie supine within the gantry (examples: severe orthopnoea secondary to pulmonary, cardiac or other causes), uncooperative patients or those requiring sedation or anaesthesia to undergo the procedure
Patients who have both infection and malignant lung pathology Patients with motion artefacts that would impair image interpretation
Outcome measures:
37
area devoid of necrosis or foci of air) was also visually compared to that of the thoracic skeletal muscle and noted as
1- hypointense 2- isointense 3- hyperintense
ADC map: Rounded or elliptical ROI with an area of at least 10mm² was chosen from the solid area of the lesion with no areas of necrosis or foci of air and another ROI from an area of necrosis if present in the lesion.
Study population recruitment: Sample size calculation:
Based on study of Gumustas Sevtap et al (20), the formula for comparison of means between the two groups
N = (Z
1-a/2 +Z
1-ᵝ
/2)
22 σ
2(M1 - M2)
2Z 1-a/2 = Z value for the required alpha error
Z 1-ᵝ/2 = Z value for the required beta error
σ = known standard deviation of the measure
38
N = Number of observations in each group (benign versus malignant) = 16 per group Sample selection:
The study was conducted in the Department of Radiology, Christian Medical College and Hospital, Vellore from the period between October 2016 and September 2018.
Forty seven consecutive patients were included in this MRI study of indeterminate pulmonary lesions who fulfilled the inclusion criteria without exclusion criteria. The patients took part voluntarily and signed the informed consent.
Sampling strategy:
40 Design of data collection:
Prospective observational study
Data sources:
The CECT thorax images and report of the patients who underwent scan in the department of Radiology were assessed by the principal investigator and guide for the presence of
indeterminate pulmonary lesions to identify cases to be included in the study.
The final diagnosis was obtained by histopathological examination of the biopsy specimen from the lesion obtained by image guidance or bronchoscopy or surgery and other
corroborative investigations like sputum smear or culture, blood culture, serum markers and by follow up imaging documentation of resolution of the lesion on treatment with antibiotics or steroid.
Thoracic MRI study:
Machine: 1.5T Siemens MRI machine
MRI sequences: With the patient in supine position, the following sequences were obtained: 1. Respiratory gated T2-weighted images were obtained in the axial plane using the
following parameters: TE/ TR-92/2000ms; matrix-324 x 384; slice thickness -6 mm; gap-0.6 mm.
2. Diffusion weighted images (DWI) was obtained with b values of 0, 500 and 1000 s/mm2
41
In the diffusion weighted images, the signal intensity of the lesion of interest (without necrotic areas or foci of air) was compared to that of the thoracic skeletal muscle as being hypointense, isointense or hyperintense.
Diffusion weighted images (b=0, b=500 and b=1000 s/mm2) were then taken and the lesion to spinal cord signal intensity ratio was then estimated.
ADC value was quantified from the regions of interest within the solid and necrotic
components of the lesion. The results were then compared to the final diagnosis obtained by biopsy, other corroborative investigations and clinical findings.
Personnel:
Reporting of T2 weighted, diffusion weighted images and ADC maps was done by the principal investigator and approved by the thesis guide (Professor).
The biopsy of the lesion was performed under bronchoscopic guidance (Pulmonary medicine department) or ultrasound or CT guidance (Radiology department)
The histopathological and cytological examination of the specimens were done be done by a pathologist (Pathology department)
The culture of the specimen was done in the microbiology department.
Statistical methods:
42
pulmonary lesions and their respective sensitivities and specificities were calculated. All the statistical analysis were performed using SPSS 16.0
Interpretation
43 RESULTS
The study comprised of a total of 47 patients with indeterminate pulmonary lesions detected on CECT of the thorax.
Demographic profile of the participants
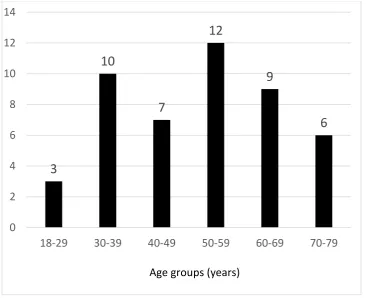
[image:55.595.70.437.320.618.2]The patients enrolled in this study were of the age group 24-79 years with mean age of 50 years. The largest group of patients were in the age group 50-59 years (Figure 7).
Figure 7: Column graph demonstrating age distribution of patients
Of the total of 47 patients enrolled, there were 32 men and 15 women. The patients for the study were referred from the departments of general medicine, pulmonary medicine and
3
10
7
12
9
6
0 2 4 6 8 10 12 14
44
medical oncology. The distribution of patients based on the department of referral is as given in Table 1.
Table 1: Distribution of patients enrolled in the study according to department of referral
Department of Referral No. of Patients Percentage (%)
General Medicine 8 17.02
Pulmonary Medicine 34 72.34
Medical Oncology 5 10.64
Total 47 100.00
Final diagnosis
Of the total of 47 patients, 43 underwent biopsy. The final diagnosis was obtained for 2 patients by confirmation on sputum culture and TB PCR test and for the remaining 2 patients on follow up imaging within a month showing significant resolution of the lesion on
treatment with short course of empirical non-antimycobacterial antibiotics.
Among the 43 patients who underwent biopsy, 32 underwent CT guided biopsy, 10
45
Figure 8: Distribution of patients according to method of biopsy (N=43)
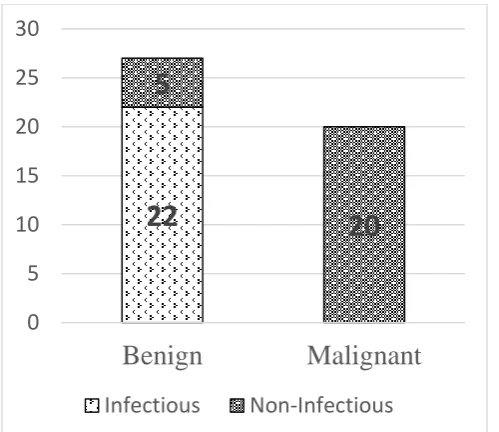
Of the 47 patients, the lesions in 27 patients (57.4%) were confirmed as benign and the lesions in 20 patients (42.6%) were confirmed as malignant.
Figure 9: Stacked column graph depicting division of patients based on diagnostic categories
32
10
1
0 5 10 15 20 25 30 35CT guided
Bronchoscopic
Thoracoscopic
46
Among the 20 patients with malignant lesions, the types of malignant lesions included were as noted in Table 2.
Table 2: Distribution of type of malignant pulmonary lesions based on biopsy (N=20)
Type of malignancy No. of patients Percentage (%)
Adenocarcinoma 11 55
Squamous cell carcinoma 4 20
Undifferentiated carcinoma 2 10
Lymphoma 2 10
Large cell carcinoma 1 5
Total 20 100
47
Figure 10: Distribution of infection based on the causative pathogen
Among the cases of non-infectious benign pulmonary lesions, there was 1 case of pulmonary amyloidosis and 1 case of IgG4 disease, the rest being non-specific inflammatory lesions.
Clinical Profile
The mean duration of symptoms was 9.31 and 7.70 months for benign and malignant lesion with no significant difference between the two groups (p = 0.637). 29.6% of the patients with benign pulmonary lesions and 40% of the patients with malignant pulmonary lesions had history of smoking. Three of the 11 cases of adenocarcinoma (27.2%) had history of smoking as compared to 3 of the 4 cases of squamous cell carcinoma (75%). The symptom profile of the patients included in the study and the distribution of smokers in each of these groups are as described in tables 3 and 4 respectively.
48
Table 3: Symptom profile of patient with benign and malignant pulmonary lesions
Table 4: Distribution of smokers versus non-smokers
Benign Malignant
Non-smoker 19 12
Smoker 8 8
Total 27 20
Symptom profile Benign Malignant
Cough 25(92.6%) 17(85%)
Expectoration 17(63%) 7(35%)
Chest pain 8(29.6%) 6(30%)
Breathlessness 16(59.3%) 10(50%)
Haemoptysis 16(59.3%) 7(35%)
Fever 9(33.3%) 5(25%)
Sig. weight loss 12(44.4%) 8(40%)
49 Characteristics of the pulmonary lesions on CT
[image:61.595.71.516.348.600.2]Of the 47 patients, the pulmonary lesion (in case of multiple, the largest lesion) were seen to be located predominantly in the right lung (59.5%)) and lower lobes (46.8%). Most lesions were solitary (73%)) and unilateral 91.5%). The average of the maximum diameters of the lesions was 5.28cm. 44.4% of benign and 25% of malignant lesions had areas of necrosis. Of the total of 47 cases, 40 (85.1%) had ipsilateral mediastinal lymphadenopathy, 34 (72.3%) cases had ipsilateral hilar lymphadenopathy, 10 (21.3%) had contralateral mediastinal lymphadenopathy and 2 (4.2 %) had contralateral hilar lymphadenopathy. 11 patients (23.4 %) had associated with pleural effusion.
Figure 11: Pie charts demonstrating the distribution of type of lesion in benign versus malignant lesions
50
lesions. The distribution of benign pulmonary lesions according to CT appearance is as shown in Table 5.
Table 5: CT appearance of benign lesions Final Diagnosis
Type of lesion Total
Nodule Mass Consolidation
Thick walled cavity
Tuberculosis 3 1 5 2 11
Fungal infection 0 1 1 1 3
Other bacterial infection 2 1 3 1 7
Non-specific inflammation 1 0 1 1 3
Hydatid 0 1 0 0 1
Amyloidosis 0 0 1 0 1
IgG4 disease 0 1 0 0 1
Total 6 5 11 5 27
51 Table 6: CT appearance of malignant lesions
Final Diagnosis Type of lesion
Total Nodule Mass Consolidation Thick walled cavity
Adenocarcinoma 2 3 6 0 11
Squamous cell
carcinoma 0 2 1 1 4
Large cell carcinoma 0 1 0 0 1
Lymphoma 0 1 1 0 2
Undifferentiated
carcinoma 0 0 2 0 2
Total 2 7 10 1 20
Characteristics of the pulmonary lesions on MRI
52
Table 7: Comparison of signal intensity of lesion to that of thoracic skeletal muscle in benign versus malignant pulmonary lesions on DWI with b=500 s/mm2
Signal Compared To Skeletal Muscle (b=500 s/mm2)
Total
p value Hypointense Isointense Hyperintense
Benign 1 7 19 27
0.590
Malignant 0 4 16 20
Total 1 11 35 47
Table 8: Comparison of signal intensity of lesion to that of thoracic skeletal muscle in benign versus malignant pulmonary lesions on DWI with b=1000 s/mm2
Signal Compared to Skeletal Muscle
(b=1000 s/mm2) Total
p value Hypointense Isointense Hyperintense
Benign 1 7 19 27
0.590
Malignant 0 4 16 20
Total 1 11 35 47
53
95% CI 0.97 to 0.24) and b= 1000 s/mm2 (p value= 0.001; 95% CI 1.06 to 0.29) and ADC value of the solid component (p value= 0.006; 95% CI 0.969 to 0.079 x 10⁻³ mm2 /s) as
demonstrated in Table 9.
[image:65.595.57.563.299.748.2]There was no statistically significant difference between signal intensity values of malignant and non-malignant lesions on b=500 s/mm2images (p value= 0.059; CI =105.22 to 2.04).
Table 9: Comparison of signal intensity of solid component of lesion, LSR and ADC of solid component between malignant & benign lesions using the independent sample T test (N=47)
N Mean SD p value 95% CI
Upper Lower
SI value on DWI (b=500 s/mm2)
Benign 27 132.17 86.49
0.059 105.22 2.04 Malignant
20 183.76 95.14 SI value on
DWI (b=1000 s/mm2)
Benign 27 72.01 38.11
0.002 80.69 18.13 Malignant
20 121.42 67.65
LSR(DWI b=500 s/mm2)
Benign 27 0.92 0.45 0.002 0.97 0.24
Malignant 20 1.52 0.78
LSR(DWI b=1000 s/mm2)
Benign 27 0.90 0.43 0.001 1.06 0.29
Malignant 20 1.58 0.86
ADC (sol.) (X 10-3 mm2/s)
Benign 27 1.438 0.465
0.006 0.111 0.621
54
55
56
Figure 14: Box plot showing significant difference in LSR on DWI (b= 1000 s/mm2) in benign versus malignant lesions (p value= 0.001; 95% CI 0.29 to 1.06)
The outlier values of 3.875 on LSR (b=500 s/mm2) and 4.111 on LSR (b=1000 s/mm2) were
57
Figure 15: Box plot showing significant difference in the ADC of the solid component in benign versus malignant lesions (p value= 0.001; 95% CI 0.111 to 1.621 x 10⁻³ mm2/s)
Of the 20 cases of malignancy, some malignant lesions like mucinous adenocarcinoma (2/4) and squamous cell carcinoma (2/5) showed ADC values higher than the said cut-off value and among the 27 cases of benign lesions, few cases of tuberculosis (2/11), fungal infection (1/3) and a case of amyloidosis showed ADC values lower than that of the cut-off.
Of the total of 47 cases, 12 of the 27 benign lung lesions and 5 of the 20 malignant lung lesions had areas of necrosis. There was found to be no significant difference in the apparent diffusion coefficient of the necrotic components in the two groups (p value= 0.132; 95% CI 1.393 to 0.201 x 10⁻³ mm2/s).
58
conditions like amyloidosis and IgG4 disease. There was found to be no significant difference in signal intensity on DWI for b=500 s/mm2 and b=1000 s/mm2, lesion to spinal cord ration
[image:70.595.65.532.303.705.2]for b=500 s/mm2 and b=1000 s/mm2 images or in the ADC values of the solid component of the tuberculous versus other benign lesions, as shown in Table 10.
Table 10: Comparison of mean signal intensity on DWI (b=500 and b=1000 s/mm2), LSR (b=500 and b=1000) and ADC (solid component) between tuberculosis and non-tuberculous lesions using the independent samples T-test (N=24)
N Mean
SD
p value
95% CI Upper Lower SI value on
DWI (b=500 s/ mm2)
Tuberculosis 11 107.87 75.679
0.233 110.13 28.11 Other benign lesions 16 148.88 91.756
SI value DWI (b=1000 s/mm2)
Tuberculosis 11 67.7 41.509
0.635 38.49 23.93 Other benign lesions 16 74.981 36.688
LSR (DWI b=500 s/ mm2)
Tuberculosis 11 0.937 0.449
0.853 0.337 0.40 Other benign lesions 16 0.903 0.465
LSR (DWI b=1000 s/mm2)
Tuberculosis 11 1.041 0.396
0.163 0.102 0.57 Other benign lesions 16 0.805 0.431
ADC (solid
component) x 10-3 mm2/s
Tuberculosis 11 1.326 0.430
0.307 0.56 0.18 Other benign lesions 16 1.515 0.486