Received: 11 April 2016 / Accepted: 1 July 2016
#The Author(s) 2016. This article is published with open access at Springerlink.com
Abstract Machining Glass fibre aluminium reinforced epoxy (GLARE) is cumbersome due to distinctively different mechanical and thermal properties of its constituents, which makes it challenging to achieve damage-free holes with the acceptable surface quality. The proposed work focuses on the study of the machinability of thin (~2.5 mm) GLARE laminate. Drilling trials were conducted to analyse the effect of feed rate and spindle speed on the cutting forces and hole quality. The resulting hole quality metrics (surface roughness, hole size, circularity error, burr formation and delamination) were assessed using surface profilometry and optical scanning techniques. A three dimensional (3D) finite-element (FE) model of drilling GLARE laminate was also developed using ABAQUS/Explicit to help understand the mechanism of drilling GLARE. The homogenised ply-level response of GLARE laminate was considered in the FE model to predict cutting forces in the drilling process.
Keywords Glare . Drilling . Delamination . Finite element analysis . Burr formation . Surface roughness
1 Introduction
GLARE composites are hybrid materials used in aeronautical applications where glass fibre/ epoxy prepregs and aluminium sheets are stacked in a desired sequence to achieve mechanical
* Khaled Giasin
1 Composite Systems Innovation Centre, Department of Mechanical Engineering, The University of
Sheffield, Sir Frederick Mappin Building, Mappin Street, Sheffield S1 3JD, UK
2
Advanced Manufacturing Research Centre with Boeing, The University of Sheffield, Advanced Manufacturing Park, Wallis Way, Catcliffe, Rotherham S60 5TZ, UK
3
properties best suited to the given loading scenario. This bonding significantly increases airworthiness of a resulting laminate, putting forward GLARE as a suitable candidate for use in aerospace applications where composites or metals alone may not perform. For example, fibre-reinforced composites (FRPs) are well known for their susceptibility to out-of-plane loadings due to feeble resin phase [1], while traditional metals undergo crack growth due to corrosion and fatigue. GLARE, on the other hand, offers significant improvements over these individual constituents by combining their advantages to provide superior performance including excellent fatigue and corrosion resistance, and improved tolerance to low-energy impacts. Notably, recent application of GLARE in the upper fuselage shell of the Airbus A380 offered 15–30 % weight savings over aluminium panels alone with significant improvement in fatigue properties [1].
As reported by SANDVIK tool manufacturer, typical hole demands when drilling com-posite metal stack materials requires achieving surface roughness values of 3.2μm or less in carbon fibre and 1.6μm or less in aluminium and titanium alloys, and no delamination or chip erosion on the composite by the metal material in the hole exit [2]. Holes drilled in metallic aerospace structure are commonly required to achieve an H7 hole tolerance fit based on the ISO 286 standard. This means that the hole should not vary more than ±12 μm but more relaxed tolerances such as H8 (±18 μm) or H9 (±30μm) were allowed to be used when drilling composites due to difficulty in achieving H7 tolerances, for example, SANDVIK recommends that drilled hole tolerance in a composite metal stack should be between ±20 and ±40 μm [2]. Drilling performance of GLARE has been previously studied where various aspects of machinability (such as quality of cut surface, borehole damage and drill wear were assessed [3]. The selection of appropriate cutting tool geometry in drilling GLAREs is of particular interest to a wider scientific community where a chip-breaker tool geometry is often employed to break Al chips into smaller pieces to improve tool life and negotiate its effect on the GLARE hole quality [3]. Regarding this, various studies focussed at drilling GLARE using a variety of cutting tools and cutting parameters suggested that the coated carbide drills perform better than those with no coating, and HSS drills [4–6]. Coesel [6] reported that solid carbide drills had better wear resistance than HSS drills using stable drilling machines and up to 3000 delamination free holes could be achieved using a single carbide drill. Whereas poor hole quality and delamination was observed prior drilling 150 holes. Uncoated and HSS tools are not suitable for machining GLARE since they are prone to excessive wear from abrasive glass fibre layers [6]. Tyczynski et al. [5] found that the cutting forces were affected by machining parameters and thickness of the GLARE laminate such that the cutting forces increased with the increase of feed rate and laminate thickness. A very recent study on drilling GLARE was conducted by Pawar et al. [4] compared four different types of solid carbide cutting tools with a 6.35 mm nominal diameter and found that the feed rate had the major influence on burr formation, while two facet twist drill outperformed the other cutting tools in terms of eliminating delamination.
complex drill-workpiece interaction and a ply-level homogenised response of GLARE.
1.1 Machine Setup and Cutting Parameters
Drilling trials were conducted on MORI-SEIKI SV-500 CNC milling machine with a maximum spindle speed of 10,000 rpm. Thrust force and torque were recorded using a piezoelectric multicomponent dynamometer (KISTLER 9255C). An 8-channel charge amplifier (type 5070 A) was connected to a data acquisition system (type 5697 A) as shown in Fig.1to capture the cutting forces. Dynoware software was used to analyse the recorded cutting forces data.
Dry drilling trials were conducted using three sets of spindle speeds and feed rates to ensure a full factorial design of experiment (refer to Table1). The tests were repeated two more times to confirm the repeatability of the experiment and averaged magnitudes of resultants are reported. A new cutting tool was used for drilling nine holes set to minimise any effect on tool wear, adhesions or built up edge (BUE). The tests were carried out without the use of any coolants since it was previously reported that cutting fluids are not required when drilling thin GLARE laminates if stable drilling machines are used along with carbide and solid carbide drills [6]. The ply orientation could possibly affect the selection of drilling parameters - in such case, a design of experiments could be conducted in the future with various combinations of ply orientations and drilling parameters which could indeed be expensive to pursue purely as an academic interest. The FE model developed in this study could provide a useful virtual tool to understand this, which is the next step of this study.
[image:3.439.54.393.462.604.2]1.2 Material Specification
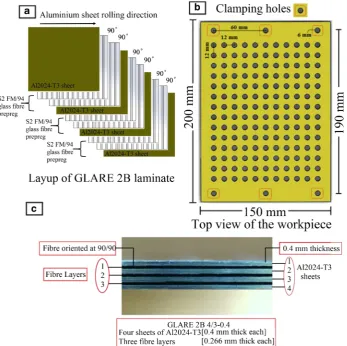
[image:4.439.48.395.68.120.2]A GLARE 2B 4/3–0.4 laminate was used in the drilling tests as shown in Fig.2. The sample was supplied by the Fibre Metal Laminate Centre (F.M.L. C) in Netherland. GLARE sample was cured in an autoclave for around 300 min at elevated temperatures of 120 °C and under a pressure of 6 bars [17]. This temperature and pressure levels guarantee that the resin
Table 1 Spindle speeds and feed rates used in the experiments
Levels Level 1 Level 2 Level 3
Spindle speed (rpm) 3000 6000 9000
Feed rate (mm/min) 300 600 900
[image:4.439.49.397.245.591.2]total thickness of the workpeice is approximately 2.42 mm. The properties of the fibres and the adhesive are shown in Table2.
The adhesive system plays a significant role in the bond strength between glass fibre layers and aluminium sheets of the GLARE laminate. GLARE is particularly useful when the structure is subjected to fatigue loading as aluminium alloys tends to resist crack initiated in fibrous plies, and glass fibres have high strain-to-failure. As far as the fibre/ply orientation is considered, the GLARE laminate studied here was designed mainly for bi-axial tensile load under cyclic conditions (fatigue and strength)–which is a main characteristic in GLARE 2 ply orientations, thus fibre/ply orientations of 90° in GLARE 2B meets the scope of this study.
The prepregs in each fibre layer are stacked symmetrically and are oriented at [90°/90°] with respect to the rolling direction of aluminium sheets defined as (0°), which gives GLARE laminate beneficial characteristics in fatigue and strength resistance [3]. Drilling trials were conducted using titanium aluminium nitride (TiAlN) coatedϕ6 mm high performance OSG HYP-HP-3D carbide twist drills which have a point angle of 140° and a helix angle of 30°. The total length of the drill is 66 mm and the flute length is 28 mm. The type of drill was chosen according to similar previous studies on drilling GLARE [4–6,19,20]. It is also one of the most common sizes used for making holes in aerospace parts and holes drilled in Airbus A380 structures [20].
1.3 Hole Quality Analysis
1.3.1 Entrance and Exit Burr Formations
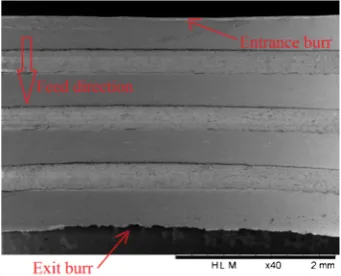
[image:5.439.47.393.538.614.2]The quality of drilled hole was inspected for burr formation - the entrance and exit burr height and burr root thickness were measured using Mitutoyo SV-602 surface roughness device at 0, 90, 180 and 270 degrees around the hole circumference as shown in Fig.3. Their average was taken for the final burr measure.
Table 2 Mechanical properties of the glass fibre adhesive system in GLARE laminates [3]
Property S2-glass fibres FM94 adhesive system
Thickness (μm) 10
-Strength (MPa) 4000 ±50
Stiffness (GPa) 88 ±1.7
1.3.2 Surface Roughness
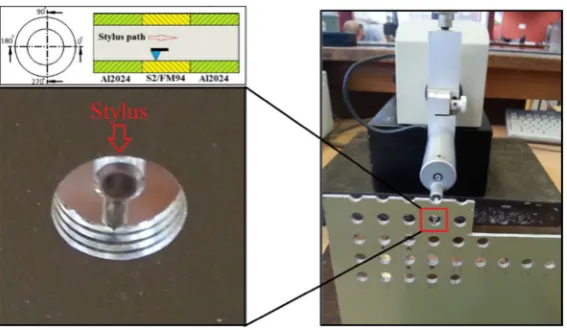
Surface roughness is the measurement of a surface texture or finish to detect surface irregu-larities due to manufacturing processes such as machining operations. In case of composites, such as GLARE–this is predominantly governed by the presence of abrasive glass fibres. The selection of inappropriate cutting parametrs can leave behind pulled/uncut fibres and/or resin pockets on the cut surface. Thus surface roughness in composites machining is indeed an important parameter to assess the part quality. In this case, roughness of the borehole surface was measured using Mitutoyo SV-602 surface profilometer device as shown in Fig.4 at 0, 90,180 and 270 degrees around the hole in the direction of the feed by rotating drilled sample along its edges– averaged Ravalues at these positions were considered (refer to Fig. 4).
Arithmetic average roughness or Rais the arithmetic average height of roughness-component
irregularities (peak heights and valleys) from the centreline, measured within the sampling length (hole depth). It should be noted that the measured surface roughness is a combination of the surface roughness of the aluminium sheets and the glass fibre layers together.
1.3.3 Scanning Electron Microscopy (SEM)
The SEM technique was employed to analyse drilling induced damage to the bore wall surface, if any. Each hole was cross-sectioned from its centre and was cleaned using acetone in an ultrasonic bath for ten minutes to remove glass fibre dust and any debris on the surface of the borehole. The samples were then placed on the top of a carbon sticker and inserted inside the SEM chamber for surface inspection as shown in Fig.5(a) and (b). The SEM scanning was conducted using Hitachi HM3030 plus tabletop microscope. A 40-100X magnification was applied to view the alternating layers of aluminium and glass fibre. The mixed mode observation condition was selected to scan the borehole surface of GLARE laminate due
[image:6.439.76.362.50.265.2]to its stacked structure, the mixed mode is more efficient for analysing images with dual signals, which allows for better visualisation of GLARE constituents and adhered particles on their surfaces.
1.3.4 Hole Size and Circularity Error
Drilling holes in composite-metal stacks used to make parts of wing or tail plane structures require tight diameter tolerances of 30μm or lower [22]. Hole size and circularity error were measured to evaluate the accuracy of drilled holes. The circularity is a geometrical tolerance which indicates how close a section of a cylindrical part is to a true circle [23]. The circularity error was measured using the maximum inscribed circle (MIC) method. The MIC is defined as the circle with largest radius which can be fitted inside the hole profile as shown in Fig.6. The circularity error is then calculated by subtracting the maximum hole radius which can fit the
Fig. 4 Surface roughness measurement process setup showing the positions of the stylus on the borehole surface
[image:7.439.79.363.51.216.2] [image:7.439.165.394.413.614.2]hole profile (Rmax) and the MIC radius (Rmin). The parameters were measured using
SHEFFIELD CORDAX D8 CMM machine available in SANDVIK COROMANT, Sheffield. The measurements were carried out using a 2 mm ruby ball probe at depths 0.252 mm and 1.75 mm below the surface of the hole at drill entry and they are referred to in the paper hereafter as top and bottom. The scanning speed of the probe was set to 1 mm/s which allowed it to capture 400 points while scanning around the borehole surface.
1.3.5 Delamination
The glass fibre layers were inspected for drilling induced delamination around the hole edges in glass fibre layers using X-ray microcomputer tomography (μCT) scanning technique using Nikon Metrology’s XTH 225 ST scanner. The X-ray voltage and current were set at 135 kV and 105 mA, respectively. The sample exposure time was 1000 ms per projection with a total number of 3300 projections and two frames per projection. Nikon Metrology Inspect-X and XT CT Pro/CT agent were used for setting up the scanner and reconstruction of CT volume. Volume graphics Gmbh (VG 2.2) software was used for analysis of the reconstructed volume and to capture the images for delamination analysis of the composite layers. The delamination factors - FA(ratio of delaminated area to the nominal hole area) or FD(ratio of diameter of
delamination considering the extremities of surface damage contour to the nominal hole diameter) are often used as a measure of the surface delamination in the drilling of composites [25]. Most of the previous studies, consider use a highly conservative approach of FDto assess
surface delamination [26–28] due to the challenges in measuring the delaminated area around the drilled hole using a standard optical microscope.
Here, surface delamination factor was assessed using FAapproach. The scanned optical
images fromμCT were processed using a commercial software package -Image J. Figure7
illustrates the step-by-step approach to calculate the delaminated area in the vicinity of a typical drilled hole (noted as Da1 and Da2 in Fig.7).
2 Experimental Results
The experimental results consist of analysis of cutting forces (thrust force and torque) and hole quality matrix–including burr formation, hole size and error of circularity, surface roughness,
[image:8.439.49.394.59.186.2]delamination analysis and damage analysis of borehole surface. The results regarding cutting forces are discussed first.
2.1 Cutting Forces Analysis
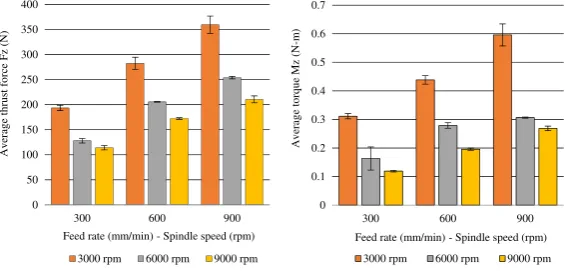
The cutting forces analysis was carried out to evaluate the impact of spindle speed and feed rate on thrust force and torque, it was observed that the average thrust force and torque increased with the increase of the feed rate and decreased with the increase of spindle speed as shown in Fig.8. The maximum and minimum cutting forces were obtained when drilling at
n= 3000 rpm andf=900 mm/min andn= 9000 rpm andf=300 mm/min, respectively. It was also observed that when drilling at spindle speed and feed rate ratio of (0.1 mm/rev), the thrust force increased with spindle speed and feed rate, indicating that increased throughput could be achieved, though at the expense of increased cutting forces.
The thrust force ranged between 114 N and 360 N and torque ranged between 0.118 N-m and 0.595 N-m within the range of studied cutting parameters. When the feed rate was
Fig. 7 Steps for delamination image processing and measuring the delamination factor
0 50 100 150 200 250 300 350 400
300 600 900
Ave
ra
ge
thr
ust forc
e F
z
(N
)
Feed rate (mm/min) - Spindle speed (rpm) 3000 rpm 6000 rpm 9000 rpm
0 0.1 0.2 0.3 0.4 0.5 0.6 0.7
300 600 900
Av
era
g
e to
rq
u
e
Mz
(N
-m
)
Feed rate (mm/min) - Spindle speed (rpm) 3000 rpm 6000 rpm 9000 rpm
[image:9.439.65.378.47.247.2] [image:9.439.79.362.471.606.2]increased from 300 mm/min to 900 mm/min at a spindle speed of 3000 rpm, the thrust force and torque increased by 85.5 % and 91.3 % respectively. On the other hand, when the spindle speed was increased from 3000 rpm to 9000 rpm at a feed rate of 900 mm/min, the thrust force and torque reduced by 70.6 % and 122 % respectively.
Figure9shows a thrust force profile for hole drilled atn= 3000 rpm andf=300 mm/min. The force profile shows the multi-layered structure in GLARE laminate. The force required for drilling Al2024-T3 sheets is higher than that required for drilling through glass fibre layers. This is related to the fact that the Al2024-T3 have higher stiffness and the ultimate failure strain compared to the glass fibre layers [29]. For the studied GLARE stack, the drilling process can be divided to three stages as shown below:
1. The drill enters the first aluminium sheet and glass fibre layer, at this stage the thrust force rise linearly until the cutting tool becomes in full contact with the workpiece.
2. A full engagement of drill with the GLARE laminate - this stage takes place approxi-mately after drilling through the first layer of glass fibre until drill contacts the third aluminium sheet in the stack. It can be observed that the thrust force reached its peak and is nearly constant.
3. Drill exits GLARE laminate- this stage starts from the third glass fibre layer until the cutting tool exits the workpiece.
Comparing cutting forces results with the ones from our previous work on drilling thicker GLARE laminates from the same grade (GLARE 2B 11/10 and GLARE 2B 8/7) [30]. Both torque and thrust force increased with the increase of workpiece thickness, which could be due to improper conditions of chip evacuation and increased heat which could in return increase the cutting forces [31]. The change of hole depth is more pronounced on the torque than the thrust force due to the elastic recovery of the cylindrical surface of the hole, the surface of the cutting tool is continuously subjected to normal stresses while drilling through the workpiece, the greater the surface area means larger forces will be acting on the periphery of the drill leading to significant increase in torque [32].
2.2 Hole Quality Analysis
2.2.1 Burr Formations
The average entrance and exit burr height and thickness under different spindle speeds and feed rates, as shown in Fig.10(a) and (b), respectively. The exit burrs were always prominent than at entrance burrs as shown in Fig.11. Entry burr height ranged from 5.61 to 11.95μm, and between 17.03 to 59.15μm at exit. Entry burr thickness ranged from 78.25 to 107.34μm, and between 150.25 to 372.58μm at exit. Uniform burr without cap was observed at the hole edges while drilling GLARE, which could be due to the use of coated cutting tools that were previously reported to improve the shape of the formed burrs [33].
measured exit burr heights were similar to those reported by Abdelhafeez et al. [34] when drilling Al2024-T3 alloy and smaller from results reported by Pawar et al. [4] when drilling GLARE laminates, which could be due to the large point angle of the drill bit (140°) used in the current study since it was previously reported that drills with large point angle reduce burr formations when drilling aluminium alloys [35,36].
2.2.2 Hole Size and Error of Circularity
The holes produced under all cutting parameters were oversized at both top and bottom locations. Figure10 (c) and (d) show the average hole size and average circularity at top and bottom locations, respectively. The feed rate seemed to have the major influence on hole
0 10 20 30 40 50 60 70 80 a b c d
300 600 900 300 600 900 300 600 900 3000 6000 9000
A ve ra ge bur r he ight ( u m )
Feed rate (mm/min) - Spindle speed (rpm) Entrance Exit 0 50 100 150 200 250 300 350 400 450
300 600 900 300 600 900 300 600 900 3000 6000 9000
A ve ra ge bur r root thic kness (um )
Feed rate (mm/min) - Spindle speed (rpm) Entrance Exit 5.995 6 6.005 6.01 6.015 6.02
300 600 900 300 600 900 300 600 900 3000 6000 9000
A ver age hole si ze (m m )
Feed rate (mm/min) - Spindle speed (rpm) top bottom 0 5 10 15 20 25
300 600 900 300 600 900 300 600 900 3000 6000 9000
A v er ag e ci rc ular ity e rr o r (um )
[image:11.439.166.393.52.163.2]Feed rate (mm/min) - Spindle speed (rpm) top bottom
[image:11.439.77.364.339.596.2]size. At both – top and bottom- locations, the hole size increased with feed rate increase betweenf= 300 mm/min andf= 600 mm/min and decreased with it atf= 900 mm/min. It was also observed that the holes oversize was greater at bottom in most holes with the exception of holes drilled atn= 3000 rpm andf= 300 mm/min andf= 900 mm/min, andn= 3000 rpm and
f = 600 mm/min, which be attributed to the cutting vibration and the instability of the workpiece as the feed rate increased [37].
It was reported in one of our previous studies that the hole size is likely to shrink with depth when drilling GLARE fibre metal laminates [19]. However, the relatively smaller thickness of the laminate used for the current study might not allowed for the promotion of high cutting temperature enough to cause a significant reductions in hole size at both locations. The increase in hole size at top ranged between +16.01 μm and +4.453 μm, and between 1.249μm to 14.239μm at bottom which means that they are within the recommended range of hole size tolerance required for aerospace structures. The circularity at top was always greater than at bottom with an exception of hole drilled atn= 6000 rpm andf= 600 mm/min. The maximum circularity at top and bottom were obtained when drilling atn= 3000 rpm and
f= 600 mm/min andn= 6000 rpm andf= 600 mm/min, respectively. The minimum circularity error at top and bottom were obtained when drilling atn= 6000 rpm andf= 600 mm/min and
n= 6000 rpm andf= 300 mm/min. The circularity error at top ranged between 10μm up to 19.59 μm and between 7.3μm to 14.07 μm at bottom. The results were similar to those reported by Abdelhafeez et al. [34] when drilling Al2024-T3 alloy.
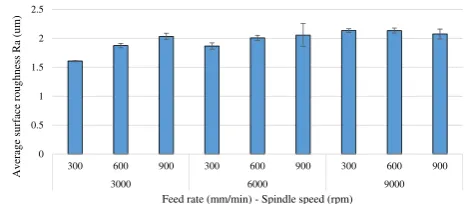
2.2.3 Surface Roughness
[image:12.439.222.393.54.192.2]The surface roughness measured is a combination of the surface roughness of aluminium sheets and glass fibre layers. The average surface roughness increased with the increase of the feed rate and the spindle speed as it can be observed from Fig.12and was in the range of 1.6–2.13μm. Nouari et al. [38] previously reported that when drilling Al2024 alloy using a 6 mm drill, increasing the spindle speed from 25 m/min (1326 rpm) to 165 m/min (8754 rpm) resulted in drilling temperatures on the workpiece to rise from 80 to 175 °C. The high rise in temperature is considerably greater than the glass transition temperature of the FM94 adhesive epoxy of 103 °C in dry conditions [3] and softens aluminium sheets leads to rubberising effect and increased deformations during drilling that increases the surface roughness of the hole. The lowest surface roughness was obtained when drilling at low spindle speed and feed rate ofn= 3000 rpm andf= 300 mm/min, respectively. Increasing the feed rate from 300 mm/min to 900 mm/min at constant
spindle speeds of 3000 and 6000 rpm increased surface roughness by 26.8 % and 10.2 % respectively, and decreased by 2.75 % when increasing the feed rate at spindle speed of 9000 rpm. Increasing the spindle speed from 3000 rpm to 9000 rpm at constant feed rates of 300, 600 and 900 mm/min increased surface roughness by 33.1 %, 7.3 % and 1.97 % respectively. Comparing surface roughness results with the ones from our previous work on drilling thicker GLARE laminates [30] showed that the surface roughness is likely to be slightly higher in thinner samples with the increase of feed rate. At spindle speed of 3000 rpm, the surface roughness was higher in thinner laminates, while at spindle speeds of 6000 and 9000 rpm, the surface roughness tended to be higher in thicker laminates which could be due to the increase in cutting temperatures and vibrations with depth.
2.2.4 Hole Condition Using Optical Microscopy
The visual inspection of drilled holes indicated their tendency to deteriorate with the increase of spindle speed and feed rate. The hole edge condition at the entrance was better than at the exit which indicates that hole quality might decrease with drilling depth.
2.2.5 Delamination Analysis
However, the size of delamination around the hole edges and its variation with cutting parameters was negligible (less than 1 %) as shown in Fig.13. For example, when the feed rate was increased from 300 mm/min to 900 mm/min at a constant spindle speed of 9000 rpm -the delamination factor increased only by 0.05 %. While increasing -the spindle speed from 3000 rpm to 9000 rpm at a constant feed rate of 300 mm/min, showed that the delamination factor increased by 0.11 %. It is envisaged that this effect is caused by the presence of Al sheets in the GLARE laminate–i.e. Al sheets act as backup structure for glass fibre prepregs locally, which effectively prevents their out-of-plane bending resulting in inferior normal forces. The
0.9940 0.9960 0.9980 1.0000 1.0020 1.0040 1.0060 1.0080 1.0100 1.0120 300 (1) 300 (2) 300 (3) 300 (1) 300 (2) 300 (3) 600 (1) 600 (1) 600 (1) 300 (1) 300 (2) 300 (3) 900 (1) 900 (1) 900 (1)
3000 9000 6000 9000 9000
D elam ina tion F ac tor F a
[image:13.439.161.394.52.154.2]Feed rate (mm/min) - Spindle speed (rpm)
Fig. 13 Delamination factor Fa
[image:13.439.167.393.511.607.2]aluminium sheets act as a backup structure and help reducing the risk of entry and exit delamination [39]. Inspecting every glass fibre layers in each of the scanned drilled holes showed that surface delamination was negligible and increased with depth. In fact, some of the inspected layers were damage-free which could be attributed to the alternating composite-metal structure of GLARE.
Additionally, the glass fibre layers did not show any intralaminar cracking or fibre-matrix debonding. However, it was observed that delamination was localised at approximately +45° and−45° degrees with respect to fibre orientation specific regions around the hole edge (refer to Fig.14(a)). The observed delamination was small and increased with increasing the feed rate. The feed rate seems to be the most critical parameter on delamination which influences the peel up and push down delamination.
2.2.6 Scanning Electron Microscopy Analysis
Figure15shows SEM images of borehole surface drilled at different spindle speeds and feed rates. The superior surface quality was achieved when drilling at low spindle speed and feed rates. The SEM inspection did not reveal any separation in the glass fibre layers or debonding between the glass fibre layers and aluminium sheets (see Fig.15(a) and (b)).
[image:14.439.78.363.337.592.2]However, the hole edge quality was affected: edge chipping (fracture) and uncut fibres (spring back following tool retraction from the workpiece) were observed on some of the surfaces of glass fibre layers when drilling at high spindle speeds and high feed rates, in addition feed marks were observed on the aluminium sheets (see Fig.13(c) and (d)).
3 FE Model
3.1 Modelling Material Response
The FE model of drilling process of GLARE requires the implementation of two different material models - one for the Al2024-T3 sheets and another for the glass fibre layers. The following sections summarise the material models used to simulate mechanical response and material removal of each of the GLARE constituents.
3.1.1 Modelling Damage in Al2024-T3 Sheets
The Johnson Cook model was used to simulate elastic-plastic response with strain-based hardening shown in Eq. (1) and the damage resulting in gradual stiffness shown in Eq. (2) in Al2024-T3 sheets [40]. Eq. (1) relates the flow-stress (σ) in the aluminuim sheets as a function of the strain-hardening in the elastic-plastic region and is given in the following form:
σ¼ AþB εpl
n
h i
1þCln ε :pl
ε˙
0 ! " #
1− T−Tr Tm−Tr
m
ð1Þ
Where A, B, C, n and m are material constants that were obtained by torsion tests [40]. A corresponds to the initial yield stress, B is the hardening modulus, C is a dimensionless strain-rate dependency coefficient, n and m are power exponents of the strain work-hardening and thermal softening coefficient, respectively.
εplis the plastic strain,εpl
[image:15.439.78.364.53.286.2]ε0 is the dimensionless pressure-deviatoric stress ratio,εpl and ε0 are equivalent plastic strain rate and the reference strain rate, respectively. T, Tr
and Tm are current temperature, room temperature and melting temperature of the
material, respectively. The material constants used in this study were taken from a previous study focussed at modelling the high-strain-rate response of Al2024-T3 alloy and shown in Table 3.
The Johnson–Cook ductile damage criteria available in ABAQUS/Explicit was used to simulate the damage initiation in Al2024-T3 [42]. The equivalent plastic strain at the onset of damageεplD is calculated using the following equation:
ε
pl
D ¼½d1 þd2expð−d3ηÞ* 1þd4ln ε
:pl ε˙
0
! " #
1þ T−Tr
Tm−Tr m
ð2Þ
Whered1,d2,d3,d4andd5are failure parameters used to calculate the overall damage in
the material, η is stress triaxiality η¼−P q
,P is the pressure stress and q is the Mises
equivalent stress. The Johnson-Cook constitutive material model and damage model param-etersd1−d5of Al2024-T3 alloy are given in Table4. Damage evolution defines the material
behaviour post damage-initiation and calculates the rate of degradation of the material stiffness once the stress-based damage-initiation criterion is satisfied.
The damage evolution equation can be defined using the effective plastic displace-mentupl, this (refer to Eq.3) takes into account the characteristic length of the elementL
to ensure sensitivity of mesh to the damage is minimized after damage initiation as shown in Eq. (3):
u
:pl¼Lε:pl ð3Þ
upl is the plastic displacement rate. The damage evolution of the variable with the relative
plastic displacementdis used in its linear form. It assumes a linear evolution of the damage variable with sufficient plastic displacement. The damage variable increase according to Eq. (4) [42]:
d¼Lε
:
pl
u
pl f
¼ u:
pl
u
pl f
ð4Þ
uplf is the effective plastic displacement at failure (full degradation), :upl is the effective plastic displacement rate. Finally, the meshed element is deleted once the material stiffness is fully degraded basd on Eq. (5). Such deleted elements do not contribute to stiffness matrix any further to avoid interpolation based errors. The reduced stiffness (Ed)of degraded material was
[image:16.439.46.393.575.615.2]then calculated using an isotropic damage parameterD(refer to Eq.5) such that0 <D< 1,D= 0 condition refers to perfectly intact material whileD= 1 to fully degraded material–where
Table 3 Mechanical properties of Al2024-T3 used in FE simulations of drilling [41]
Densityρ, (Kg/m3) Elastic modulus E, GPa Poisson’s ratio,ν Melting temperature (C)
Ed¼ð1−DÞ:E ð5Þ
3.1.2 Modelling Damage in Glass Fibre Layers
ABAQUS/Explicit possesses the ability to model progressive damage and failure of composites using the built-in 2D Hashin damage model. However, this built-in damage model can be only used with elements that have a plane-stress formulation (plane stress, membrane, and shell elements) [42]. Therefore, a user-defined material subroutine (VUMAT) was used to extend the capability of the 2D built-in composite damage model in ABAQUS for elements with 3D stress states. The damage formulation in glass-fibre layers in GLARE has been incorporated into a VUMAT user-defined material subroutine using FORTRAN compiler. The VUMAT accounts for damage through the thickness and requires the definition of 19 material constants.
The VUMAT subroutine was initially developed to simulate the damage caused by the impact of a projectile on a unidirectional carbon fibre reinforced plate [42]. The primary assumption in the VUMAT subroutine is that elastic stress-strain relations are given by damaged orthotropic elasticity, and the behaviour of the undamaged material is assumed to be linearly elastic similar to that in Al2024-T3 as shown previously in Eq. (5). Additionally, the primary elastic constants are functions of the undamaged Young’s moduli and Poisson’s ratios. The initial failure can start in any of the glass fibre layers of the laminate. Once the damage initiation takes place, the stiffness degradation begins. The Hashin failure criterion was used to predict fibre damage in tension and compression modes. While the Puck’s failure criterion was used to predict matrix failure in tension and compression modes. The use of puck criterion for matrix failure provides a better prediction of matrix material damage for transverse compressive bending [42]. The failure in the glass-fibre layers can happen due to any of the failure modes mentioned previously. The damage initiation criteria are as below:
Hashin's fibre tensile failure (σ11≥0)
σ11
X1t 2
þ σ12
S12
2
þ σ13
S13
2
¼1; dft¼1 ð6Þ
Hashin's compressive tensile failure (σ11< 0)
σ11
j j
X1c
[image:17.439.43.395.68.109.2]Puck 'smatrix tensionand compression failure
σ11
2X1t 2
þ σ222
X2t: X2c
j jþ
σ12
S12
2
" #
þσ222
1
X2tþ
1
X2c
¼1
σ22þσ33>0; dmt¼1 σ22þσ33< 0; dmc¼1
ð8Þ
Whereσ11,σ22,σ12,σ13 in Eqs. (6), (7) and (8) are components of the effective stress
tensor. X1t, X2t, X1c, X2care the tensile and compression strengths in the longitudinal and
transverse direction with respect to the fibres. S12, S13are the shear strength in 12 and 13
planes. Four damage variables are introduced in the model- two associated with fibre tension and compression (dft and dfc) and the other two associated with matrix tension and
compres-sion (dmtanddmc) as shown in Eq. (9).
df ¼1−ð1−dftÞ 1−dfc
dm¼1−ð1−dmtÞð1−dmcÞ ð9Þ
These four damage variables are used to define global fibre and matrix damage variables to compute the damaged stiffness matrix. The elements were removed from the mesh when any of the four damage variables reaches maximum damage conditiond=dmax= 1. These meshed
elements offered no subsequent resistance to deformation [43]. The general contact algorithm is used to model the contact and interaction between the cutting tool and the workpiece, and the workpiece with itself to allow for element-deletion once they are fully damaged. The material properties of S2 glass fibre used in FE analysis were obtained from previous studies and as shown in Table5and Table6. Where E11, E22, E33, G12, G13, G23are elastic and shear
moduli in the fibre and transverse directions respectivley.ν12,ν13andν23are possion ratios in
plane 1–2 , 2–3 and 1–3, repsectively.
First order hexahedral elements with one-integration point (type C3D8R) were used to mesh aluminium and glass fibre layers. A local coordinate system with its local X-axis along the principal direction of glass-fibre and the local Z axis – along the stack thickness was created. This coordinate system was used to define the ply orientation and assign the material properties for each unidirectional lamina in 3D space.
3.2 Setup of FE Model
3.2.1 Drill-Workpiece Setup and Boundary Conditions
[image:18.439.46.394.568.615.2]The FE model consisted of a twist drill and a square-shaped GLARE workpiece. The GLARE workpiece was constructed in ABAQUS as shown in Fig. 15 (a). The dimensions of the
Table 5 Mechanical properties of S2-FM94 lamina [44]
Density (Kg/m3)
E11(GPa) E22(GPa) E33(GPa) G12(GPa) G13(GPa) G23(GPa) ν12 ν13 ν23
meshed region in the immediate vicinity of the drill and gradual coarser mesh away from it (refer to Fig.15).
The CAD model of drill was imported to ABAQUS and meshed as shown in Fig.16(c) and (d). The twist drill was considered rigid as it possesses significantly higher elastic stiffness than either of GLARE constituents. This trade-off resulted in significant computational time savings. The drill was constrained in X and Y directions and was only allowed to move and rotate along its feed axis. A translational (feed rate) and rotational velocity (torque) were applied at the tip of the drill through a rigid body reference point. Only a part of the whole drill is used in the FE models (see Fig.16(a)). Rigid triangular facet elements (R3D3) were used to mesh the cutting tool with a total 13,663 elements. The refined mesh was applied on the cutting edges and the chisel edge of the drill where the cutting process will take place with the workpiece material.
3.2.2 Mesh Study
[image:19.439.47.394.69.118.2]3.2.3 Contact, Loading and Boundary Conditions
The general contact algorithm available in ABAQUS was used to define the interaction between the mating surfaces that of the cutting tool and the workpiece during the drilling process. The general contact allows the use of element-based surfaces to model surface erosion for analyses [42]. Two contact behaviours were defined, a tangential behaviour and normal behaviour. The tangential behaviour is defined using a penalty friction formulation with no shear stress limit and infinite elastic step stiffness. The normal behaviour was defined using the hard contact pressure over closure. The basic concept of the Coulomb friction model was used to relate the maximum allowable frictional (shear) stress across an interface to the contact pressure between the contacting bodies [42]. Previous studies reported that the friction coefficient in TiAlN coating at room temper-atures was in the range of 0.7–1 during sliding against various counter face materials [46,
[image:20.439.78.361.328.593.2]47]. In addition, the tribological behaviour of TiAlN coatings reported that it had a coefficient of frictionμ= 0.7 [48]. Previous studies on modelling the machining process of Al2024-T alloy used coefficient of friction between 0.3 and 0.7 [30, 49–51]. Therefore, the coefficient of friction of 0.7 was selected after a vigorous mesh study where it was varied from 0.4 to 0.8 used in previous studies. This value also gave FE results close to those tested at cutting parameters of 6000 rpm and 600 mm/min used in the mesh convergence study [30].
accurately with 13.1 % and 9.8 % deviation from the experimental test results.
4.2 Thrust Force and Torque Results
Figure17(a) and (b) show the comparison of the average thrust force and torque between the experimental and FE results. The thrust force results from the simulations were overestimated compared with the experimental data. The discrepancy with experimental results was small as 3.2 % for thrust force at n=3000 rpm and f=900 mm/min, and 0.83 % for torque at n= 6000 rpm andf=300 mm/min. However, it was observed that this discrepancy in FE predic-tions was significant at low feed rates and high spindle speeds with thrust force overestimated by more than 50 % when drilling atn= 9000 rpm andf=300 mm/min. This could be due to the inadequacies of the element-deletion criteria used in either material damage models. Figure18
(a) and (b) show the FE thrust force and torque profiles obtained from FE models compared to those obtained from experimental data under same cutting parameters. The FE results showed similar trends in cutting forces profiles when compared to the experimental data.
The overestimation in thrust force prediction in the FE models can be due to several reasons, first the strengths and failure energies in different directions at high strain rates (as expected in material removal processes such as the drilling process) for modelling damage behaviour of homogenised composite ply is not well documented in the literature. Furthermore most of such studies focusing on the high strain-rate behaviour of composites are primarily conducted using uniaxial tension, compression or torsion tests [15,40,52]. Drilling mainly induces bending stresses locally on the workpiece during its entry and exit; though in the absence of suitable data
0 50 100 150 200 250 300 350 400 a b
300 600 900 300 600 900 300 600 900 3000 6000 9000
A v era ge thr u st forc e ( N )
Feed rate (mm/min) - Spindle speed (rpm) Experimental FE 0 0.1 0.2 0.3 0.4 0.5 0.6 0.7
300 600 900 300 600 900 300 600 900 3000 6000 9000
Av erag e t o rq u e (N-m )
[image:21.439.80.361.465.604.2]Feed rate (mm/min) - Spindle speed (rpm) Experimental FE
for high-strain behaviour of composites under bending load, the strengths and failure energies from uniaxial tensile tests [44,45,53] was employed in drilling simulations here which has probably led to overestimated results. Such overestimation of simulation results might also emerge from the type of finite-elements used in drilling simulations (1-integration point). In most numerical codes, such elements are assigned with viscous damping to avoid any possible hour glassing effects, commonly seen in large deformation problems [54]. Using full-integration elements would give more accurate results to this problem though it means a much prolonged computational time and large consumption of resources.
The accuracy of the simulation results can also be further improved by using a more realistic friction model at the tool-workpiece interface that accounts for the increase of coefficient of friction with cutting parameters [30,43]. Also, an improved material damage models for both of GLARE constituents which accounts for thermal effects during the machining process can possibly be used. Moreover, the type of element used in FE model can influence the material stiffness and the way the material is deformed. Additionally, the cutting tool was modelled as a discrete rigid body and its effect on the workpiece was neglected [30,55]. The tool deformation, stress and temperature were not modelled to reduce computational time in the study. Also as mentioned earlier, the use of reduced integration elements instead of full ones to reduce computation costs could have affected the accuracy of the results. These issues will be addressed in future research work.
5 Conclusions
In this paper, the machinability of GLARE fibre metal laminates was investigated under different spindle speeds and feed rates. Cutting forces were investigated experimentally and numerically using a 3D FE model. The quality of drilled holes was experimentally evaluated by inspecting its entrance and exit burr formations, surface roughness, deviation of hole size,
0 100 200 300 400 500
a
b
0 0.05 0.1 0.15 0.2 0.25 0.3 0.35 0.4 0.45
Thrust
force
(N
)
Drilling time (seconds)
FE Exp
0 0.1 0.2 0.3 0.4 0.5
0 0.05 0.1 0.15 0.2 0.25 0.3 0.35 0.4 0.45
T
o
rque
(N-m
)
Drilling time (Seconds)
[image:22.439.79.363.59.256.2]FE EXP
maximum entry and exit burr root thickness were around 107 and 372μm, respectively. Uniform burr without cap was observed at the hole edges after drilling.
& The optical and SEM microscopy of the hole surfaces showed that good hole quality can be
achieved when drilling at feed rates and spindle speeds 3000 rpm and 300 mm/min. CT scans of the drilled holes reflected minor surface delamination in glass fibre layers but no cracks through the laminate thickness. Analysis of SEM images showed that damage in the form of minor delamination, edge chipping/fracture, peel up and fibre spring back follow-ing workpiece retractions occurred when drillfollow-ing at high spindle speeds and feed rates.
& Under the used spindle speeds and feed rates, no delamination was identified on the
internal surfaces of the drilled holes and delamination factors was negligible.
& To evaluate the efficiency of the numerical model, the collected thrust force and torque data
were compared with modelling results for validation. The model provides good estimation of torque (between 0.83 % and 17.9 %) and thrust force (between 3.2 % and 53.2 %) which shows that the FE drilling model is capable of predicting the cutting forces within acceptable levels. Such FE models can be used as a virtual tool to simulate GLARE’s machining response and help making informed decisions on the selection of appropriate cutting param-eters. Further improvement on the drilling model will be carried which accounts for the thermo-mechanical coupling effects between the cutting tool and the workpiece.
Acknowledgments The authors would like to thank the Advanced Manufacturing Research Centre (AMRC with Boeing) in Sheffield for providing access to their machining facilities. The authors also thank Mr. Jacob Hawxwell (Sandvik Coromant, Sheffield) for his help with CMM measurements, and Dr. Peter Kortbeek (F.M.L. C-DELFT in Netherlands) for technical support and supply of GLARE material. Support from OSG regarding provision of CAD model and X-Tek systems for CT scans is also acknowledged. Mr. Khaled Giasin would like to thank the Department of Mechanical Engineering at the University of Sheffield for funding his PhD study. Authors gratefully acknowledge Professor Alma Hodzic for her support and guidance in this study.
Open AccessThis article is distributed under the terms of the Creative Commons Attribution 4.0 International License (http://creativecommons.org/licenses/by/4.0/), which permits unrestricted use, distribution, and repro-duction in any medium, provided you give appropriate credit to the original author(s) and the source, provide a link to the Creative Commons license, and indicate if changes were made.
References
1. Paipetis, A. and V. Kostopoulos:Carbon nanotube enhanced aerospace composite materials: a new generation of multifunctional hybrid structural composites. Vol.188: Springer Science & Business Media (2012) 2. Coromant, S.: Machining carbon fibre materials: user’s guide. http://www.sandvik.coromant.com/
3. Vlot A., Gunnink J.W.: Fibre Metal Laminates: an Introduction. Springer, New York City (2001) 4. Pawar O.A. et al.: Analysis of hole quality in drilling GLARE fiber metal laminates. Compos. Struct.123,
350–365 (2015)
5. Tyczynski P., Lemanczyk J., Ostrowski R.:Drilling of CFRP, GFRP, glare type composites. Aircraft Engineering and Aerospace Technology.86(4), 312–322 (2014)
6. J.F.W. Coesel,Drilling Of Fibre-Metal Laminates, inFaculty of Aerospace Engineering. Delft University of Technology. p. 63 (1994)
7. Mohamed G.F., Soutis C., Hodzic A.: Blast resistance and damage modelling of fibre metal laminates to blast loads. Appl. Compos. Mater.19(3–4), 619–636 (2012)
8. Fan J., Guan Z., Cantwell W.: Numerical modelling of perforation failure in fibre metal laminates subjected to low velocity impact loading. Compos. Struct.93(9), 2430–2436 (2011)
9. McCarthy M. et al.: Modelling of bird strike on an aircraft wing leading edge made from fibre metal laminates–part 2: modelling of impact with SPH bird model. Appl. Compos. Mater.11(5), 317–340 (2004) 10. Langdon G. et al.: Response of GLARE© panels to blast loading. Eng. Struct.31(12), 3116–3120 (2009) 11. Asad M. et al.: Dry cutting study of an aluminium alloy (A2024-T351): a numerical and experimental
approach. Int. J. Mater. Form.1(1), 499–502 (2008)
12. Liu J., Bai Y., Xu C.: Evaluation of ductile fracture models in finite element simulation of metal cutting processes. J. Manuf. Sci. Eng.136(1), 011010 (2014)
13. Kay, G.:Failure Modeling of Titanium-61-4V and2024-T3Aluminum with the Johnson-Cook Material Model.Technical Rep, Lawrence Livermore National Laboratory, Livermore, (2002).
14. Mabrouki T. et al.: Numerical and experimental study of dry cutting for an aeronautic aluminium alloy (A2024-T351). Int. J. Mach. Tools Manuf.48(11), 1187–1197 (2008)
15. Daoud, M., J.-F. Chatelain, and H. Bouzid:On the Effect of Johnson Cook Material Constants to Simulate Al2024-T3Machining using Finite Element Modeling. inASME2014International Mechanical Engineering Congress and Exposition. American Society of Mechanical Engineers (2014)
16. Giasin K., Ayvar-Soberanis S., Hodzic A.: Evaluation of cryogenic cooling and minimum quantity lubrication effects on machining GLARE laminates using design of experiments. J. Clean Prod.135, 533–548 (2016) 17. Alderliesten, R.C.: Fatigue crack propagation and delamination growth in Glare. Delft University of
Technology, Delft (2005)
18. Botelho E.C. et al.: A review on the development and properties of continuous fiber/epoxy/aluminum hybrid composites for aircraft structures. Mater. Res.9(3), 247–256 (2006)
19. Giasin K., Ayvar-Soberanis S., Hodzic A.:The effects of minimum quantity lubrication and cryogenic liquid nitrogen cooling on drilled hole quality in GLARE fibre metal laminates. Mater. Des.89, 996–1006 (2016) 20. Giasin K., Ayvar-Soberanis S., Hodzic A.: An experimental study on drilling of unidirectional GLARE fibre
metal laminates. Compos. Struct.133, 794–808 (2015)
21. Bi S., Liang J.:Experimental studies and optimization of process parameters for burrs in dry drilling of stacked metal materials. Int. J. Adv. Manuf. Technol.53(9), 867–876 (2011)
22. Brinksmeier E., Janssen R.: Drilling of Multi-Layer Composite Materials consisting of carbon fiber reinforced plastics (CFRP), Titanium and Aluminum Alloys. CIRP Ann. Manuf. Technol.51(1), 87–90 (2002) 23. Hoffman, P., et al.,Precision machining technology. Cengage Learning (2011)
24. Dornfeld D., Lee D.-E.: Machine Design for Precision Manufacturing. Springer, New York City (2008) 25. Srivatsan, T.,Processing and Fabrication of Advanced Materials, XVII: Part 8: Polymer-based composites
and nano composites: Volume Two. Vol.2: IK International Pvt Ltd., India (2009)
26. Capello E.: Workpiece damping and its effect on delamination damage in drilling thin composite laminates. J. Mater. Process. Technol.148(2), 186–195 (2004)
27. Isbilir O., Ghassemieh E.: Delamination and wear in drilling of carbon-fiber reinforced plastic composites using multilayer TiAlN/TiN PVD-coated tungsten carbide tools. J. Reinf. Plast. Compos.31(10), 717–727 (2012)
28. Dini G.: On-line prediction of delamination in drilling of GFRP by using a neural network approach. Mach. Sci. Technol.7(3), 295–314 (2003)
29. De Vries, T.J.: Blunt and Sharp Notch Behaviour of Glare Laminates. TU Delft, Delft University of Technology (2001)
30. Giasin K. et al.:Assessment of cutting forces and hole quality in drilling Al2024 aluminium alloy: experimental and finite element study. Int. J. Adv. Manuf. Technol. 1–21 (2016)
31. El-Hofy H.A.-G.: Fundamentals of Machining Processes: Conventional and Nonconventional Processes. CRC press, USA (2013)
32. Kalpakjian S., Schmid S.R., Kok C.-W.:Manufacturing processes for engineering materials. Pearson-Prentice Hall, USA (2008)
Hague, Netherlands: International Ballistics Committee (1983)
41. Lesuer, D.R.,Experimental investigations of material models for Ti-6 A1-4 V and 2024-T3, University of California: Lawrence Livermore National Laboratory, Livermore p. 1–36 (1999)
42. Simulia, D.,Abaqus 6.13 User’s Manual.Dassault Systems, Providence, RI, (2013)
43. Phadnis V.A. et al.: Drilling in carbon/epoxy composites: experimental investigations and finite element implementation. Compos. A: Appl. Sci. Manuf.47, 41–51 (2013)
44. Sosa J.C., Karapurath N.: Delamination modelling of GLARE using the extended finite element method. Compos. Sci. Technol.72(7), 788–791 (2012)
45. Mohit, G., et al.,Predicting Bearing Strength of Fiber Metal Laminates Via Progressive Failure Analysis, in 52nd AIAA/ASME/ASCE/AHS/ASC Structures, Structural Dynamics and Materials Conference. American Institute of Aeronautics and Astronautics (2011)
46. Hardell J., Prakash B.: Tribological performance of surface engineered tool steel at elevated temperatures. Int. J. Refract. Met. Hard Mater.28(1), 106–114 (2010)
47. Münz W.-D.: Large-scale manufacturing of nanoscale multilayered hard coatings deposited by cathodic arc/ unbalanced magnetron sputtering. MRS Bull.28(03), 173–179 (2003)
48. Rao, P.N., Manufacturing Technology: Metal Cutting and Machine Tools. v. 2: Tata McGraw-Hill Education (2013)
49. Jin X.: Mechanics and dynamics of micro-cutting process, inMechanical Engineering, p. 151. The University of Birish Columbia, Vancouver (2012)
50. Seshadri R. et al.: Finite element simulation of the orthogonal machining process with Al 2024 T351 aerospace alloy. Procedia Engineering.64, 1454–1463 (2013)
51. Yang K. et al.:Tool edge radius effect on cutting temperature in micro-end-milling process. Int. J. Adv. Manuf. Technol.52(9–12), 905–912 (2011)
52. Silberschmidt V.V.:Dynamic Deformation,Damage and Fracture in Composite Materials and Structures. Elsevier Science, Amsterdam (2016)
53. Raimondo, L., L. Iannucci, and P. Robinson,Predicting the dynamic behaviour of polymer composites. Department of Aeronautics, Imperial College London (2007)
54. Simulia ABAQUS: Users’Manual version 6.13 documentation [Internet]. Dassault systems.http://dsk.ippt. pan.pl/docs/abaqus/v6.13/index.html(2013). Accessed 25 June 2015
![Fig. 1 GLARE workpiece and dynamometer setup for cutting force measurement [16]](https://thumb-us.123doks.com/thumbv2/123dok_us/7751095.167470/3.439.54.393.462.604/fig-glare-workpiece-dynamometer-setup-cutting-force-measurement.webp)
![Table 2 Mechanical properties of the glass fibre adhesive system in GLARE laminates [3]](https://thumb-us.123doks.com/thumbv2/123dok_us/7751095.167470/5.439.47.393.538.614/table-mechanical-properties-glass-fibre-adhesive-glare-laminates.webp)
![Fig. 3 (Burr profile showing (parameters (a) the formation of burrs during drilling process (b) detailed description of burrc) the measurement process and locations of burr height and burr root thickness) [21]](https://thumb-us.123doks.com/thumbv2/123dok_us/7751095.167470/6.439.76.362.50.265/parameters-formation-drilling-detailed-description-measurement-locations-thickness.webp)
![Fig. 6 Measurement setup of hole size and error of circularity using CMM machine and description of MICmethod [19, 24]](https://thumb-us.123doks.com/thumbv2/123dok_us/7751095.167470/8.439.49.394.59.186/measurement-setup-error-circularity-using-machine-description-micmethod.webp)