Exploring the Impacts and Implications
of a Changing UK Welfare State under
Digitalisation and Austerity: the Case of Leeds
FINAL REPORT
Pilot study on Welfare and Austerity
for the RCUK Digital Economy
‘Communities and Culture’ Network+
Dr Stuart Hodkinson Andy Turner
Chris Essen
EXPLORING THE IMPACTS AND IMPLICATIONS
OF A CHANGING UK WELFARE STATE UNDER
DIGITALISATION AND AUSTERITY:
EXECUTIVE SUMMARY
This report details the main findings from a pilot project funded by RCUK’s Digital Economy programme exploring the impacts and implications of a digitally transformed UK welfare systemin the city of Leeds. This report updates our interim report (Hodkinson et al, 2014). The pilot study was commissioned in December 2013 against the background of the 2010-2015 UK Coalition Government’s programme of austerity-driven spending cuts and reforms to public services, voluntary bodies and welfare provision. Digitalisation is a key aspect of Welfare Reform and central to the new Universal Credit (UC) system being rolled out gradually across the country with an original target of 80% of claimants making and managing their UC benefit claims online by 2017.
This research focused on three specific communities of interest: public administrators of welfare; frontline welfare law advisors; and welfare claimants. Our research questions explored the potential impacts of an austerity-driven digital welfare system on these different communities, and on the everyday relationships between claimants and welfare providers.
The Key Findings can be summarised as follows:
First, as public and voluntary sector welfare administrators and advisors increasingly move their welfare claiming and advice services to digital forms of provision as a result of Universal Credit, there are dangers that this will:
further transform welfare into a more punitive, sanctions-based welfare system
•
based on conditionality and surveillance;
generate digital exclusion and destitution for particular groups of claimants; and
•
pose major organisational challenges to advice service providers.
•
Second, although the socio-spatial impacts of welfare reform are complex and still uncertain, we found evidence that:
the overall geography and demography of housing benefit (HB) claimants in Leeds
•
remains broadly unchanged but there are specific areas and groups within the city experiencing greater housing, neighbourhood and tenure instability; and
this instability is particularly pronounced for HB claimants affected by specific
•
welfare reforms such as those in the social rented sector affected by the Under-Occupancy charge known as the Bedroom Tax.
Our main policy recommendations are:
all welfare providers and advice services should avoid introducing ‘digital by
•
default’ systems of welfare claiming and advice; and
welfare providers, advice services and local authorities can do more to evidence
•
Exploring the Impacts and Implications of a Changing UK Welfare State under Digitalisation and Austerity: the Case of Leeds
Published 2016 by the University of Leeds, Woodhouse Lane, Leeds LS2 9JT
DOI: http://doi.org/10.5518/wp/3 © University of Leeds
The moral rights of the authors have been asserted.
You may share this work for non-commercial purposes only, provided you give attribution to the authors and copyright holder.
About the Authors
Dr Stuart Hodkinsonis a lecturer in critical urban geography at the University of Leeds whose research focuses on the socio-spatial effects of neoliberal housing, welfare and migration policies primarily in the UK. He has led or worked on several ESRC-funded projects, including residents’ experiences of public housing regeneration under the Private Finance Initiative in England (2011-14) and forced labour among asylum seekers and refugees in the Yorkshire and Humber region (2011-14). He was the principal investigator on this EPSRC-funded pilot project on digital welfare. [email protected]
Andy Turneris a researcher at the University of Leeds specialising in computational geography and has extensive experience of developing, using and critically exploring digital infrastructure. He has worked on the following related research projects: the JISC-funded National e-Infrastructure for Social Simulation Project (2009-12); the EPSRC-funded Pararchive - Open Access Community Storytelling and the Digital Archive Project (2013-15), and, the RCUK Digital Economy Theme Sustainable Society Network Island Stories - Growing Digital Heritage Pilot Project (2014). [email protected]
Chris Essen is the Involvement Officer at the College of Health and Wellbeing, University of Central Lancashire, responsible for facilitating, supporting and developing the involvement of health service users and their carers within healthcare professional education and research. He was previously a Research Fellow at the University of Leeds in the Schools of Health and Geography. He has extensive experience in conducting action research within the voluntary sector. [email protected]
Acknowledgements
CONTENTS
1. INTRODUCTION. . . 1
2. BACKGROUND. . . 2
3. RESEARCH OVERVIEW. . . 9
4. DIGITAL WELFARE TRANSFORMATIONS . . . 13
5. SOCIO-SPATIAL TRANSFORMATIONS OF WELFARE REFORM. . . 17
6. THE IMPACT OF UNDER-OCCUPANCY (THE BEDROOM TAX) ON LEEDS . . . 29
7. REFERENCES. . . 43
APPENDICES . . . 46
APPENDIX 1. DATA STATEMENT . . . 46
APPENDIX 2. DERIVED DATA INVENTORY . . . 47
LIST OF TABLES
Table 1: Timeline of Key Welfare Reforms in the UK . . . 3 Table 2: Summary of Housing Benefit Changes . . . 4 Table 3: Leeds HB Claimant Count April 2008 to October 2015 by Sector . . . 18 Table 4: Leeds HB Claims by Ethnicity of Main Claimant between 2008 and 2015 . . 20 Table 5: Leeds HB Claims with a Disability Premium 2008 to 2015 . . . 21 Table 6: Annual Postcode Moves by HB Claimants April 2008 to Oct 2015 . . . 27 Table 7: Leeds Under-Occupied HB Claims Count Nov 2012 to October 2015
by Sector: Snapshot and Cumulative Totals . . . 31 Table 8: Leeds HB Claims by Ethnicity of Main Claimant between 2008 and 2015 . . 33 Table 9: Leeds HB Claims with a Disability Premium 2008 to 2015 . . . 34 Table 10: Average HB Claimant Household Size by Tenancy Type,
April 2013 to October 2015 . . . 34
LIST OF FIGURES
Figure 1: HB Claims Caseload in Leeds: May 1995 to October 2015. . . 18 Figure 2: Leeds HB Claims Count April 2008 to October 2015 by Sector . . . 19 Figure 3: Leeds HB Claims by Ethnicity of Main Claimant 2008 and 2015 Compared. 20 Figure 4: Average Household Size of HB Claims Between 2008 and 2015 . . . 21 Figure 5: HB Claimant Distributions in April 2008, 2010, 2013, 2015 . . . 22 Figure 6: Leeds Community Areas Map . . . 23 Figure 7: A Generalised Map Showing Net Increases and Net Losses of
HB Claimants April 2008 to October 2015 . . . 25 Figure 8: HB Claimant Postcode Moves into PRS, April 2008 to October 2015 . . . 25 Figure 9: Comparing Net Increases and Net Losses of HB Claimants Over Two Time
Periods – July 2013 to July 2014 and July to October 2015 . . . 26 Figure 10: Leeds Under-Occupied HB Claims Count November 2012 to
October 2015 by Sector: Snapshot and Cumulative Totals . . . 32 Figure 11: Average HB Claimant Household Size by Tenancy Type,
April 2013 to October 2015 . . . 35 Figure 12: Average Rent Arrears of Council Tenancies Affected by Under-Occupancy. . . 36 Figure 13: Housing Benefit Claims by Social Tenants Affected by Under-Occupancy –
April 2013 and October 2015 . . . 38 Figure 14: A generalised map showing net increases and net losses of housing benefit
claimants affected by Under-Occupancy – April 2013 to October 2015 . . . . 39 Figure 15: A rate map of the net increases and net losses of housing benefit claimants
affected by under-occupancy – April 2013 to October 2015 . . . 40 Figure 16: Geography of Movement into and out of Under-Occupancy in Leeds –
April 2013 to October 2015 . . . 41 Figure 17: Geography of Household Moves Out of Under-Occupancy in Leeds –
1. INTRODUCTION
This report details the main findings from a pilot research project (2014-2015) that explored the impacts and implications of a digitally transformed UK welfare system for three specific communities of interest in the city of Leeds – public administrators of welfare, frontline welfare law advisors and those receiving or needing welfare support.
The pilot study was commissioned in December 2013 against the background of the 2010-2015 UK Coalition Government’s programme of austerity-driven spending cuts and reforms to public services, voluntary bodies and welfare provision (Welfare Reform). It was funded by the RCUK Digital Economy programme within the EPSRC-led Communities and Culture strand that aims to investigate digital transformations of communities and culture. This project was proposed in response to a specific call that focused on investigating the transformative potential of digital technologies and the implications for community and culture within the wider context of welfare and austerity.
Digitalisation and computerisation are key aspects of Welfare Reform and are central to the new Universal Credit (UC) system being rolled out gradually across the country. UC merges 6 means-tested benefits into a single monthly payment paid in arrears. The original intention was for UC to be ‘digital by default’, with a target of 80% of claimants making and managing their benefit claims online by 2017. While evidence grows about the social, economic, financial and legal impacts of Welfare Reform, the cultural and community implicationsof these reforms and their digital character remain less well evidenced and understood.
Among other questions, this project aimed to explore how and whether this digital technology would work; whether the existing digital divide would see the ‘emergence of a digital underclass’ (Helsper, 2011)within the welfare system; how the roles of, and relationships between, welfare claimants, administrators and advisors might change; and what socio-spatial impacts on both claimants and welfare institutions might occur. At the same time, the project aimed to explore
the potential of digital technologies to assist in understanding the changing context and
geographies of welfare provision as well as practically address emergent problems.
The research team worked in partnership with Leeds City Council and Leeds Citizens Advice Bureau and was advised by Leeds ACTS!.
2. BACKGROUND
In this section we place the pilot study in the context of the UK government’s austerity and welfare reform policies since 2010. Key policies are introduced with a focus on Housing Benefit reforms. We then review existing research and remaining knowledge gaps at first the national and then local Leeds scale.
2.1. FROM CRISIS TO AUSTERITY
On coming to power in May 2010, the UK Coalition Government of Conservatives and Liberal Democrats argued that, alongside economic stability, ‘deficit reduction’ was the ‘most urgent issue facing Britain’ (HM Government, 2010: p.15). Although the Coalition blamed rising public debt levels on economic mismanagement by the previous Labour Government (1997-2010), the so-called ‘deficit’ stemmed principally from government expenditure aimed at recapitalising the banking system between 2007 and 2010 following the global financial crisis. The Coalition argued that public spending cuts were vital to ‘significantly accelerate the reduction of the structural deficit over the course of a Parliament’ but promised ‘to protect those on low income’ (HM Government, 2010: p.15).
Austerity was also positively framed by Prime Minister David Cameron’s ‘big society’ vision. Alongside reinvigorating the role of voluntary and charitable organisations (Cabinet Office, 2010), the ‘big society’ emphasised using the power of a re-imagined ‘smarter’ (and smaller) state to empower ‘individuals, families and communities to take control of their lives’ (Cameron, 2009) – precisely at the moment that the welfare state was to be both shrunk and re-imagined to engender greater self-reliance (Hodkinson and Robbins, 2013).
The Coalition Government cut funding for public services and welfare by a total of 5.6% of GDP by December 2014 (Scottish Government, 2015).
The current UK Conservative Government elected in 2015 is continuing this austerity programme and it is predicted that by 2020 the UK will have experienced £202 billion in total spending cuts (ibid). Alongside austerity has been the renewed privatisation and marketisation of public services and assets, especially in England (and to a degree Wales)1, with the 2011 Localism Act setting in
train radical reform of municipal services, the planning system and housing policy – reforms which have gathered pace since the 2015 General Election.
2.2. THE WELFARE REVOLUTION
A key target of reform – and the main focus for our study – has been the social security system, which the Coalition described as ‘the biggest change to the welfare system in a generation which
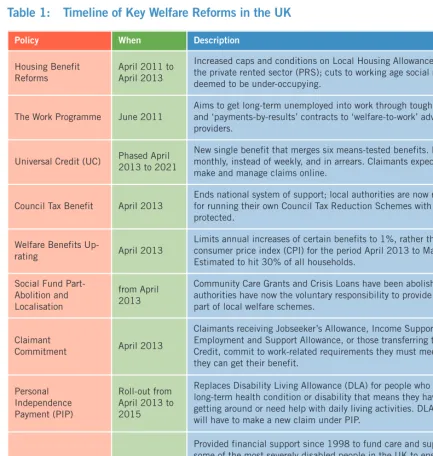
will ensure that it always pays to work’ (HM Treasury, 2013: p.25). Since 2010, more than 20 major welfare reforms have been introduced, the main headlines are summarised in Table 1.
[image:9.652.85.518.304.760.2]The general thrust of the reforms is to reduce overall entitlements, localise some parts of the welfare state on a voluntary basis, and to make welfare provision generally more conditional on seeking and taking up employment. The government has encouraged a discourse that frames welfare spending – in particular housing benefit (HB) – as being ‘out of control’ across the UK and unsustainable to the public purse. While the official blame is placed on the ‘generous’ benefits system, a more accurate understanding of growth in both claimants and expenditure is that it reflects the impact of the recent economic downturn on working households combined with the long-term effects of privatisation policies towards housing that have driven up housing costs while real wages have remained stagnant (Diacon et al, 2010).
Table 1: Timeline of Key Welfare Reforms in the UK
Policy When Description
Housing Benefit Reforms
April 2011 to April 2013
Increased caps and conditions on Local Housing Allowance rates in the private rented sector (PRS); cuts to working age social renters deemed to be under-occupying.
The Work Programme June 2011
Aims to get long-term unemployed into work through tough conditions and ‘payments-by-results’ contracts to ‘welfare-to-work’ advice providers.
Universal Credit (UC) Phased April 2013 to 2021
New single benefit that merges six means-tested benefits. Paid monthly, instead of weekly, and in arrears. Claimants expected to make and manage claims online.
Council Tax Benefit April 2013
Ends national system of support; local authorities are now responsible for running their own Council Tax Reduction Schemes with pensioners protected.
Welfare Benefits
Up-rating April 2013
Limits annual increases of certain benefits to 1%, rather than the consumer price index (CPI) for the period April 2013 to March 2016. Estimated to hit 30% of all households.
Social Fund Part-Abolition and Localisation
from April 2013
Community Care Grants and Crisis Loans have been abolished; local authorities have now the voluntary responsibility to provide these as part of local welfare schemes.
Claimant
Commitment April 2013
Claimants receiving Jobseeker’s Allowance, Income Support or Employment and Support Allowance, or those transferring to Universal Credit, commit to work-related requirements they must meet before they can get their benefit.
Personal Independence Payment (PIP)
Roll-out from April 2013 to 2015
Replaces Disability Living Allowance (DLA) for people who have a long-term health condition or disability that means they have trouble getting around or need help with daily living activities. DLA recipients will have to make a new claim under PIP.
Closure of the Independent Living Fund (ILF)
30 June 2015
Arguably the most relevant background reforms for our study have been changes to HB, the introduction of benefit caps, and the gradual phasing-in of the government’s flagship Universal Credit (UC) system.
2.2.1. Housing Benefit Reforms
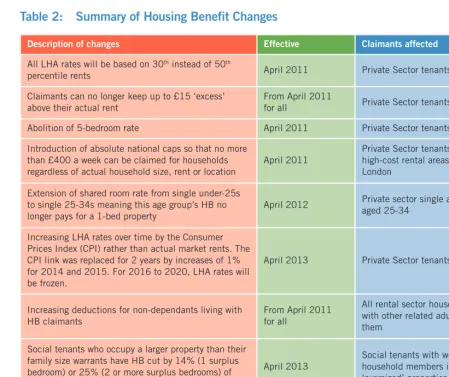
Expenditure cuts and savings-related changes of nearly £2.8 billion to HB in both the private rented sector (PRS) and the social rental sector were outlined in the October 2010 Comprehensive Spending Review (Chartered Institute for Housing, 2011). They were operationalised in 10 rule changes to the HB system covering Great Britain summarised in Table 2, with the majority addressing payments of Local Housing Allowance (LHA) to private sector tenants. Arguably the
most controversial of these is the Under-Occupancy charge, dubbed the ‘Bedroom Tax’ by
[image:10.652.60.510.346.723.2]opponents. This has seen social sector tenants of working age who occupy a larger home than their family size is deemed to warrant (in terms of bedrooms) have their HB cut by either 14% or 25% of their eligible rent since April 2013.
Table 2: Summary of Housing Benefit Changes
Description of changes Effective Claimants affected
All LHA rates will be based on 30thinstead of 50th
percentile rents April 2011 Private Sector tenants Claimants can no longer keep up to £15 ‘excess’
above their actual rent
From April 2011
for all Private Sector tenants Abolition of 5-bedroom rate April 2011 Private Sector tenants Introduction of absolute national caps so that no more
than £400 a week can be claimed for households regardless of actual household size, rent or location
April 2011
Private Sector tenants in very high-cost rental areas like inner London
Extension of shared room rate from single under-25s to single 25-34s meaning this age group’s HB no longer pays for a 1-bed property
April 2012 Private sector single adults aged 25-34
Increasing LHA rates over time by the Consumer Prices Index (CPI) rather than actual market rents. The CPI link was replaced for 2 years by increases of 1% for 2014 and 2015. For 2016 to 2020, LHA rates will be frozen.
April 2013 Private Sector tenants
Increasing deductions for non-dependants living with HB claimants
From April 2011 for all
All rental sector households with other related adults in them
Social tenants who occupy a larger property than their family size warrants have HB cut by 14% (1 surplus bedroom) or 25% (2 or more surplus bedrooms) of eligible rent
April 2013
Social tenants with working age household members in ‘oversized’ properties
Amending size criteria to provide an extra bedroom for
disabled claimants who have a non-resident carer April 2012
2.2.2. Benefit Caps
From April 2013, the government introduced a national weekly household benefit cap on ‘out-of-work households’ and couples working up to 23 hours a week. Should these households’ income from benefits breach the cap, then their HB entitlement is reduced until the cap is met (DWP, 2011b).
The cap applies to the total amount that a household receives from the following benefits: Bereavement Allowance; Carer’s Allowance; Child Benefit; Child Tax Credit; Employment and Support Allowance (except for those receiving the ‘support’ component); Guardian’s Allowance; Housing Benefit; Incapacity Benefit; Income Support; Jobseeker’s Allowance; Maternity Allowance; Severe Disablement Allowance; Universal Credit; and Widowed Parent’s Allowance.
The initial level of the cap was £26,000 or £500 a week for couples (with or without children living with them), and single parents whose children live with them, and £18,200 or £350 a week for single adults who don’t have children, or whose children don’t live with them. In the Summer 2015, the Conservative Government announced the Benefit Cap would be reduced to £23,000 in London and £20,000 in the rest of the UK from autumn 2016.
2.2.3. Universal Credit (UC)
UC merges six means-tested benefits into a single monthly payment paid in arrears. UC is also central to the government’s ‘smart-state’ agenda as it intended to be ‘digital by default’, with a set target of 80% of claimants making and managing their benefit claims online by 2017. UC is itself a technology, subject to various caps, sanctions and incentives designed to ‘make work pay’ while reserving welfare benefits for only those ‘in the greatest need’ (DWP, 2013). Claimants are to be made responsible for managing their own finances, thereby, it is claimed, saving public money, promoting self-reliance and reducing poverty in the process (DWP, 2013). UC official objective is to address poor work incentives and complexity within the current system of benefits and tax credits.
2.3. EXISTING EVIDENCE OF WELFARE REFORM EFFECTS
Since 2010, there has been a growing evidence base on the social and economic effects of welfare reform within a wider context of public spending and service cuts. An important if partial source of evidence on welfare reform impacts has come from the Department for Work and Pensions’ (DWP) own impact assessments on the Welfare Reform Act 2012 (e.g. DWP, 2010a, 2010b; 2011a). However, these official estimates have been criticised, not least by the government’s Social Security Advisory Committee (SSAC) and the Local Government Association, for failing to analyse the ‘cumulative impacts of all of the Government’s reforms, and claimants’ and local areas’ ability to deal with them’ (Wilson et al, 2013: p.4).
The research offers insights on the overall impact on different national, local and regional geographies (Beatty and Fothergill, 2013a, 2013b), on local authorities (Wilson et al, 2013), on private and social tenants and landlords (Power et al, 2014), and on particular types of claimants (Beatty et al, 2013). Geographically, cuts and reforms have fallen unevenly across local authorities and the nations of the UK but they will be fairly uniform in their social impact, hitting the poorest households more than those in the upper-middle of the income distribution in both cash and percentage terms (Institute for Fiscal Studies, 2010; 2015).
There remain, however, major knowledge and methodological gaps on the socio-spatial impacts and implications of welfare reform in the UK.
The first gap relates to the digital agendaand the cultural and community implicationsof this new welfare system, especially for those receiving or needing welfare support, those
administering welfare support,and those providing free legal advice to (potential) claimants.
There is important literature on the transforming and contested role of Information and Communication Technologies (ICTs) in the delivery of public services and government (Needham, 2004). Much has focused on the major IT failures in public sector procurement with cost and time overruns and outright contractual failures (see Brown, 2001); another important focus is on the implications of services being put exclusively or predominantly online due to concerns about data security, privacy and surveillance (Lyon, 2003) and the existence of a ‘digital underclass’ (Helsper, 2011) .
Nevertheless the specific implications and impacts of a digitalised welfare system in the UK have understandably received less focus. Digital-based uncertainties include:
how – and indeed whether – the new computer system will actually work (see
•
Michaelson, 2013 for a sceptical view);
the implications of the existing digital divide within the welfare system;
•
how will the roles of, and relationships between, welfare claimants, administrators
•
and advisors change;
what will happen to existing informal networks that help people to formally use
•
digital technology (Godfrey & Johnson, 2009); and
how will the personal independence of particular groups (e.g. with disabilities) be
•
guaranteed as investment in tackling their digital exclusion is reduced (Sourbati, 2012; Watling, 2011).
At the same time, the potential for digital technologies to assist in both understanding this changing context of welfare provision, and practically addressing emergent problems, remain under-investigated.
Much has been conjectured, since 2010, about the likely effects of welfare reform on housing tenure and geography from a diversity of actors. In general, academics, think tanks, charities and professional bodies agree that such cuts and caps will inevitably lead to increased rent arrears, homelessness, threatened evictions and overcrowding, with people forced to move home or even local authority in search of cheaper lower quality accommodation, large families forced into overcrowded housing conditions and single people aged 25-34 years old forced into shared accommodation (Chartered Institute for Housing, 2011b; Crisis, 2011).
Most of the research and speculative analysis focuses on London, which is unsurprising given the capital’s global city status, its population of 8.6 million and the rapidly rising housing market values that are making homeownership and renting unaffordable for increasing numbers of people. Early modelling work by Fenton (2011) raised the likelihood of ‘mass displacement’ in London from the inner to outer boroughs (see also Hamnett, 2010). CIH and Shelter (2011) predicted that benefit caps and below-inflation uprating would shrink the pool of deregulated PRS housing affordable to low-income households such that by 2030, 60% of English local authorities could be ‘very unaffordable’ to LHA claimants, with what was available likely to fall below ‘basic common standards of decent housing’ (Fenton, 2010: 29).
However, there is very little evidence explicitly capturing the before-and-after spatial effects of austerity and welfare changes on local or urban claimant populations and the neighbourhoods they live in.
2.4. LEEDS: THE EXISTING EVIDENCE BASE
Our research also responded to the specific context of Leeds for which at the time there was little research or evidence about the digital or community effects of welfare reform. To date there have been three major impact studies on Leeds:
The first by the Advice Leeds network reflected largely qualitative findings from 424 questionnaire surveys of their clients between August 2012 and August 2013. The report argued there was significant potential for welfare reform to exacerbate increasing levels of statutory homelessness in Leeds (Advice Leeds, 2014: p.17). Respondents revealed the changes were already having a significant financial impact:
68% less able to meet their living costs or pay their bills
•
44% less able to paying for heat or fuel,
•
nearly 50% finding that meeting food costs had been affected and
•
over 60% linking benefit changes to their inability to meet shortfalls in their rent
•
with housing costs generally prioritised over other essential living costs.
The third impact study was produced by the housing campaign groups, Leeds Hands Off Our Homes (2014), into the lived experiences of 60 tenants and their families in Leeds affected by the under-occupancy cuts to HB. It was submitted as evidence to the investigation into adequate housing in the UK by the United Nations Special Rapporteur, Racquel Rolnik. The report demonstrated the enormous strain being placed on households as they struggled to find the extra rent, the problems of accessing financial support and the pressure they felt from their social landlords. The findings were arguably limited by the focus on a relatively small and self-selecting set of individual stories.
2.5. CONCLUSION
3. RESEARCH OVERVIEW
This section presents an overview of the research we undertook. Our pilot project focused on the variegated impact and implications for culture and community of a digitally transformed UK
welfare systemfor three specific communities of interest at the local urban scale of Leeds – public
administrators of welfare support, frontline welfare advisors and those receiving or needing welfare support.
3.1. RESEARCH QUESTIONS
We were guided by the following research questions:
How will different communities within the welfare claimant population (ethnicity,
•
gender, class, neighbourhood, disability, age) be affected by benefit changes? How is the local public administration of welfare benefits restructuring and what
•
role is digital technology playing?
How will advice services organisationally cope with a digitalised system?
•
How are the reforms going to affect everyday relationships between claimants and
•
welfare services?
How will the practice of welfare advisors be affected?
•
Are there current or potential uses for digital technology that will positively assist
•
either practitioners or claimants?
What value is data collection and analysis going to be in addressing the practical
•
issues generated by welfare reform?
3.2. DATA PARTNERSHIPS
We worked in partnership with Steve Carey, Chief Officer for Welfare and Benefits at Leeds City Council and Dianne Lyons, Chief Executive of Leeds Citizens Advice Bureau (CAB), building on our existing collaborations through the University of Leeds’ School of Geography and a Talisman User Fellowship award (2012-2013), funded by the ESRC National Centre for Research Methods, designed to enable non-academic users to benefit from training and support in geospatial analysis.
Leeds City Council and Leeds CAB provided us with datasets that offered potential insights into the transformations being unleashed by austerity, welfare reform and digitisation:
Anonymised individual-level data for Leeds Local Authority District area about all
•
HB claimants in Leeds from April 2008 to October 2015, and about social housing tenants in Leeds affected by reductions to HB from ‘under-occupying’ their homes (the so-called ‘bedroom tax’) since April 2013;
Anonymised client caseload files from the main six welfare legal service providers
•
advice: Leeds CAB (including advice centres located in the City Centre, Otley, Morley, Pudsey, and Crossgates); Chapeltown CAB; the Leeds Law Centre (which closed in November 2013); Burley Lodge Centre (now Better Leeds
Communities); St Vincents; and Leeds City Council Welfare Rights Unit.
In order to advise and assist the project, we included in our Advisory Group Professor Gary Dymski, Vice-Chair of Leeds ACTS!, a partnership-building organisation for developing academic collaboration with public and third sector organisations in Leeds.
3.3. WORK PACKAGES
The project was organised into three specific work packages (WP).
WP1 explored the various social and cultural implications of a digitalised welfare system. We were interested in the potential changes in values, attitudes and behaviour that an online claiming system could generate for individual welfare claimants, welfare administrators and frontline advice providers. Additionally, we aimed to explore the implications for those not able or willing to claim online; what the devaluing face-to-face contact and social relations might mean for claimants’ lives; how the values, ethos and social status of, and the social relationships between (potential) welfare claimants and welfare institutions, might be changing as a result of welfare reforms and digitalisation; how digitalisation might be restructuring the local public administration of welfare benefits; and how advice services might organisationally cope with a digitalised system.
To investigate people’s experiences and insights we collected qualitative data between May and July 2014 using the following methods:
a small focus group of senior managers in the public and voluntary welfare sectors;
•
13 interviews conducted with:
•
5 frontline welfare legal advisors;
•
3 senior officers from the Advice Leeds network;
•
1 Job Centre+ administrator (not Leeds);
•
and 6 service users.
•
WP2 focused on mapping the changing geographies of welfare advice services. The main interest concerned how welfare advice services were spatially reorganising in the face of the general impacts of austerity policies, a new digitalized welfare system and a digitally excluded claimant population. The original intention was to assist Advice Leeds with a planned reorganisation of the service by performing a service location analysis that attempted to provide alternative options for accessing face-to-face advice services to better serve existing and future populations of advice seekers.
for a 2 year period around 2011 to 2013. Unique clients of these services were identified from individual enquiry records using unique client reference numbers. The data were mapped geographically on the basis of the residential postcodes of the clients providing information about the catchment areas of different advice outlets. Some of this work was outlined in our interim report (Hodkinson et al, 2014) and we have not included further findings of this WP in this report.
WP3 sought to visualise and spatially analyse the geographies of welfare cuts for individual households. The original aim was to explore the before-and-after effects of austerity and welfare changes on the Leeds claimant population by tracking the formal transformations of individual households’ economic circumstances (income levels, benefit take-up, economic activity), household composition, residential locations, household size and tenure type as recorded in the official claimant data sets held by Leeds City Council. To do this we were given access to official data about all HB and Council Tax Benefit claimants in Leeds dating back to April 2008 and rolling forwards on a monthly basis (see Appendix 1 for our Data Statement).
This data was taken from a monthly computerised report referred to as the Single HB Extract (SHBE). These monthly data extracts each contain information on approximately 90,000 claimants with around 300 fields of anonymised personal information with attributes including; income, benefits claimed, household size and characteristics, and place of residence. We also had access to monthly council data about all Leeds social housing tenancies affected by the Under-occupancy policy, containing 10 fields of information, including: number of bedrooms required, number of bedrooms in the property, the age and sex of any dependent children and the number of non-dependents. Rent arrears data was included for council-only tenancies.
We focused on identifying and mapping unique claimants and tracking their claimant, tenancy and postcode status over time e.g. when did they first appear on the data sets, were they still claimants or had they left, had their place of residence postcodes remained the same or changed, and had their tenure changed (e.g. from social to private tenancy or vice versa). An inventory of the derived data tables and maps we produced can be found in Appendix 2.
3.4. DIGITAL CHALLENGES AND DEVELOPMENTS
Although the research project focused on the challenges posed to welfare administrators and claimants of a new digital welfare system, from the outset the team found itself challenged by the digital and data complexities of the research.
For the quantitative data processing work, we opted for automation using open source Java programs. Automation was to allow for all the outputs to be generated from the source input data using a small amount (ideally a minimum) of manual interventions, with findings that could be reproduced more easily.
errors began to creep into the code we were developing, and de-bugging became time-consuming. Additionally, there were data synchronization difficulties due to the slightly different monthly measurement periods of the SHBE and Under-Occupancy data.
As a result, we were unable to produce the full impact analysis originally intended. However, we were still able to generate important findings on both the positive and negative implications of an online claiming system for claimants, and the potential scale of welfare and austerity-induced residential displacement and neighbourhood restructuring underway.
Looking towards the future, the pilot research has enabled us to acquire an in-depth understanding of the research and policy potential of Administrative Big Data – voluminous, detailed and continually updated individual-level data records maintained by public and third sector bodies. Specifically, we have understood the potential of Administrative Big Data for better evidencing and understanding the nature of residential displacement within the UK. Our next step is to try to unlock that potential through applying for research grants and developing collaborative research and data-sharing partnerships with public and voluntary bodies.
3.5. CONCLUSION
4. DIGITAL WELFARE TRANSFORMATIONS
This section details the main findings from interviews that explored the various social and cultural implications of a digitalised welfare system.
Main Findings: As public and voluntary sector welfare administrators and advisors increasingly move their welfare claiming and advice services to digital forms of provision as a result of Universal Credit, there are dangers that this will: further transform welfare into a more punitive, sanctions-based welfare system based on conditionality and surveillance; generate digital exclusion and destitution for particular groups of claimants; pose major organisational challenges to advice service providers; and facilitate further the corporate outsourcing of welfare provision.
4.1. WELFARE ADMINISTRATORS AND ADVISORS ARE MOVING THEIR SERVICES TOWARDS DIGITAL FORMS OF PROVISION
During the research period we observed a major drive by Leeds City Council towards e-service delivery through customer service via online and telephone systems. In terms of welfare administration, the local authority will introduce an online HB application form in due course. It is currently considering the pros and cons of an online by default system. In its role as a social landlord, the local authority, like other social housing providers, has a vested interest in supporting tenants to get online because under Universal Credit (UC), far more claimants will receive their housing costs support first before paying it to the landlord, in contrast to the present system of direct payments from the local authority welfare administration to the social landlord:
‘Social landlords are going to have to invest in computers and digital support just to protect rental income under UC. Where is the funding for this?’
(Welfare Rights Advisor 1)
The voluntary advice sector in Leeds also underwent a rapid and major organisational transformation during the research project. This has been driven by the perfect storm unleashed by austerity and welfare reform combined: the need to cut costs due to the impact of budget cuts by its main funder – Leeds City Council; and the need to simultaneously expand and diversify the advice service in the face of a huge increase in demand as a result of welfare cuts and legal changes.
Since April 2015, four Leeds CAB branches – in Cross Gates, Morley, Otley and Pudsey – have been closed, with savings reinvested in an expanded face-to-face service (9am to 5pm Monday to Friday) in the city centre, Chapeltown and a new branch in Middleton. For the first time, members of the public can telephone the CAB via a freephone facility in One Stop Centres between 9-5pm Monday to Friday. Evidence from interviews suggests that the changes have led to a major increase in the number of clients being advised by the service.
4.2. WELFARE DIGITALISATION UNDERPINS A MORE PUNITIVE, SANCTIONS-BASED WELFARE SYSTEM SANCTIONS-BASED ON CONDITIONALITY AND SURVEILLANCE
The Work Programme (see Table 1) has introduced greater conditionality for receiving welfare payments or face being sanctioned e.g. being forced to actively look for work, to accept employment opportunities and to agree to training and volunteering. Those working in the advice sector told us that a digitalised welfare system will create a far more inflexible, faceless compliance regime for claimants. Failure to feed digital monitoring forms with the ‘correct’ answers – with no room for personal situations to be taken into consideration – is creating a computer-automated sanctions regime. Job Centre advisors, in turn, will increasingly find their own performance electronically monitored against what we were told are unofficial targets to sanction claimants:
‘Universal Jobmatch seems to be a particular problem at the moment. It’s giving a decision maker quite clear evidence, in order to penalise people, and they’re not taking into account other steps that people may have to take that aren’t on a computer or via a tablet. […] Rather than being used to document what they have done it seems to be used to penalise what they haven’t’ (Frontline Advisor, 6)
4.3. EXCLUSION AND DESTITUTION FROM A DIGITAL-BY-DEFAULT SYSTEM IS INEVITABLE FOR PARTICULAR GROUPS OF CLAIMANTS
Welfare legal advisors we interviewed were convinced that a significant minority of their clients would be unable to access or cope with an online welfare-claiming system and a more general shift of public services online as a result of the interplay between client destitution, social exclusion, disability and poor mental health:
‘The nature of our client group is people who … have greater barriers in terms of… literacy, mental health issues, disability… who are going to be excluded and struggle’ (Frontline Advisor, 3)
‘There is a big, big group of people who simply don’t have the IT skills to
successfully make those claims’ (Frontline Advisor, 2)
The spectre of digital exclusion was reinforced by interviews with clients of advice services:
‘I suffer from migraine and they’re telling me I have to use this computer, and they’re messing about with programmes in the computer to start with. So I’m no sooner given advice and shown to do it this way, then I come in 2 or 3 days later and they’ve messed about with the programme, so the advisor doesn’t even know what he’s doing.’ (Client 4)
‘Up at the DSS there’s women there just think we’re skiving all the time. And I don’t own a computer, I hate computers, and the last four years looking for work has been a nightmare, because I don’t understand computers and I never will.’
(Client 5)
Welfare advisors drew upon examples of their clients to explain how digital exclusion and computer errors would lead to claimants having their benefits stopped, sanctioned or claims refused, leading to destitution.
‘I know that you can insist on making a claim over the phone if need be, and that’s what we did. Now, I had to be fairly vociferous to do that, but if you had that young woman on her own there’s no way. She would have then struggled, and perhaps would have left it, and maybe not received a benefit. And so the
implications would have been that that would have put more financial pressure on her family that she was living with.’ (Frontline Advisor, 1)
‘…increasing reliance upon digital often places pressure on advisors to provide one-to-one support with using computers and can lead to clients becoming
frustrated, meaning that they may walk out in anger and end up getting sanctioned “for things that they can’t control.”’ (Frontline Advisor, 5)
‘You can have the best IT skills in the world, but if there’s an issue with the system, so that you think you’ve applied for a job and you’ve only just saved the information, the consequences are huge for you’. (Frontline Advisor, 2)
4.4. WELFARE DIGITALISATION POSES MAJOR
ORGANISATIONAL CHALLENGES TO ADVICE SERVICE PROVIDERS
Advice service workers told us that they expect the move to online welfare claiming to significantly increase workloads and costs to advice organisations. They are particularly worried about the time, resource and skill needs of supporting claimants to manage their online accounts:
‘We can only deal with a certain amount of people, we can’t do classroom
tuition…’ (Frontline Advisor, 5)
‘We don’t have the space and human resources to support access to online
Another concern is the time taken up having to solve problems with computer systems and to take retrospective action to protect incomes from computer-generated mistakes. Senior council and welfare advice sector officers expressed serious doubts as to whether the new computer system would ever work. Their concerns are supported by the growing technical problems, cost hikes and delays that have beset the new digital system, which has been heavily criticised by the National Audit Office (2014). In 2013, DWP effectively re-set the Universal Credit timetable amid problems with the IT contract.
4.5. WELFARE DIGITALISATION FACILITATES THE RE-CENTRALISATION AND CORPORATE OUTSOURCING OF UK SOCIAL SECURITY ADMINISTRATION AND ADVICE
The phased roll-out of UC began in Leeds in February 2016 for single newly unemployed people only. Eventually UC will see the local authority administration of HB claims gradually phased out and centralised within the Department for Work and Pensions through the new online system. Fewer local authority benefit advisors will be needed. However, the move to a digitalised online claiming system is likely to enable the future outsourcing of the system, and with it, the potential rolling up of publicly-funded advice services into such contracts as has been seen in the outsourcing of the Home Office contracts to provide accommodation for asylum seekers in the UK. One advice centre manager told us of developments in Job Centres suggestive of such direction:
‘Job Centres have also been recruiting internally for staff to “floor walk” or “hand hold”. Things like “virtual signing” are also being trialled in some areas, leading some Job Centre advisors to worry that their professional roles may be phased out in preparation for completely outsourcing the service.’
(Advice Centre Manager 1)
4.6. CONCLUSION
5. SOCIO-SPATIAL
TRANSFORMATIONS OF WELFARE REFORM
This section sets out our main findings on the socio-spatial transformations of welfare reform in Leeds, focusing on what official data tells us about the geographical impact of changes to Housing Benefit (HB).
Main Findings: The socio-spatial impacts of welfare reform are complex and still uncertain. While our analysis of Leeds City Council HB claimant data suggests that the overall geography and demography of HB claimants in Leeds remains broadly unchanged, there are specific areas and groups within the the city experiencing greater housing, neighbourhood and tenure instability.
5.1. THE LIVE CASELOAD OF HB CLAIMANTS IN LEEDS HAS BEEN SLOWLY FALLING SINCE JANUARY 2013
As of October 2015, the total2 number of households with claims for HB in Leeds stood at
68,067, amounting to approximately 136,371 people. To put this figure in some context, Leeds had 73,548 HB claims in May 1995, falling to 50,511 in May 2004, before rising to 71,221 in January 2013 (source: Leeds City Council). These fluctuations in HB claimant caseload appear to closely correlate with changing economic conditions (the recession-recovery-boom-crash-recession-recovery cycle) and benefit entitlements over this period. During the 2000s, when average house prices and rents rose rapidly across the UK, the total HB claimant count rose steadily, but took off on a much higher growth trajectory from 2008 as the credit crunch and financial crisis hit the UK economy. Figure 1 shows this historical trend in HB claims in Leeds, broken down by Council Tenant and Other Private and Social Tenant3claims.
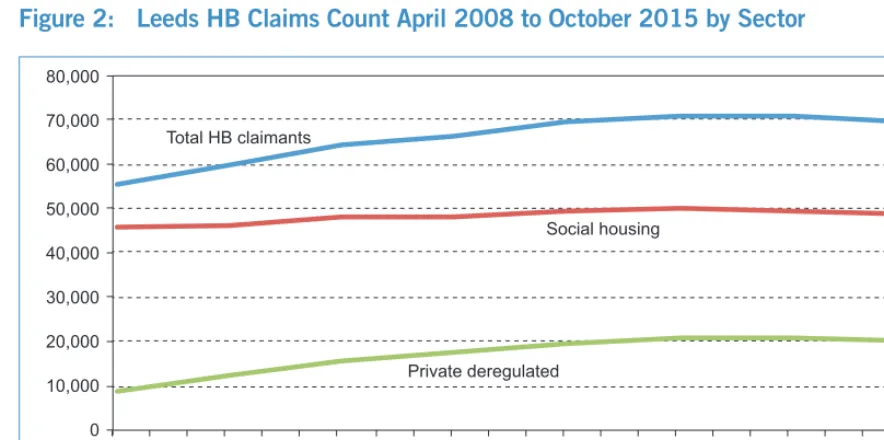
Looking at this HB claimant population by tenurefrom April 2008 to October 2015 (visualised more clearly in Table 3 and Figure 2 below), we see the number of claims by social tenure (council or Housing Association landlord) has remained broadly stable over time, but those in the deregulated PRS have increased dramatically from 8715 to just under 20,000, a rise of 250%. This growth in PRS HB claimants represents almost the entire increase in the HB caseload since 2008. This reflects the UK-wide picture of PRS housing absorbing households in housing need who would have previously been housed in the social housing sector but are blocked off from that sector due to the lack of new supply.
2 Unless otherwise stated, when we refer to total claims or claimant numbers we include claims where no HB
payment is recorded, usually because it has been suspended.
Figure 1: HB Claims Caseload in Leeds: May 1995 to October 2015
Table 3: Leeds HB Claimant Count April 2008 to October 2015 by Sector
5.2. THE DEMOGRAPHIC PROFILE OF LEEDS HB CLAIMANTS’ HOUSEHOLDS IS ETHNICALLY STABLE BUT IS SEEING INCREASING NUMBERS OF DISABLED MEMBERS AND GROWING AVERAGE HOUSEHOLD SIZE
The SHBE data does not enable us to profile all claimants and their households by their employment, education, or training status, nor by the type or amount of different benefits they might be entitled to. This is because any HB claim that has been awarded on a ‘Passported’ basis – meaning that they are automatically entitled to full HB because of other means-tested benefits they claim – does not require their income levels from employment and other benefits to be
Date Total HB claimants
Social Housing
Social Housing % of Total HB
Private Deregulated
Private Housing
% of Total HB Other
4 Other % of
Total HB
Apr-08 55,468 45,803 82.6 8715 15.7 957 1.7 Apr-09 59,585 46,478 78.0 12,278 20.6 834 1.4 Apr-10 64,506 48,077 74.5 15,770 24.4 663 1.0 Apr-11 66,259 48,265 72.8 17,433 26.3 585 0.9 Apr-12 69,851 49,573 71.0 19,730 28.2 570 0.8 Apr-13 70,670 49,745 70.4 20,482 29.0 465 0.7 Apr-14 70,768 49,479 69.9 20,795 29.4 514 0.7 Apr-15 69,264 48,747 70.4 20,073 29.0 465 0.7 Oct-15 68,067 48,208 70.8 19,459 28.6 423 0.6
Other Private and Social Tenant HB Claims Total HB Claims
Council Tenant HB Claims 80,000 70,000 60,000 50,000 40,000 30,000 20,000 10,000 0
May 1 995 Dec 1
995 Jul 1
996 Feb 1
997 Sep 1
997 Apr 1
998 Nov 1
998 Jun 1
999 Jan 2
000 Aug 2
000 Mar 2
001 Oct 2
001 May 2
002 Dec 2
001 Jul 2
003 Feb 2
004 Sep 2
004 Apr 2
005 Nov 2
005 Jun 2
006 Jan 2
007 Aug 2
007 Mar 2
008 Oct 2
008 May 2
009 Dec 2
009 Jul 2
010 Feb 2
011 Sep 2
011 Apr 2
012 Jun 2
013 Jan 2
014 Aug 2
014 Mar 2
015 Oct 2
[image:24.652.74.513.362.555.2]entered into the HB case management system. However, the SHBE does enable us to profile the demographic make-up of every HB claimant household for all its members by age, gender, and household size. It can also profile the self-stated ethnicity of every HB main claimant, identify where there is a benefit-linked disability in the household, and calculate the overall Leeds population that relies on HB. Below are some selected demographic profiles for Leeds.
Figure 2: Leeds HB Claims Count April 2008 to October 2015 by Sector
5.2.1. Ethnicity
The SHBE records the main claimant’s stated ethnic identity against 16 possible choices5that
we have merged into a smaller set of nine and represented in Table 4 and Figure 3 below. Based on this data, we can see that over the 2008-to-2015 period the HB claimant population was broadly reflective of the ethnic profile of the Leeds population s recorded in the 2011 census but does differ in terms of the overall proportions.
In summary, there is:
a lower proportion of HB claimants who identify as White British or Irish
•
compared to the overall Leeds population and this is decreasing over time; a far higher proportion of people who identify as ‘Other’ in the HB claimant
•
population compared to the overall Leeds population but this has remained broadly stable; and
a significant growth in the number and proportion of White Other and Black or
•
Black British HB claimants compared to the overall Leeds population. 80,000 70,000 60,000 50,000 40,000 30,000 20,000 10,000 0
Apr 2 008
Aug 2 008
Dec 2 008
Apr 2 009
Aug 2 009
Dec 2 009
Apr 2 010
Aug 2 010
Dec 2 010
Apr 2 011
Aug 2 011
Dec 2 011
Apr 2 012
Aug 2 012
Dec 2 012
Apr 2 013
Aug 2 013
Dec 2 013
Apr 2 014
Aug 2 014
Dec 2 014
Apr 2 015
Aug 2 015
Total HB claimants
Social housing
Private deregulated
5 (1) ‘White: British’, (2) ‘White: Irish’, (3) ‘White: Any Other’, (4) ‘Mixed: White and Black Caribbean’, (5) ‘Mixed: White and
The increase in ‘White Other’ potentially reflects more European migrant workers living in Leeds (see Migration Yorkshire, 2015); while the increase in ‘Black or Black British’ could reflect a rise in the number of African migrants settling as refugees in Leeds.
Table 4: Leeds HB Claims by Ethnicity of Main Claimant between 2008 and 2015
Figure 3: Leeds HB Claims by Ethnicity of Main Claimant 2008 and 2015 Compared 2011
Census Apr 2008
Apr 2009
Apr 2010
Apr 2011
Apr 2012
Apr 2013
Apr 2014
Apr 2015
Oct 2015
White British/Irish 82% 73.4 74.2 73.2 72.8 73.1 73.0 72.1 71.7 69.8
White Other 3.0% 1.0 1.4 1.7 2.0 2.7 3.3 4.0 3.8 3.4
Mixed White and Black African/ Caribbean
1.5% 0.8 0.9 1.0 1.0 0.9 0.9 0.9 1.0 1.0
Mixed White
and Asian 0.7% 0.2 0.1 0.2 0.2 0.2 0.2 0.2 0.2 0.2
Mixed Other 0.5% 0.0 0.0 0.0 0.0 0.0 0.0 0.0 0.0 0.0
Asian/Asian British 6.9% 2.1 2.1 2.2 2.3 2.3 2.3 2.3 2.4 2.5
Black/Black British: Caribbean, African or Other
3.4% 2.8 3.2 3.7 4.1 4.1 4.2 4.3 4.4 4.3
Chinese 0.8% 0.1 0.2 0.2 0.2 0.2 0.2 0.2 0.2 0.2
Other 1.1% 18.3 16.7 16.8 16.5 15.6 15.1 15.1 15.5 17.7
2015 2008
White British/Irish
White Other
Mixed White and Black African/Caribbean
Mixed White and Asian
Mixed Other
Asian/Asian British
Black/Black British: Caribbean, African or Other Chinese
[image:26.652.72.515.490.749.2]5.2.2. Disability
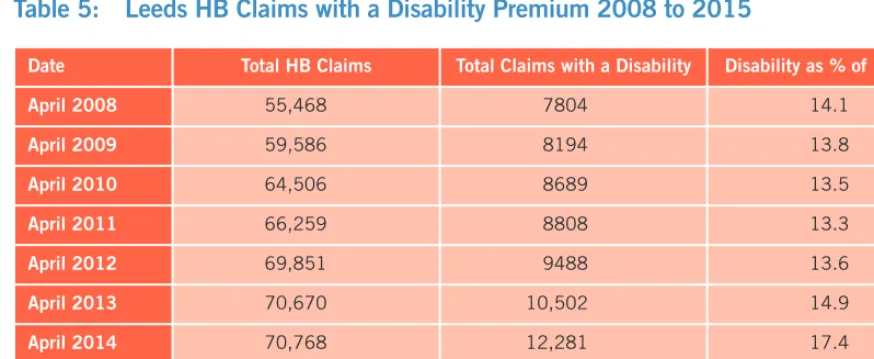
[image:27.652.86.523.249.428.2]By identifying the number of HB claims qualifying for one of four types of disability-related Premiums, we can see that HB claims with at least one household member having a disability have almost doubled since 2008 to 15,512, or from 14.1% to 22.8% of all HB claims. Most of this increase took place from April 2013 to October 2015. This is in large part to due work by Leeds City Council to identify those who qualified for disability premiums for the purpose of exempting them from having to pay council tax as part of the new local Council Tax Support system.
Table 5: Leeds HB Claims with a Disability Premium 2008 to 2015
5.2.3. Household size and total population
Over the study period 2008 to 2015, the average household size per HB claim rose steadily from 1.8 to 2 people per household (Figure 4), driven largely by an increase in claimants with dependent children.
Figure 4: Average Household Size of HB Claims Between 2008 and 2015
Date Total HB Claims Total Claims with a Disability Disability as % of HB claims
April 2008 55,468 7804 14.1
April 2009 59,586 8194 13.8
April 2010 64,506 8689 13.5
April 2011 66,259 8808 13.3
April 2012 69,851 9488 13.6
April 2013 70,670 10,502 14.9
April 2014 70,768 12,281 17.4
April 2015 69,264 14,489 20.9
October 2015 68,067 15,512 22.8
2.05 2.00 1.95 1.90 1.85 1.80 1.75 1.65 0
Apr
[image:27.652.84.513.544.763.2]5.3. THE OVERALL GEOGRAPHY OF HB CLAIMANTS IN LEEDS HAS REMAINED BROADLY UNCHANGED SINCE WELFARE REFORMS BEGAN
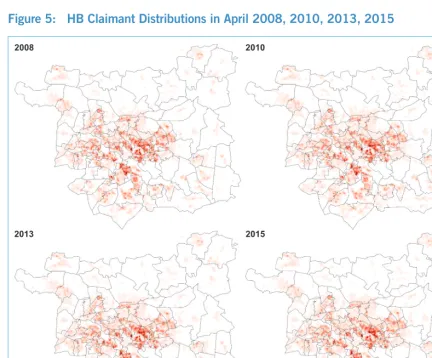
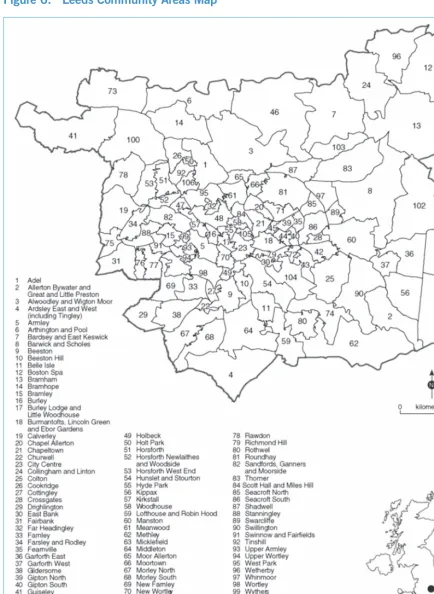
With reference to Stillwell and Phillips (2006) map of Leeds that aggegrated the 2439 Output Areas of the 2001 Census into a 106 ‘community areas’ in Figure 6, we can see how the overall geographical distribution of HB claimants in Leeds changed very little between 2008 and 2015.
[image:28.652.72.504.359.717.2]Figure 5 below compares for 2008, 2010, 2013 and 2015 the HB claimant distribution (generalised at a 50 metre resolution) derived from unit postcodes with the darker red shading indicating the highest concentration of claimants and the pale red and white shading indicating the lowest concentrations. It reveals how the overall spatial pattern of HB claimants persists over time with claimants clustering in the inner and outer urban areas of the city – covering Little London, Woodhouse, Holbeck, Hunslet, Beeston, Belle Isle, Middleton, Armley, Wortley, Headingley, Kirkstall, Chapeltown, Harehills, Cross Green, Richmond Hill, Burmantofts, Seacroft, Whinmoor, Middleton and Bramley – and a noticeable central urban corridor of little-to-no claimants (see Appendix 3 for larger and detailed maps).
Figure 5: HB Claimant Distributions in April 2008, 2010, 2013, 2015
2008 2010
Figure 6: Leeds Community Areas Map
This persistent spatial distribution of HB claimants is consistent with how the local housing system provides for low-income renter households by tenure(i.e. the legal status under which people have the right to occupy their accommodation). Both social rented housing and the proportion of PRS housing that can be sustained by HB in Leeds are geographically concentrated
in the inner and outer urban areas of the local authority district and as we will see later in the report, claimants tend to move within and between these areas, making little impression on the overall spatial distribution.
5.4. WITHIN THIS GENERALLY UNCHANGING GEOGRAPHY THERE ARE AREAS OF LEEDS EXPERIENCING NET GAINS AND NET LOSSES OF HB CLAIMANTS
When looking at the geographical distribution of HB claimants in a more dynamic way that searches for where marginal changesare occurring, a different picture emerges. Figure 7 below shows what has happened in relative terms over a seven year period of data from April 2008 to October 2015 during which time the total number of HB claimants increased by approximately 12,500. This net increase is reflected in the darker blue shaded patches in the Harehills, Burmantofts, Seacroft, Beeston, Holbeck, Armley, Middleton, and East Bank areas; but two of these areas – Holbeck and Beeston – also have places with net losses probably due to the impact of a local housing regeneration scheme involving demolition of social housing and the building of new private housing. A postcode analysis detailed in our interim report also revealed that places with the largest increases of HB claimants in the PRS also had some of the largest decreases, showing how some areas of the city are experiencing significant churn of low-income renters.
Our analysis of these changes by tenure shows that the main areas of net loss (red) correspond to the reduction in HB claimants in social housing in the south of the inner city; and the main areas of net increase (blue) in the south and north east of the inner city correspond to the rise in HB claimants in the PRS.
Figure 7: A Generalised Map Showing Net Increases and Net Losses of HB Claimants April 2008 to October 2015
Figure 8: HB Claimant Postcode Moves into PRS, April 2008 to October 2015
Areas of net loss Areas of net increase
Origin Destination
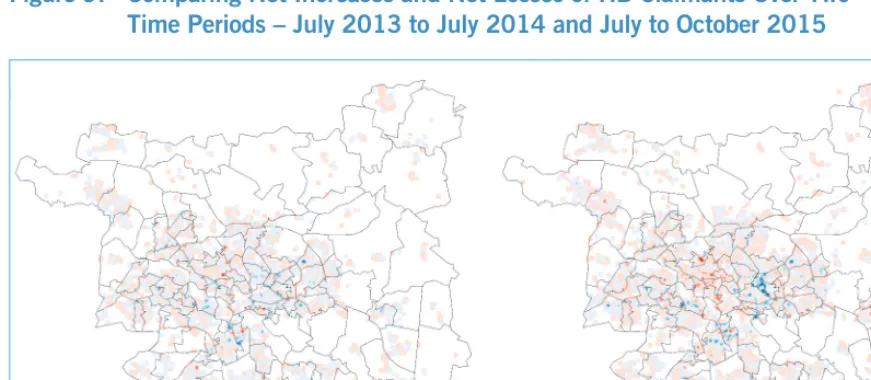
[image:31.652.87.525.532.719.2]Moving away from tenure changes and back to the general HB claimant picture, Figure 9 looks at the same relative picture of net increase and net loss by area but compares two time periods: a single year July 2013 to July 2014; and over just three months July to October 2015. The differences again are striking. The comparison over a single year now predominantly highlights areas with net gains of HB claimants, which is similar but more pronounced than Figure 7. The three month picture, in contrast, shows a far more chaotic scene in which lots of inner urban, outer urban and suburban areas of Leeds are showing net gains and net losses reflecting the ‘live’ flows of claimants either into and out of areas, or on and off HB.
Figure 9: Comparing Net Increases and Net Losses of HB Claimants Over Two Time Periods – July 2013 to July 2014 and July to October 2015
5.5. WELFARE REFORMS AND AUSTERITY APPEAR TO BE INDUCING
RESIDENTIAL AND TENURE DISPLACEMENT IN COMPLEX AND UNEVEN WAYS
We also found evidence of increasing numbers of individual households changing homes, tenancies and even tenure since 2008. Table 6 below sets out the key statistical headlines of geographical instability, capturing and comparing the total number of postcode changes on a six monthly basis and aggregating them to provide annual counts. The total for each year is first expressed as a percentage of the total HB claimant population for April of that year. Note: Table 6 significantly under-counts the total home moves over each year by comparing annual snapshots instead of monthly snapshots, and by only counting postcode moves where the full unit postcode is present and valid according to the Office of National Statistics.
Table 6: Annual Postcode Moves by HB Claimants April 2008 to Oct 2015
The first set of observations from Table 6 concern the overall patternsof HB claimants moving home (= postcode change) between April 2008 and March 2016 (forecast):
the total number of HB claimants moving home rises each year from 2008 to 2014
•
at which point it begins to fall again, a pattern largely mimicked for social-to-social and PRS–to-PRS moves;
in contrast to total home moves, the rate of home moves as a proportion of the HB
•
claimant population is much more in flux, rising to 2010, falling to 2012, rising to 2013, then falling to 2015 with it forecasted to fall again in 2015-2016;
there is a generally consistent finding that a significant majority – approximately
•
75% to 78% – of all home moves do not involve a change of tenure i.e. claimants who move home remain either council, housing association or PRS tenants;
between 2008 and 2010, the PRS replaced the social rented sector as the sector in
•
which claimants moved home the most;
the proportion of postcode moves linked to claimants moving within the social
•
rented sector has gradually fallen each year but is forecast to rise in 2015-16; the proportion of postcode moves within the PRS rose each year until 2014-15 when it fell and is forecast to fall again in 2015-16;
similarly, the proportion of postcode moves linked to claimants moving from the
•
social rented sector to the PRS fell each year from 9.6% to 6.3% but is forecast to rise in 2015-16; while the proportion of moves linked to claimants moving from the PRS to the social rented sector rose each year from 9% to 16.3% and is forecast to rise to 18.1%.
T o ta l H B C la im s a t A p ri l o f st a rt y e a r T o ta l p o st -c o d e m o ve s % o f H B c la im s W it h in S o c ia l S e c to r % o f p o st -c o d e m o ve s W it h in P R S % o f p o st -c o d e m o ve s F ro m S o c ia l to P R S % o f p o st c o d e m o ve s F ro m P R S t o S o c ia l S e c to r % o f p o st c o d e m o ve s O th e r m o ve s % o f O th e r m o ve s
08-09 55,468 4,996 9.0 2,126 42.6 1,609 32.2 480 9.6 448 9 333 6.7
09-10 59,586 6,523 11.0 2,453 37.6 2,648 40.6 588 9 698 10.7 136 2.1
10-11 64,506 6,865 10.6 2,436 35.5 2,901 42.3 574 8.4 850 12.4 104 1.5
11-12 66,259 7,120 10.7 2,284 32.1 3,230 45.4 556 7.8 932 13.1 118 1.7
12-13 69,851 7,708 11.0 2,450 31.8 3,520 45.7 508 6.6 1,096 14.2 134 1.7
13-14 70,670 7,851 11.1 2,500 31.8 3,628 46.2 545 6.9 1,120 14.3 58 0.7
14-15 70,678 6,996 9.9 2,182 31.2 3,199 45.7 442 6.3 1,137 16.3 36 0.5
15-16
While these different patterns suggest different underlying dynamics have been affecting geographical mobility, there is nevertheless a very clear picture that while home moves within and out of the social rented sector have slowed down over the past 7 years, they have speeded up in the PRS in the same period. The rising levels of postcode change and tenancy turnover in the PRS are consistent with:
the increased insecurity of PRS tenancies from the combined impact of cuts in
•
LHA and other welfare benefits since 2011 outlined in Table 2; landlord’s greater powers to evict tenants; and
•
the huge growth in low-income households being housed in the PRS while waiting
•
to move into a council or housing association home that is usually a more secure, decent and affordable option.
5.6. CONCLUSION
6. THE IMPACT OF UNDER-OCCUPANCY
(THE BEDROOM TAX) ON LEEDS
This section presents our main findings on the impact of the Under-Occupancy reform to HB for social tenants, dubbed the 'Bedroom Tax'.
Main findings: social tenancies affected by a cut to their HB as a result of being classified as ‘under-occupying’ their home are more numerous than officially presented, include a significant number of disabled people, and have experienced a widespread increase in rent arrears as well as far greater housing, neighbourhood and tenure instability than HB claimants in general.
6.1. THE GOVERNMENT'S UNDER-OCCUPANCY POLICY SUMMARISED
As we outlined briefly in section 2.2.1, one of the most controversial HB reforms is the Under-Occupancy charge, dubbed the ‘Bedroom Tax’. First announced in the UK Coalition Government’s Comprehensive Spending Review October 2010 and legislatively implemented under the Welfare Reform Act 2012, since 1 April 2013, existing and new working age tenants in the social rented sector living in a property deemed too large for their needs had their HB reduced.
The government’s official rationale for this policy change was threefold: to contain or reduce overall HB expenditure;
•
to incentivise HB claimants in the social rented sector to move from
•
accommodation deemed to be too large for their needs into more appropriately sized accommodation; and
to create more fairness for both the taxpayer in ending the public ‘subsidy’ of
•
‘spare bedrooms’ and for HB claimants in the PRS whose HB entitlement was strictly linked to household size (DWP 2012).
The size criteria used is the same as that applies to HB claimants in the PRS receiving Local Housing Allowance, including the new rule to provide a bedroom for a non-resident carer. No more than two people should have to share any bedroom and no one has to share a bedroom unless they are:
A couple
•
Both aged under 10 years old irrespective of their sex
•
Both aged under 16 years old and of the same sex
•
An additional bedroom is also allowed in certain circumstances for regular non-resident overnight carers, foster carers, disabled children unable to share a bedroom and people who are recently bereaved. Bedrooms used by students and members of the armed forces are not counted as ‘spare’ if they are away and intend to return home (see Wilson 2015).
Unlike the PRS, however, the social rented sector size criteria will: only apply to households that are ‘under-occupying’ accommodation, regardless of the level of rent being charged; and reduce the eligible rent by a percentage, rather than by a specific absolute amount.
Those deemed to have ‘spare bedrooms’ have had their weekly HB entitlement reduced by either 14% (for one spare bedroom) or 25% (two or more bedrooms) of their eligible rent.6For example,
a household whose weekly eligible rent is £200 and is deemed to under-occupy by one bedroom will lose £30 a week in HB, increasing to £50 a week if they under-occupy by two or more bedrooms.
DWP HB data show that in May 2013, 547,000 households were affected by Under-Occupancy, which equates to 11.6% of all social tenancies; by November 2014, the number of households affected had fallen to 465,000; and in August 2015, it had fallen further to 449,159 (see https://stat-xplore.dwp.gov.uk) However, as we will now demonstrate in relation to Leeds, the cumulative total of households affected is likely to be much higher.
Using unique identifiers (i.e. claim reference numbers) to link the Under-Occupancy caseload to the SHBE caseload data, we were able to track what has happened to each affected household between April 2013 and October 2015 and produce a selection of demographic profiles.