MARKET
TRENDS AND DISTRIBUTION OF INCOMES
AN OVERVIEW
EFER (EUROPEAN FEDERATION FOR ECONOMIC RESEARCH)
COMMISSION
Cataloguing data can be found at the end of this publication.
Luxembourg: Office for Official Publications of the European Communities, 1989 ISBN 92-825-9628-1
Catalogue number: CB-55-89-980-EN-C
© ECSC-EEC-EAEC, Brussels · Luxembourg. 1989
Reproduction is authorized, except for commercial purposes, provided the source is acknowledged.
PROGRAMME FOR RESEARCH AND ACTIONS ON THE DEVELOPMENT OF THE LABOUR MARKET
TRENDS AND DISTRIBUTION OF INCOMES
AN OVERVIEW
EFER
EUROPEAN FEDERATION FOR ECONOMIC RESEARCH
by GuglieLmo Wolleb (dir.) Manuel Ahijado
Alois Guger Sara Horrell Antonio Ni zzo Ii Jill Rubery
Véronique Sandoval Luis Sastre
Copyright ECSC-EEC-EAEC, Brussel - Luxembourg, 1989
EUROPEAN FEDERATION FOR ECONOMIC RESEARCH
TRENDS AND DISTRIBUTION OF INCOMES AN OVERVIEW
by Guglielmo Wolleb (dir.) Manuel Ahijado
Alois Guger Sara Horrell Antonio Nizzoli Jill Rubery
Veronigue Sandoval Luis Sastre
October 1987
This report is based on work carried out by a working group in 1986-1987, directed by Guglielmo Wolleb (University of Parma, ISMERI Europa).
Responsible for the national papers were Alois Guger (Österreichisches Institut fur Wirtschaftsforschung, Wien) for Germany; Sara Horrell and Jill Rubery (D.A.E., Cambridge) for the U.K.; Manuel Ahijado (UNED CEURA, Madrid) and Luis Sastre (Ministry of Economy, Madrid) for Spain; Véronique Sandoval (1RES, Paris) for France; Antonio Nizzoli
(University of Pavia) and Guglielmo Wolleb for Italy.
by
Guglielmo Wolleb 1. INTRODUCTION
This research studies the trends in, and causes of, inequality in the household distribution of income in a number of European countries.
This research follows two previous studies by the European Federation for Economic Research devoted to changes in the "rapport salariai" in Europe and to Europe's place in
the world economy.1 This present study focuses on Europe and
emphasises the similarities in its economic and social structures, which make Europe a meaningful entity. It nevertheless identifies the important national differences which still exist between the various countries. Like the earlier reports, it centres on the systems of social and economic regulation, and within that the role of the family.
The report is the collective work of a working group in which national papers were extensively discussed at various stages of drafting.
The report consists of five national papers and an introduction which explains the basic theoretical concepts and summarises the main results in a framework of comparative analysis.
The national papers follow a similar plan so as to enable common features and national characteristics of the household distribution of income and in its determining variables to be identified at European level. The opening chapter is devoted to an assessment of the degree and structure of inequality, and its evolution throughout the seventies and early eighties. The following chapter deals with the roles played by the welfare system, market forces and the family itself in producing changes in inequalities of distribution. A description is given of demographic and
labour market trends and of their impact on the size and
importance. Inequalities arising from the structure of the family, relations with the labour market, social class, and geographical position are considered in turn. Finally, an attempt is made to identify those groups in the population or those types of household where these factors of inequality are likely to accumulate, causing situations of relative or absolute deprivation.
In view of the wide statistical differences in household income, limiting both the comparison of different countries' experiences and the temporal comparison within each country, national reports include a statistical appendix where the definitions of the main concepts used in the paper are given and where the limits of available statistics are specified. However, the definitions of family and of income used in the various countries' reports are roughly similar. The definition of family coincides with the concept of household, which comprises persons living alone or groups of people living at the same address. As far as possible, the definition of income used is that of disposable income, including labour and capital income and social transfers after deducting social contributions and taxes. France is the only major exception, because its data source refers to taxable household revenues, which differ considerably from the above definition of disposable income.
This introduction follows the same format as the national reports and is based on their contents.
2. METHODOLOGY
The choice of the household as a unit of analysis in the income distribution process draws upon a wide and inter-disciplinary area of research. Such work concentrates on the role of the family within the economy, highlighting its links with the production system, and its position at the centre of the system of social reproduction.
The family has been found to play a relevant role in determining labour supply, both quantitatively and qualitatively, by taking decisions autonomously on participation rates and on its members' share of market and non-market activities. The quantity of labour supplied may vary in accordance with the specific needs of the family throughout its life-cycle, or in response to external economic events, while its composition is mainly dependent on the historically determined division of labour within the family. What is relevant is that, in regulating the labour supply, the family acts as a relatively autonomous decision-making unit capable of evolving strategies conducive to its objectives.
individual members is therefore determined within the family and not on the level of their personal income. The responsibility for the satisfaction of basic individual needs has gradually been taken over by the State, at least for those needs which are recognised as a citizen's right. However this process has transformed, rather than reduced, the role of the family in the sphere of social reproduction for three ' main reasons. Firstly, because the total substitution of the family in some fundamental fields of activity, such as education, health and social security has proven to be impossible, especially in those instances where personal care is required. Secondly, because the growth of welfare provisions and of real consumption in general, has increased in line with the rise in the socially acceptable standard of living, necessitating continuous family intervention to fulfill increasing requirements. Thirdly, because the growth of the service sector, and of the welfare institutions in particular, extended the tasks of the family to cover the management of relations with all kinds of public and private bodies.
The family's function in the productive sphere and in the system of social reproduction are of primary importance to our analysis of income distribution, which focuses on the actual standard of living of families. This standard of living depends on the total amount of available resources, of
which income represents an important part,3 and on the needs
of the family which can be roughly estimated by its size and composition.'* The funding of resources is clearly linked to
2. The emphasis on the family as a decision-making unit
and as a solid unit of consumption must not be confused with an implicit judgement on the degree of harmony and justice prevailing within the family. Important decisions can and in
fact, are taken, by individual members of the household which conflict with the opinion of other members. The division of resources within the family may well be unfair. Ultimately, the relationship between family members is regulated by a variable and historically determined mix of solidarity and balance of power.
. Needless to say, disposable income is only one of the available resources which determine the households' standard of living. Consideration of the other resources, which are covered extensively in economic and sociological literature, would certainly help in the assessment of living standards but would also make a single piece of research unmanageable.
of needs highlights the central position of the family because it is the common use of the family's resources which breaks the direct link between individual earnings and the standard of living of family members. Resources and needs are therefore the two poles of our inquiry on income distribution. The comparison between the two offers a criterium on which to assess the equality of a given distribution.
In performing its functions in the productive sphere and in the system of social reproduction, the family does not act in isolation but interacts with the market forces and with the state in ways which are characterized by different mixtures of conflict and complementarity and which, in any case, induce a process of reciprocal adaptation. The family's action is therefore constrained by, and constrains in its turn, the contemporary working of these two socio-economic regulators.
This focus on the interdependence of socio-economic processes can highlight complex relationships. An interesting example is the interrelated dynamics between the evolution of the welfare state,the increase in women's labour supply and changes in the composition of labour demand.
The development of the welfare system has relieved women of some tasks related to social reproduction but on the same time the consensus which has accompanied the welfare system has been eased by the crucial support of family intervention in all those areas in which the welfare services were unable to satisfy the essential needs. These changes in the division of labour between state and family in the
R. H. Tawney where the author not only recognizes the wide variety of human needs but recommends individual care for their satisfaction: "it is true, again, that human beings have, except as regards certain elementary, though still sadly neglected, matters of health and development different requirements, and that these different requirements can be met satisfactorily only by varying forms of provision. But equality of provision is not identity of provision. It is to be achieved, not by treating different needs in the same way, but by devoting equal care to ensuring that they are met in the different ways most appropriate to them " "The more anxiously, indeed, a society endeavours to secure equality of consideration for all its members, the greater will be the differentiation of treatment which, when once their common human needs have been met, it accords to the special needs of different groups and individuals among them ".
See R. H. Tawney, "The Religion of Inequality", in A. B. Atkinson (ed.), "Wealth, Income & Inequality", Oxford University Press, 1980, extracts from R. H. Tawney,
activity rates both directly by means of employment creation in the welfare institutions and indirectly by means of a modification of women's tasks within the family. Developments in the productive sphere connected to the growth of the private service sector, the characteristics of technological innovation and the uncertainty of the economic perspectives, all resulted in a demand for labour which was flexible and cheap. This led to the growth of female employment and favoured the ongoing process of a change in the women's role within the family.
This dynamic sequence demonstrates how socio-economic processes are never the result of the action of a single force or social actor, but the outcome of complex interrelations between different protagonists and between different spheres of activity. Moreover, differences in the experiences of various countries can be more easily understood by studying not only the specific peculiarities of a single socio-economic regulator, but also the different structure of relations and their different boundaries of action. As far as our analysis is concerned, we have identified the State, the Market, and the Family as the main protagonists in the income distribution process, and have attempted to assess their relative roles in relation to changes of income distribution over the last decade. However, it is beyond the scope of this study to develop a
full analysis of each country's wage and welfare systems, and of their role in the socio-economic systems of regulation.
3. POPULATION, LABOUR FORCE AND HOUSEHOLDS
Demographic trends and changes in the composition of the labour force affect household income in a variety of ways.
The age structure of the population, and the average size and age composition of the household, is affected by the birth and death rates. Changes in size and composition, affect household income and its power to satisfy household needs, both by means of changes in the number and type of potential earners, and by means of changes in the total number of people in the family.
Changes in the sex and age structure of the labour force alters the composition of household income, which consists of the contributions from the husband, the married woman and the children. Changes in the process of income formation are, in turn, associated with changes in total household income, as the number of workers in the family varies.
is generally the main monetary resource of the household, the wife whose income is relevant but less important, and the children whose contribution is not significant for the family's standard of living.
Thus, the current trends in population, labour force and unemployment affect the overall distribution of income, by means of changes in the structure of households by size and composition; (households of different size and composition have different average incomes) and by means of changes in the relationship of each household with the labour market;
(the number of workers and the sources of income change). The next section will therefore be devoted to a brief description of these trends over the last decade.
Demographic trends in Europe, throughout the sixties and seventies, have been characterized by a fall in the birth and death rates, generally resulting in a slowing down of population growth, and in an ageing of the population. The intensity and timing of these phenomena, however, varied in different countries.
Germany has been experiencing a period of negative growth since the seventies, while in the U.K. the population growth has been around zero; in Italy too, growth declined continuously throughout the seventies, and gave rise to modest positive rates in the early eighties. In France, after a decrease in the first half of the seventies, population growth stabilised around a positive annual rate of 0.5% over the last ten years. Spain is the only country in which population in the seventies grew at a rate higher than in the sixties; however, since 1981 its population growth has halved.
In all countries these demographic trends have produced a fall in the population aged under 14 and a modest or zero rise in the over 65s. The reduction in the youngest part of the population was particularly high in Germany and reflected a period of prolonged negative growth, while in Spain it was very low, due to the high birth rate in the seventies. In the early eighties the share of the under fourteens was 15% in Germany, around 20% in France, Italy and the U.K. and 25% in Spain. In all countries the share of the over 65s was around 15%, except in Spain, where it was slightly lower. As a result, the population of working age increased in all countries except Spain, where it remained stable.
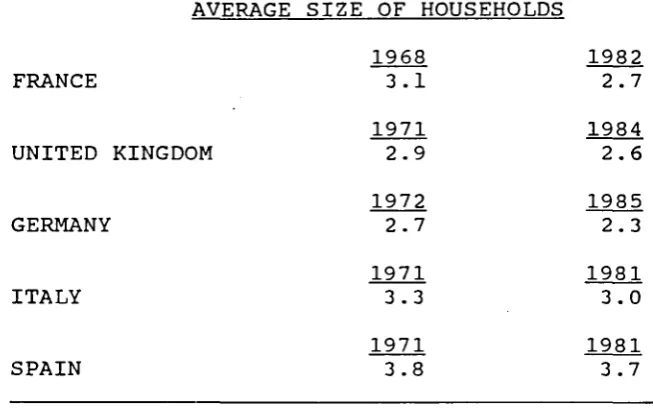
recording a similar household composition in 1971 and in 1981. The average size of households has therefore decreased in all countries but still differs widely, being particularly low in Germany (2.3) and particularly high in Spain (3.7). (See Table 1)
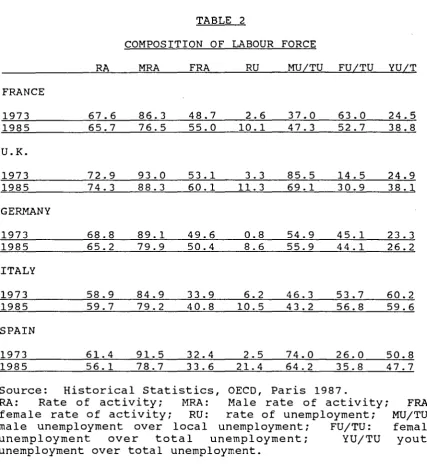
The composition of the labour force and unemployment by sex and age affects the household's relationship with the labour market and hence the household income. (See Table 2)
[image:12.595.89.416.387.591.2]Differences in the rate of activity between countries do not arise from differences in the male rate of activity, with the major exception of the U.K.. This homogeneity reflects the common role played by the male in European households as the main income earner. However, great differences arise, in female rates of activity, which range from a bottom value of 33% in Spain to a top value of 58% in the U.K.. These disparities in relation to the labour market reveal profound differences between countries in the woman's role in the household and in her contribution to household income.
TABLE 1
AVERAGE SIZE OF HOUSEHOLDS 1968
FRANCE 3 .1 1971
UNITED KINGDOM 2.9 1972
GERMANY 2 . 7 1971
ITALY 3.3 1971
SPAIN 3.8 3.7
A temporal comparison within each country shows that all countries have experienced a fall in the male rate of activity mostly due to a lengthening of the education period of young people, and to the increase in early retirement of older workers. Conversely, the female rate of activity, has increased in the U.K., in France and Italy, while it has remained stable in Germany and Spain. However, the stability of the overall female activity rate in Germany and Spain is the result of a contemporary fall in activity among the younger and older parts of the population of working age and of an increase in participation by the middle age-group.
participation, and in their contribution to household income exists in Europe.
[image:13.595.96.524.194.664.2]Large differences between countries can be observed in the composition of unemployment by sex and age.
TABLE 2
COMPOSITION OF LABOUR FORCE
RA MRA FRA RU MU/TU FU/TU YU/T FRANCE
1973
1985 67.6 65.7 86.3 76.5 48.7 55.0 10.1 2.6 47.3 37.0 63.0 52.7 24.5 38.8 U.K.
1973
1985 72.9 74.3 93.0 88.3 53.1 60. 1 11.3 3.3 85.5 69.1 30.9 14.5 24.9 38. 1 GERMANY
1973
1985 65.2 68.8 89.1 79.9 49.6 50.4 0.8 8.6 54.9 55.9 45.1 44.1 23.3 26.2 ITALY
1973
1985 58.9 59.7 84.9 79.2 33.9 40.8 10.5 6.2 46.3 43.2 53.7 56.8 60.2 59.6 SPAIN
1973
1985 61.4 56. 1 91.5 78.7 33.6 32.4 21.4 2.5 74.0 64.2 26.0 35.8 50.8 47.7 Source: Historical Statistics, OECD, Paris 1987.
RA: Rate of activity; MRA: Male rate of activity; FRA: female rate of activity; RU: rate of unemployment; MU/TU: male unemployment over local unemployment; FU/TU: female unemployment over total unemployment; YU/TU youth unemployment over total unemployment.
the fundamental component of household income is seldom put at risk, and that women and young people suffering from a lack of income are protected by the safety-net provided by the family. In the U.K., on the other hand, unemployment has a much more devastating effect, cutting the main source of household income and pushing households with unemployed heads to the bottom level of income distribution, as is illustrated in the U.K. report. The link between unemployment and poverty in the U.K., and the lack of a clear relationship between the two in Italy, emerges from the poverty studies on Europe, and confirms the different impact unemployment has on household income in the two countries. Other countries fall between Italy and U.K. A more balanced situation is found in Germany, where the male and female rates of unemployment are similar, and where youth unemployment is the lowest of the countries considered. The position in France is a moderate version of the Italian situation, with a female unemployment rate twice as high as the male one, and a significant proportion of youth unemployment. Spain has very high rates of both male and female unemployment, and very high youth unemployment amounting to 50% of total unemployment. There is a significant number of households with unemployed heads, and their per capita income is half that of households with full time employed heads.
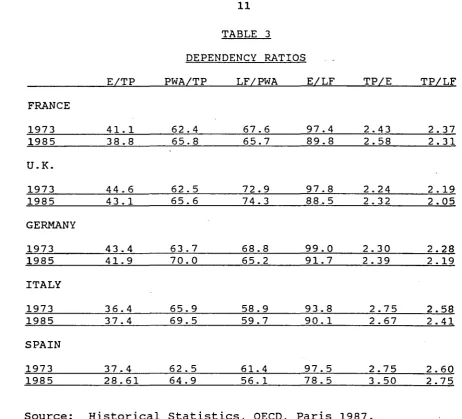
Changes in the population of working age and in the activity and unemployment rates affect national income, and hence household and per capita income, by means of changes in the number of employed people over the total population. The values of this ratio for European countries in 1973 and 1985, are shown in Table 3, and expressed as the product of the share of the population of working age of the total population, the share of the labour force (employed and unemployed) of the population of working age and the share of the employed of the labour force. The Table also displays the values of two slightly different definitions of the "dependency ratio": total population over employed people and total population over labour force. The dependency ratio can be usefully interpreted as the average number of persons who must be maintained by the average level of income of one employed.
The values of the "dependency ratio" differ widely between countries. One group of countries, with relatively low dependency ratios, is composed of the U.K., Germany and France.
The lowest value is that of the U.K., due to a particularly high value of both the male and female rate. During the seventies the dependency ratio, measured over the labour force, decreased slightly, because of the rise in women's participation and in the share of the population of working age. The low level of the dependency ratio in
E/TP
TABLE 3
DEPENDENCY RATIOS
PWA/TP LF/PWA E/LF TP/E TP/LF
FRANCE 1973
1985 41.1 38.8 62.4 65.8 67.6 65.7 97.4 89.8 2.43 2.58 2.37 2.31 U.K.
1973
1985 44.6 43.1 62.5 65.6 72.9 74.3 97.8 88.5 2.24 2.32 2.19 2.05 GERMANY
1973
1985 43.4 41.9 70.0 63.7 68.8 65.2 91.7 99.0 2.30 2.39 2.28 2.19 ITALY
1973
1985 36.4 37.4 65.9 69.5 58.9 59.7 93.8 90.1 2.75 2.67 2.58 2.41 SPAIN
1973
1985 37.4 28.61 62.5 64.9 61.4 56.1 97.5 78.5 2.75 3.50 2.60 2.75 Source: Historical Statistics, OECD, Paris 1987.
E: Employment; TP: Total population;
PWA: Population of working age; LF: Labour Force,
offset a fall of 4 points in the rate of activity, stabilising the dependency ratio. France represents an
between the activity rate and the share of the population of working age. Spain is an extreme case of a high and
increasing dependency ratio. The high value is the cumulative result of the lowest share of the population of working age, the lowest rate of activity and the highest rate of unemployment of all the countries considered. The increase of the ratio between 1973-1983 was produced by the rise in unemployment and the fall in the rate of activity.
4. THE EVOLUTION OF ECONOMIC INEQUALITY IN EUROPE
Trends in inequality in household income distribution throughout the seventies and early eighties have not been uniform in the European countries. In France and Germany there was a significant decrease in income inequality, in Spain and Italy substantial stability, and an increasing disparity in the U.K.
Between 1970 and 1979 in France the Gini coefficient decreased from 0.444 to 0.404 and the two relative Lorenz curves did not intersect, denoting an unambiguous reduction of inequality. The concentration of income decreased for all types of household considered i.e. working households, wage-earner households and non-working households. The level of concentration remained much higher within non-working households than within working households and was particularly low within wage earners households. The structure of deciles changed in favour of the bottom 50%, and especially the third decile, and to the disadvantage of the two top deciles.
From 1970 to the early eighties in Germany there was a significant shift towards greater equality, with a decrease of the Gini coefficient from 0.392 in 1970 to 0.334 in 1984. The bottom quintiles all increased their share of income at the expense of the fourth and more especially the top quintile. Concentration was reduced for households of every size and type considered, except for the one person and the one earner households. Inequality was relatively high for the small size and the one earner households. This trend towards equality was, however, reversed in 1985 when the Gini coefficient jumped from 0.334 to 0.352 and the top quintile recovered part of the income share lost in the previous fourteen years. Whether 1985 represents the start of a new trend or just a short term interruption of the previous trend is difficult to predict; however, the economic policy measures implemented by the conservative governments since 1982 suggest that the former is the more plausible hypothesis.
particularly in favour of the first decile and to the detriment of the top two deciles only.
The dispersion of household expenditure remained remarkably stable in Italy from 1976 to 1984, and neither the Gini coefficient nor the structure of deciles have undergone modifications. The concentration of income decreased slightly between 1980 and 1985 with a reduction of the Gini coefficient from 0.317 to 0.306; however, the bottom 50% did not profit much from this reduction which cut the share of the top decile in favour of the sixth, seventh and eighth deciles. Inequality, as in other countries, is higher for the one and two person households than for larger families.
The U.K. is the only country where a significant increase in inequalities occurred between 1973 and 1984. This period can, however, be divided into two different phases: from 1973 to 1979, and from 1979 to 1984. Throughout the seventies there was an increase in inequality
in original income due to a rise in the share of income of the four top deciles, and the Gini coefficient increased from 0.407 to 0.426. However, the inequality of household distribution in gross income remained unchanged throughout the period denoting an offsetting action by social transfers. After 1979 there was again a marked rise in the
inequality of original income with an increasing of the Gini coefficient from 0.426 to 0.471 in 1984. The State redistributive action by means of taxes and social transfers was not strong enough to balance this tendency of original income, resulting in an increase of inequality in gross and in disposable income. From 1979 to 1984 the Gini coefficient rose from 0.342 to 0.376 for gross income and from 0.316 to 0.337 for disposable income. The increase in inequality is unambiguous since the Lorenz curves for 1984 lie entirely above the Lorenz curves for 1973 and 1979.
institutional level prevailed in most countries. Economic policies were aimed at abating inflation, restoring profitability in industry, introducing elements of flexibility in the labour market and at limiting the role of the State in the economy while economic growth, high employment and social progress no longer received the same general consensus as policy objectives.
The dissimilarity in the evolution of income distribution between European countries, in spite of the many similarities in economic trends and economic policies, confirms the result of the previous research of EFER on the striking combination of common elements .and national differences in European economic development after the
second world war.5 In the fifties and sixties all European
countries experienced a prolonged period of economic growth following a broadly similar model of development (known as the "Fordist' model of development in the literature of the
French "regulation' school,6) of which it is possible to
identify the major features in each country. However, behind the common general characteristics, the concrete adaptation of the Fordist model of development was inevitably specific to each country, reflecting the persistence of deep differences in European societies. In the same way, the crisis of the Fordist model of development in the seventies was common to all countries producing similar phenomena all over Europe, and raising the same important questions on the kind of society we live in. But again the concrete forms assumed by these phenomena and the answers given to these questions were inevitably specific to each nation.
The rise in unemployment was, for instance, a general phenomenon, but the social groups hit by the loss or the lack of jobs were not the same in the different countries; the ideological attack on the Welfare State was widespread all over Europe, but its intensity and effectiveness differed drastically from country to country; the claim for more flexibility in the labour market was almost universal but the forms in which these elements of flexibility have been introduced, reflect the specific characteristics of industrial relations and industrial structure in each country. It is not surprising therefore, that a common slowing down of growth in real household income had far from homogeneous consequences on the equality of distribution.
Important differences between European countries can also be found in analysing the causes of changes in distribution.
Boyer, "La flexibilité du travail en Europe", Editions La découverte, Paris, 1986.
To analyse these changes it is useful to distinguish between the changes resulting from the working of market forces, changes deriving from State action, and changes caused by transformations in the structure and behaviour of
the family unit.7 While the role of the market and the state
in producing changes in distribution of income is widely recognized, the role of the family is often ignored. However, as we have already seen, household income distribution is affected by changes in the size and age composition of the family, as well as by changes in the labour market in relation to family members. A proper consideration of the family unit is, therefore, crucial for a better interpretation of changes in income distribution and, in particular, to explain the apparent lack of coherence arising at times between expected changes in household income ineguality, considering exclusively state and market forces action, and the actual changes in inequality which reflect
structural modifications of the family as well.8
In France the decrease in inequality is mainly the result of developments in the labour market, favourable to employees and low paid workers, and of a rise in social transfers favourable to low income families. The share of wages throughout the seventies rose from an average of 49% in 1969-73 to an average of 55% between 1974-76, and remained relatively stable until the end of the decade. This shift in income shares was accompanied by a significant narrowing of earning differentials by socio-economic class and sex. On the expenditure side of the welfare system, the increase in the rate of pensions benefitted inactive households, and the rise in unemployment allowances accrued exclusively to
7. Statistical data related to the wage system, the
welfare system and household disposable income is not homogeneous. Therefore the impact of changes in the wage and welfare systems on household distribution can be assessed only qualitatively and with a certain degree of uncertainty.
8. It may be useful for the interpretation of the
evolution of inequality to keep in mind two characteristics of the Gini coefficient. Firstly, it measures inequality in household income distribution without allowing for different sizes. Secondly, it measures the overall concentration of income regardless of the presence of phenomena of internal mobility. The first characteristic, in particular, may produce some paradoxical results. Since large families generally have a higher household income than small families, an improvement in the relative position of small size families normally results in a decrease of the Gini coefficient, even if, in per capita terms, the large families are much poorer than small families.
working households. The extension of social cover for various transfer items benefitted mainly low income households, such as farmers. Finally, increases in family allowances, which in France play an important redistributive role, have been more selective since 1974 mainly going to manual and clerical worker households whose head is often an unmarried woman with children to care for. On the revenue side, various changes in tax legislation in the seventies and early eighties increased the share of taxes paid by high income earners, resulting in a reduction of inequality in disposable income. Two changes in the family unit may also have affected income distribution: the increase in the number of married couples with husband and wife both working and the decrease in the average family size. The first phenomenon probably reduced inequality in household income because the differentials within women's earnings are narrower than the differentials within men's earnings, and because in France working women are uniformly spread among all social classes. The second phenomenon probably caused increased inequality because of the high concentration of income in small size households where single adults and couples without children have very different levels of income from retired people living alone or in couples.
In Germany between 1970 and 1978 developments in the primary distribution of income and in the welfare system were responsible for the reduction of inequality. The adjusted wage share rose from about 62% in 1970 to 66% in 1975, thus lessening the reasonable assumption that non wage earners were concentrated in the higher deciles. Expenditure on the four main items of social benefits - pensions, unemployment, sickness and accident insurance - increased rapidly because of a rise in the level of benefits and the number of beneficiaries. Because of their concentration in the lower deciles of income distribution, the high proportion of transfers going to pensioners and the unemployed contributed to a reduction of inequality. Changes in the family structure during the period, such as a reduction in the average size and the related increase in the share of single person households, had the opposite effect, but they were not strong enough to offset trends in the labour market and in the welfare state. After 1978 the wage share declined and pay differentials widened, while the growth of social transfers stopped. Reduction of inequality was produced by the impressive rise in the share of multi-earner households, a category which shows a low and decreasing income concentration. The rise in the share of this type of family reflects a socially widespread increase in the participation of married women with relatively low pay differentials. The Gini coefficient rise in 1985 can be attributed, hypothetically, to the conservative policies which produced changes in the welfare system which were unfavourable to low income families, such as a negative growth of social transfers, a rise in the share of transfers going to high
In Italy several phenomena which occurred in the seventies, such as the rise in the wage share, the narrowing of wage differentials, the rapid increase in social transfers and in direct taxes pointed to a reduction of inequality. The only phenomenon which had the opposite effect was the reduction in the average size of the family and the related increase in the share of one person households. After the second oil shock some of these trends towards equality were reversed. The share of wages declined, pay differentials widened and unemployment increased rapidly. However, these two phases, which appeared so clearly to the economic observer, did not produce different trends and the inequality of household income distribution remained remarkably stable throughout the whole period. We must therefore conclude that the redistributive effects originated in the market place, and State action, have been weaker than is usually expected, and certainly weak enough to have been counter-balanced by tendencies in both the structure and behaviour of the family unit. This leads us to the further conclusion that in Italy, the shift in the balance of power between classes, social groups, and political parties which has taken place at political, cultural and social levels, did not result in any significant change in the equality of income distribution.
The slight decrease in inequality in Spain is mainly due to the development of the Welfare system throughout the seventies. Fiscal pressure and public expenditure increased rapidly in that period, even if in 1981 their levels were still very low compared to the standards prevailing in Europe. On the revenue side of the system, two aspects of the increase in taxation are worth mentioning: firstly, the increase in the share taken by direct taxes; secondly, the high share of taxes levied on labour income (85%) , and the low share levied on capital income(15%). The former probably reduced income concentration within working households, while the latter widened the gap between the income of employees and independent workers. On the expenditure side, the rapid increase of social transfers and, within them, of pensions and unemployment benefits, had a more powerful redistributive effect in decreasing income inequality. Developments in labour relations had less clear-cut effects on income distribution. The adjusted share of wages remained relatively stable throughout the seventies, while in the mid-seventies there was some narrowing of wage differentials. The rise in unemployment, and its economic consequences were serious, because it hit mainly low income groups, and because of the low level coverage of unemployment allowances. More devastating effects were probably avoided by the shock absorber role played by the larger Spanish families, to youth and female unemployment.
through the implementation of income policies. In spite of these government policies, ineguality in original income increased during the period because of the rise in unemployment, and because of changes in the structure of the household. The particularly high level of unemployment reached at the end of the seventies had particularly severe effects on household income, because a considerable part of it was composed of males in the middle age classes. The family structure changed by an increase in the number of pensioners and in the number of married women working. Both these trends contributed to an increase income inequality. The former is the result, common to other European countries, of the ageing of the population, and it increased inequality by swelling the number of people in the lower deciles of income. The latter increased inequality because of the relative concentration of women at work in high income deciles, unlike in other countries, where the phenomenon was observed to be uniformly widespread across society. The redistributive action of the welfare state, through large increases in all items of social transfers, was, however, very effective, following the commitment of the Labour Government to improve the relative position of low income groups and the allowances to beneficiaries. As a result, no changes occurred in the equality of gross income distribution. After 1979, with the Conservative Government
in charge, labour market relations were left more to supply and demand. This resulted in a further rise in unemployment and in a widening of wage differentials. The commitment of the government to limit the role of the State in the economy was implemented, through, among other things, cuts in social expenditure and regressive changes in the system of taxation. The obvious result was an increase in inequality, not only in original income distribution but in gross income and disposable income distribution as well.
5. THE PATTERN OF INEQUALITY
Inequality in income distribution emerges from our analysis as a multidimensional phenomenon. Consequently, levels of household income cannot be determined by the use of a single indicator, many different factors have to be taken into account.
Thus, the emphasis on 'complexity' is perfectly justified and our analysis of income distribution fully confirms this fundamental characteristic of modern European societies; however, social complexity should not be confused with social muddle nor allowed to obscure what actually happens. Our analysis, from the specific perspective of the process of income distribution, singles out various factors which lead to inequality, and shows that from the relationship between these factors and the whole economic system, a pattern of income inequality, however complex, can be observed.
In all countries there are three sets of factors which have been found to play an important part in determining income inequality. We will analyse them in turn.
Some income inequality arises from differences in the phase of the life-cycle in which households find themselves. Each single household is, in fact, likely to occupy different positions in the income hierarchy throughout its life, as income changes with changes in the age and composition of the family. Individual income is a function of age, and generally follows a well identified temporal pattern, rising to the age of retirement and falling afterwards. Household income, however, depends on the level of individual incomes and on the number of people working which, in turn, is affected by the composition of the family, i.e. the relative numbers of adults and children. Young couples, without children, may therefore receive a relatively high income, in spite of low individual earnings, if husband and wife are both working. The birth of children has a negative effect on household income, particularly in the pre-school phase of their life when the woman is likely to become economically inactive, or to reduce her working time. Household income recovers in the following phase when children have grown up and the woman finds it easier to work, thereby adding her income to that of the husband, which, in the meantime, has increased with his age. Family income reaches its peak when adult children, still living in the original family, add their personal income to that of parents still working or receiving a pension. Finally, household income falls abruptly as adult children leave the original family and the parents retire.
The household's standard of living only partly follows the path of its income, being determined, in each phase of the family's life-cycle, by the adequacy of the household income to meet it's changing needs in respect of changes in size and composition.
characteristics of the socio-economic system should be appreciated. There is nothing "natural', for instance, in young peoples' lower than average income; but even assuming that this must be so because of hard economic laws, how low this income actually is depends on the characteristics of the demand for labour, and on the type of employment policies pursued in each country. The presence of children, to take a second example, is a factor which inhibits work by women; however, women's propensity to work while their children are of pre-school age is influenced by the level and quality of childcare facilities, and by the extent of the demand for labour, requiring more flexibility in working time or in the duration of the job. The size of the family, to take a further example, has a negative affect on the standard of living, but its impact can be more or less offset by fiscal concessions or by family supplements. It is important to emphasize that even inequalities arising from life-cycle aspects of distribution are largely affected by the interaction between the wage and welfare systems and family behaviour; and also that differences between countries in the pattern of ineguality can only be picked out by reference to these aspects of the socio-economic structure.
A second set of factors, which has been found to be a determining cause of inequality, relates to the household's relationship with the labour market. Essentially this comprises the employment status of the head and the number of workers in the family.
countries like Spain, the U.K. or Italy the retired households are more often found in the lower part of income distribution, although this does not seem to be the case in France. Peculiarities in the structure of national welfare systems may produce differences in treatment within a homogeneous group of population in each country. This is the case, for instance, in the U.K., where a wide income gap divides State pensioners and people dependent on private pensions, and in Italy, where many types of pension coexist with very different levels of benefits.
The number of workers in the family, as mentioned above, is an important cause of income disparities. Apart from being affected by demographic factors, changes in the number of workers have, historically, resulted from the interaction between the growth of the welfare systems, the characteristics of the demand for labour and long run cultural transformations in family behaviour. This factor of inequality has become more important in all European countries due, mainly, to the impressive rise in women's participation over the last decade. The relevance of this factor of inequality in a comparison between countries depends on the relative levels of the female rate of activity, and on the characteristics of female employment. Differences in the former, already analysed, have shown wide disparities between the U.K., Germany and France on the one hand, and Spain on the other, with Italy lying in the middle. Differences in the latter depend mainly on the share of part-time work, leaving aside disparities in pay differentials by sex. The income contribution of working women is higher in France than in the U.K., due to the prevalence of full time work in France and of part time work in the U.K.
The third set of factors which helps to determine the household income position relates to the social class of the head, and is comprised of the sector of activity, the socio-professional category, the skill and the level of education.
The income of the head emerges from our analysis as the central component of household income in all countries, even in those where married women participate and their income contribution is relatively high. The increase in the number of workers in the family has, therefore, modified the sexual division of labour within the family, leaving, unaltered, the priority of the respective responsibilities. Differences in the head of household's earnings are therefore still crucial in determining the income and standard of living of each household.
The evidence supplied in the national reports in relation to employed heads shows that social class variables still play a definite role in determining the level of income. Pay differentials are particularly high by socio-professional category and by skill, though they are less important by sector of activity, with the exception of workers in agriculture in some countries and areas. Also significant is the positive relationship between the level of education and income range, as it relates income and education by socio-professional category. Finally, a clear relationship emerges between the socio-professional category of the father and the level of education of the children denoting a transmission of inequalities from generation to generation. Quite clearly the link between individual
income, socio-professional category and education is far from being perfect or invariable. In various countries pay differentials have undergone important modifications, with gradual and significant changes in the relative position of different social groups; new professional categories have emerged while others have declined, following the changing structure of employment. A weakening of the relationship between education and income has occurred, as shown by the presence of high income categories with low levels of education, particularly within the self-employed. However, on the whole, our results, though based on rough and unsatisfactory criteria of disaggregation, show how the largely held opinion, that we live in a sort of social chaos where any class distinction has become meaningless, is unfounded, at least as far as income distribution analysis is concerned.
found in significant numbers in the upper deciles as well; professional, technical, administrative and managerial households can mostly be found in the upper deciles, but a not irrelevant share lies in the central deciles as well. This relative dispersion of income brings us back to the first finding of our analysis, that is, the multidimensional aspect of distribution, and the impossibility of positioning unequivocally a household in an income bracket by the use of a single criterium. The social class of the head is still a key element of division in income distribution but its effects can be corrected or accentuated by the working of other factors of inequality, and by the contribution to the household income of other sources of income.^
Using these three sets of factors a general pattern of income inequality for European countries can be described, and the household position in the income distribution pattern is determined by specific combinations of these factors. To conclude these introductory notes, three final qualifications to such a pattern are worth mentioning.
Firstly, phenomena of upward and downward social mobility, or even situations of poverty are produced by particularly favourable or unfavourable combinations of these
factors, and national reports offer a wide range of household types according to the various possible combinations.. For instance, households with more than one worker are unlikely to be found at the lower level of distribution, even if the head belongs to a low income socio-professional category, while one earner households of middle to high income heads, with high dependency ratios, may experience a significant deterioration of their standard of living; manual or agricultural households experiencing unemployment, or with one earner only, are concentrated at the bottom of the distribution level together with retired people living alone on modest pensions, and with single parent families headed by inactive women. The study of these combinations of factors is clearly crucial to the identification dynamic sequences leading to relative deprivation, and population groups which are likely to be disadvantaged.
Secondly, the relative importance of each of these three factors varies from country to country revealing interesting differences in the social classes' structure and in the labour market conditions. For instance, in their report on the U.K., Sara Horrell and Jill Rubery maintain that the
9. This does not apply to the top level of
distribution - the few giants of Pen's parade - the position of which remains untouched. See J. Pen 'A parade of dwarfs
(and a few giants)1 in 'Wealth, Income & Inequality' A. B.
labour market relationship öf the household has become a more reliable indicator of the household position in the distribution of income than the social class of the head. Whereas, Veronigue Sandoval finds that in France other
factors, however important, seldom reverse the relative income position obtained by belonging to a social class. These and other differences show that the common pattern of
inequality we have described, must be adapted to the specific situation of each country.
Thirdly, the pattern of income inequalities described does not include all possible factors working at national level. For instance, the Italian situation cannot be explained without giving a central position to the geographical dimension of inequality; regional disparities have also been found to play an important role in the Spanish experience, and is a guestion emerging in the North and perhaps, in the U.K. as well. In Germany, the U.K. and France indirect information suggests that racial factors play a part in determining the bottom level of income distribution. All this implies that the common pattern of
INCOME DISTRIBUTION IN FRANCE
1. INTRODUCTION
After the years of growth that France had experienced during the early sixties, 1968 marked the beginning of a crisis.
First there was a social crisis. Besides the students' revolt, nine million employees were on strike. The growth in national income did not prevent the growth of income inequalities, and the first demand on the government was to make a significant increase in the minimum wage.
It was also a political crisis, after 10 years, of government with General De Gaulle at the head. Although of the government. Though 1968 gave the right the greatest majority it had known since the war, De Gaulle left the government in 1969. At the same time, France began to restructure its industry as part of its greater integration into the European Common Market. Moreover, the political agreement which took place in 1972 between the Socialist Party and the Communist Party lead to increased support for the Socialist Party and to its accession to the Presidency of the Republic and to government in 1981.
The restructuring of French industry which subsequently took place occurred within a serious economic crisis with numerous firms going bankrupt, with thousands of jobs ebing lost, and with a break in the upward growth of national income.
The consequences of this crisis for income distribution in France is the subject of this chapter.
2. STRUCTURAL CHANGES AFFECTING POPULATION AND INCOME SINCE 1970.
The evolution of a population's standard of living depends on its growth in size in relation to that of the National Income. This in turn is conditional upon the number of people working in relation to the rest of the population. Finally, income distribution between households depends on both the non-employed and the employed in these households, as it depends on the share of social transfers in the National Revenue.
2.1 Changes affecting the population of France
French population are influential: the ageing population, the increase in the female rate of activity, unemployment growth, and the improved qualifications of employees.
2.1.1 Changes in the age structure of population
Between 1968 and 1982, we observed a decrease in the number of children and young people under 19 years old in relation to the size of the working population (France getting in line with other European countries). This trend, together with a static retired population, has been influenced by the growth of per capita income.
In the future, however, we can expect a decrease in the number of people between 20 and 59 years of age, and an increase in people over 60 years old.
TABLE 2.1
AGE DISTRIBUTION OF POPULATION
1968 1975 1982
Under 19 years old
From 20 to 59 years old Over 60 years old
(Source: Census)
32.2 30.7 28.7 49.0 50.3 52.8 18.8 19.0 18.5
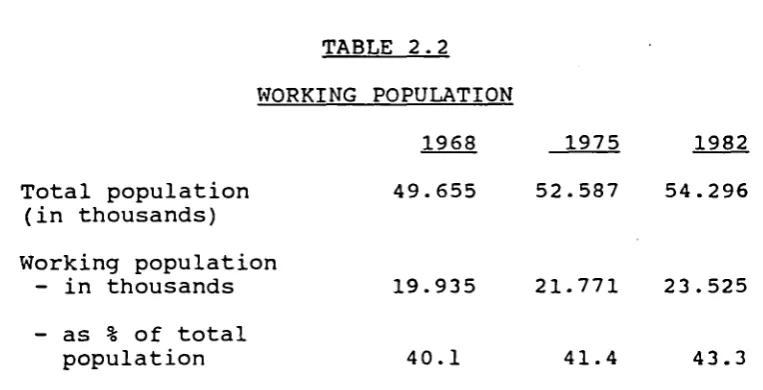
2.1.2 Increase in Women's labour force participation Between 1968 and 1982 the working population grew faster than the whole population because of an increase in the labour market participation of women between 20 and 60 years of age (see table 2(c)).
The rate of female participation in the labour force in France was 34.8% in 1984, very close to that of Germany
TABLE 2.2 WORKING POPULATION
1968 49.655
1975 52.587
1982 54.296 Total population
(in thousands) Working population
- in thousands 19.935 21.771 23.525 - as % of total
population 40.1 41.4 43.3
There has been an increase of more than 20 points in their rate of activity in the last 20 years for those between 20 and 50 years old. It cannot be related to a great expansion
of part-time work,10 because such an expansion did not occur
in France, and in 1986 only 15% of women employees (and 2% of men) were part-timers.
2.1.3 A dramatic increase in unemployment since 1974. Unemployment affected only 2.2% of the working population in 1968, 3.8% in 1975 but 8.8% in 1982 and 9.3% in 1986.
At the beginning of the seventies (1971) the rate of unemployment was 2.9% for women and 1.5% for men. Fifteen years later the figures were 11.2% and 7.9% respectively.
The proportion of young people, under 25 years old has decreased slightly (from 37.3% to 34.5%), not because they find a job more easily, but because they remain at school until they are 18 or over.
Furthermore, the increasing proportion of unemployed who are between 25 and 49 years old (from 38.6% to 51.8%), in relation to those who are 50 years old or more cannot be put down entirely to the expansion of early retirement, and must in part be due to the numerous redundancies in the manufacturing industry.
2.1.4 Changes in the structure of the labour force
The number of employees as a percentage of the working population was 79.5% in 1970, higher than that observed in Italy (68.2%) but less than that of Germany (83.3%) and of
the United Kingdom (92.4%)
84.1% in 1982. It has increased since, and was
On the other hand, the number of farmers in 198 2 represented only 60% of their number in 1968. In fact the integration of France into the Common Market, where the competition was greater, led to the disappearance of thousands of little farms.
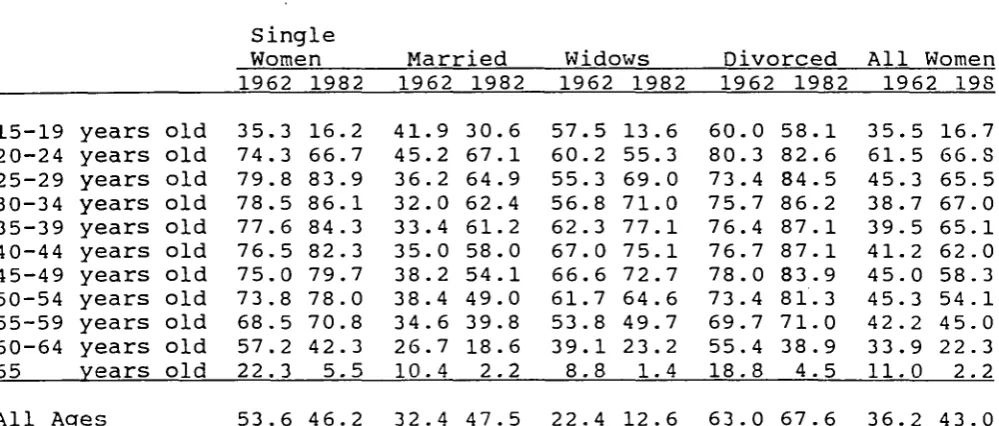
[image:32.595.48.548.439.652.2]Changes have also occurred among employees. They work more and more often in the service industry. The employees who worked in the manufacturing industry represented 72% of the employees in 1968, 66% in 1973 and only 54% in 1984. Most of them (70%) were manual workers against only 18% in the service industry. In 1984, manual workers still represented 65% of the employees working in the manufacturing industry but their percentage of total population of employees decreased. The women who swelled the labour force between 1973 and 1983 belong to the clerical and salaried staff levels. The men belong to the salaried staff and executive levels. TABLE 2.3 15-19 20-24 25-29 30-34 35-39 40-44 45-49 50-54 55-59 60-64 65 years years years years years years years years years years years All Ages Source: WOMEN·S old old old old old old old old old old old
PARTICIPATION IN THE LABOUR ACCORDING TO THEIR STATUS
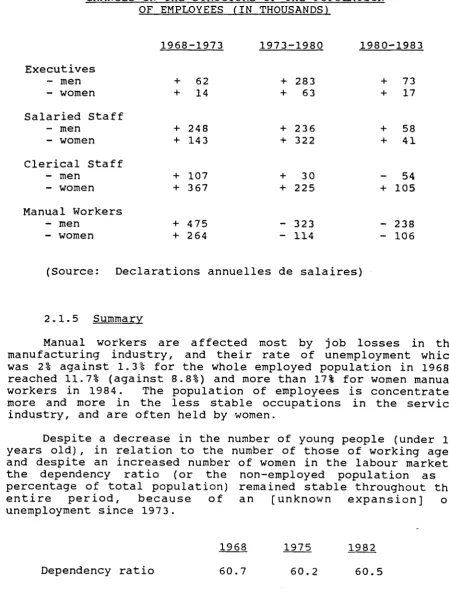
CHANGES Executives - men - women Salaried Staff - men - women Clerical Staff - men - women Manual Workers - men - women IN OF THE
TABLE 2. STRUCTURE EMPLOYEES 1968-1973 + + + + + + + + 62 14 248 143 107 367 475 264 (IN 4
OF THE POPULATION THOUSANDS) 1973-+ + + + + + --1980 283 63 236 322 30 225 323 114 1980-+ + + + -+ --1983 73 17 58 41 54 105 238 106 (Source: Declarations annuelles de salaires)
2.1.5 Summary
Manual workers are affected most by job losses in the manufacturing industry, and their rate of unemployment which was 2% against 1.3% for the whole employed population in 1968, reached 11.7% (against 8.8%) and more than 17% for women manual workers in 1984. The population of employees is concentrated more and more in the less stable occupations in the service industry, and are often held by women.
Despite a decrease in the number of young people (under 19 years old) , in relation to the number of those of working age, and despite an increased number of women in the labour market, the dependency ratio (or the non-employed population as a percentage of total population) remained stable throughout the entire period, because of an [unknown expansion] of unemployment since 197 3.
It appears that while the manufacturing industry was throwing out men manual workers women, as well as swelling the labour market in the service industry, have played determining roles in regulating the labour force, in accordance with the needs of the market, and in the equilibrium of household resources.
2.2 Changes affecting the structure of income
The expansion of the work force obviously increased the importance of wages, but it also affected wage differentials. If the growth of transfer payments has not slowed down as much as original income since 1973, the social transfers structure has changed and the recipients are no longer the same.
2.2.1 The increasing importance of wages and changes in wage differentials
In 1973 wages represented 54.6% of original income, but 66.1% in 1983. In other respects the trend towards a narrowing of wage differentials, which began in 1968, has continued. The gap between the average male and female wage, which was 33% of the male wage in 1968, was only 26% in 1983, and even less if calculated with a constant structure of employees. The massive entry of young women and men into the salaried staff and executive groups partially explains the narrowing of wage differentials.
TABLE 2.5 INDEX OF WAGES ACCORDING TO
Executives Salaried staff Clerical staff Manual workers All employees
1968 350 166 88 79 100
SOCIO-ECONOMIC
1973 325 156 87 81 100
CLASS OF EMPLOYEES
1980 260 134 84 82 100
1983 253 131 82 80 100 (Source: Declarations annuelles de salaires)
clerical workers of 41 to 50 years of age are the ones who earn more, but on average only about 12 per cent more than the mean. On the other hand, among salaried staff, those who earn more are the oldest. They are 60 to 65 years old, (even older than 65 among the executives).
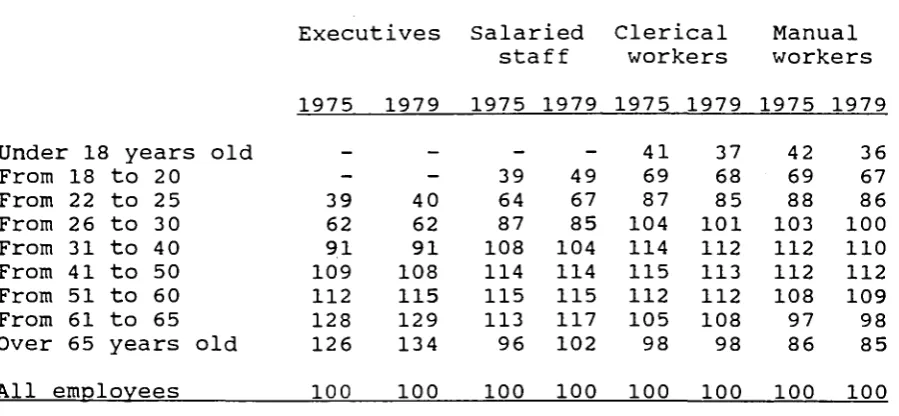
Though .we do not have much statistical data on these wage differentials, it appears that there is a trend towards a slight increase (Table 2.6).
TABLE 2.6 INDEX
[image:35.595.69.519.285.493.2]Under 18 years From 18 to 2 0 From 22 to 2 5 From 26 to 3 0 From 31 to 4 0 From 41 to 50 From 51 to 60 From 61 to 65 Over 65 years All employees
OF WAGES ACCORDING
SOCIO-old
old
TO AGE, FOR DIFFERENT -ECONOMIC CLASSES OF EMPLOYEES
Execut 1975 _ -39 62 91 109 112 128 126 100 ives 1979 -40 62 91 108 115 129 134 100 Salaried staff 1975 __ 39 64 87 108 114 115 113 96 100 1979 „ 49 67 85 104 114 115 117 102 100 Clerical workers 1975 41 69 87 104 114 115 112 105 98 100 1979 37 68 85 101 112 113 112 108 98 100 Manual workers 1975 42 69 88 103 112 112 108 97 86 100 1979 36 67 86 100 110 112 109 98 85 100 (Source: Declarations annuelles de salaires)
2.2.2 The growth of transfer payments and taxes
Social transfers made up 23.3% of gross income in 1970. In 1984 they made up 33.2%.
The government financial contribution to these payments was reduced from 22.5% in 1970 to 21% in 1980, but it has increased sharply since then because of government expenditure in favour of the unemployed. Income tax has been higher since the end of the seventies.
additional "half--point" in the "familiar ratio" (wriicn divide the total income of the household to calculate the income taxes to be paid) has been given to the tax-payers with at least 3
children to feed.11
TABLE 2.7 BURDEN
Original income Social transfers Gross income Direct taxes
OF SOCIAL
1970 76.78 23.3
100 6.2
TRANSFERS
1975 73.1 26.9 100 6.3
AND TAXES
1979 70.8 29.2 100 7.3
1984 66.7 33.2 100 8.9 (Source: C.E.R.C.)
Others have had a direct redistributive effect. This was the case with the change in the tax-table at the end of 1973 which benefitted poor tax-payers, and also the exceptional
increase of 10% in income tax which the salaried staff households, with two people working, had to pay. And also the progressive additional tax created in 1984, and the introduction of an additional step on the tax-table at a higher rate.
On the other hand, the national insurance contributions paid by employees have increased in relation to those paid by employers.
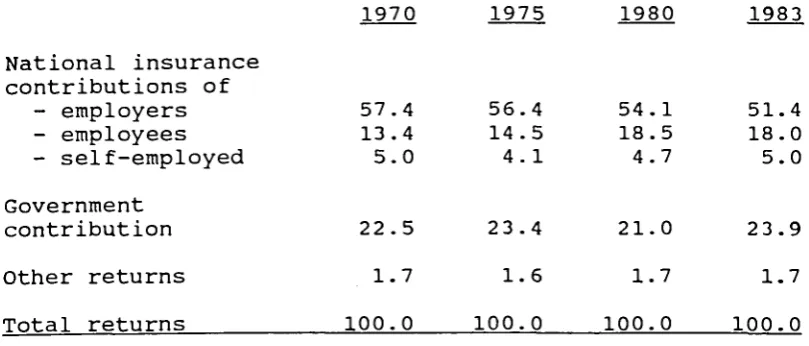
2.2.3 The Welfare State
Despite a steady decrease in the rate of growth of social transfers since 1975 they have, nevertheless, helped to deaden the shock of the dramatic slowing down of wages on the disposable income of households, especially for households with one wage-earner.
1 1. A one person household has a familiar ratio of 1. A
married couple with no childred
TABLE 2.8 FINANCING STRUCTURE OF
National insurance contributions of
- employers - employees - self-employed Government
contribution Other returns Total returns
1970
57.4 13.4 5.0 22.5 1.7 100.0
1975
56.4 14.5 4.1 23.4 1.6 100.0
WELFARE 1980
54.1 18.5 4.7 21.0 1.7 100.0
1983
51.4 18.0 5.0 23.9 1.7 100.0
TABLE 2.9
RESPECTIVE ANNUAL RATE OF GROWTH OF ORIGINAL INCOME, SOCIAL TRANSFERS AND DISPOSABLE INCOME
(measured as increases in purchasing power)
Original income (income from labour property)
Social transfers Disposable income
1970-1975
2.3% 6.3% 3.3%
1975-1979
0.4% 3.4% 1.1%
1979-1984
- 1.4% 2.4% - 0.6%
Within the total amount of social transfers, the contribution from family benefits and allowances decreased, despite a revival of family policy since 1974.
Between 1960 and 1974, the growth rate of family benefits was below that of average wages. Since 1974 this has no longer been the case. The family policy has become more selective, and is addressed almost exclusively to families with modest incomes.
ceiling. This only benefits the poorest, particularly single parent families. The family income supplement (complement familial), which was introduced in 1978 in place of several family benefits, is also reserved for families whose total income is below a fixed ceiling.
Health spending has also seen its share reduced despite a real growth in the number of recipients. This growth was due to the extension of social cover to non-wage earners, and to the action of a long-term trend, resulting from both progress in medical techniques and increased expectations of medical care.
The reduction of the share of health spending in the total amount of social transfers is, therefore, only a mathematical effect of the very high growth of unemployment allowances since 1975.
TABLE 2.10
RELATIVE SHARE OF VARIOUS ALLOWANCES
1970 1979 1984
17 38 39 2 4 100
14 32 42 7 5 100
13 31 40 11 5 100 Family allowances
Medical care Pensions
Unemployment allowances Other allowances
All
(Source: Comptes de la Nation - C.E.R.C)
Facing an unknown increase in the number of redundancies and job losses, the policy followed (through the main amendments of July 1979, November 1982, and April 1984) gradually abolished the particularly favourable conditions reserved for economic redundancies in favour of a greater homogeneity in the rates of compensation, and of an extension of the allowances to the unemployed who, before this, had received nothing. It was also used to create a pre-retirement allowance for the older employees who leave work before they are 60 years old.
For old people the minimum income paid to the poorest inactive households, was often revalued during the period.
TABLE 2.11
-MEAN ANNUAL RATE OF GROWTH OF HOURLY WAGE, PENSIONS PAID BY THE SOCIAL SECURITY ADMINISTRATION, AND
OLD PEOPLE'S MINIMUM INCOME average
1971-76 1977 1978 1979 1980 1981 1982 1983 198' Hourly
wage ' 14.5% 12.7% 12.6% 12.9% 15.3% 15.0% 15.4% 11.2% 7.( Pensions 13.9% 11.8% 10.3% 11.0% 15.2% 15.8% 12.6% 7.2% 7.' Old people
minimum 20.3% 15.8% 20.0% 16.7% 12.6% 23.8% 32.4% 9.2% 4.S inc.
(Source: Comptes de la Nation)
2.2.4 Summary
Not all households received the same benefit from the growth of social transfers and from the corresponding
increase in the burden of taxes paid.
The changes in fiscal policy, as we have already seen, have mostly profited the poorest, to the detriment of the richest. But social transfers do not deal with the redistribution of income, but with the meeting of people's needs. They also deal with compensation for expenses connected with a particular situation (illness, unemployment, retirement ·..) which may be that of the head of the household, or that of another member of the household, and which is not directly linked to the amount of total income the household receives each year.
That is how, for example, a member of Mr. Dupont ' s household (an executive), may receive a pension despite the fact that the increase in the amount of pensions mainly benefitted inactive households. On the other hand, the growth of unemployment allowances since 1975, and 1979, concerned working households almost exclusively, and more precisely wage earners.
beneficiaries of the extension of social cover to non-wage earners at the beginning of the period.
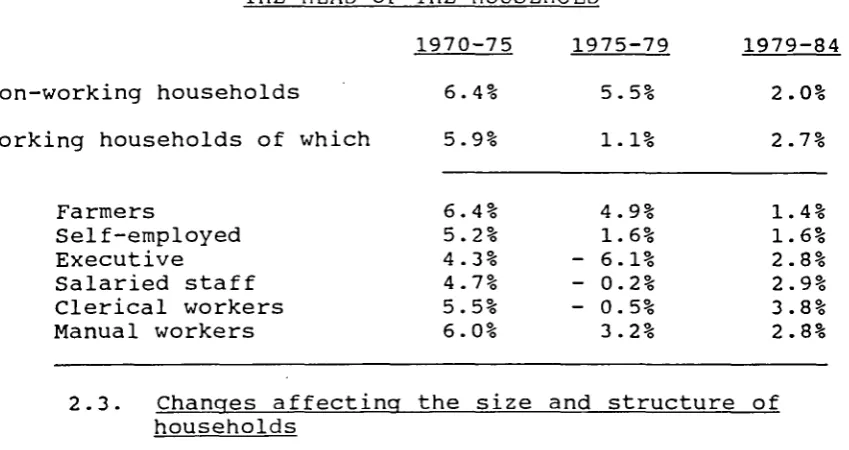
[image:40.595.81.506.252.477.2]Finally, family allowances were more profitable to manual workers with a modest income and, more often than the other groups, a large family, and to clerical workers whose head of household is often an unmarried or divorced woman (or a widow), with one or two children to care for.
TABLE 2.12
DIFFERENCES IN THE ANNUAL RATE OF GROWTH OF SOCIAL TRANSFERS ACCORDING TO THE SOCIO-ECONOMIC GROUP OF
THE HEAD OF THE HOUSEHOLD
Non-working households
Working households of which
Farmers
Self-employed Executive
Salaried staff Clerical workers Manual workers
1970-75 6.4% 5.9%
6.4% 5.2% 4.3% 4.7% 5.5% 6.0%
1975-79 5.5% 1.1%
4.9% 1.6% - 6.1% - 0.2% - 0.5% 3.2%
1979-84 2.0% 2.7%
1.4% 1.6% 2.8% 2.9% 3.8% 2.8% 2.3. Changes affecting the size and structure of
households
The decreasing size of average households, and the changes in the distribution of married couples among those where husband and wife are both working, and who have no children, and those where the husband is the only one to work and who have three children or more, also affect the distribution of per capita income.
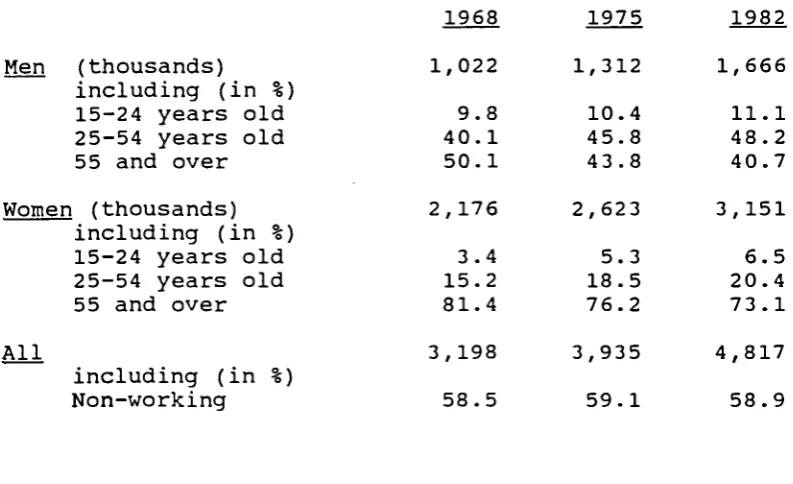
2.3.1 Increasing number of households composed of one adult
The number of households composed of only one adult increased at the annual rate of 1.7% during the sixties and at an annual rate of growth of 3% since 1968.
the number of single households is higher for men (3.5%) than for women (2.6%) and the percentage of single households composed of men or women of 2 5 to 54 years old increased throughout the period.
TABLE 2.13
HOUSEHOLDS COMPOSED OF ONLY ONE ADULT
Men (thousands) including (in %) 15-24 years old 25-54 years old 55 and over
1968 1,022
9.8 40.1 50.1
1975 1,312
10.4 45.8 43.8
1982 1,666 11.1 48.2 40.7 Women (thousands)
including (in %) 15-24 years old 25-54 years old 55 and over All
including (in %) Non-working
2 , 1 7 6 2 , 6 2 3 3 , 1 5 1
3.4 15.2 81.4 3,198 58.5
5.3 18.5 76.2 3,935 59.1
6.5 20.4 73.1 4,817 58.9
2.3.2 Increasing number of married couples with husband and wife both working
The number of these couples increased 33.4% between 1968 and 1975, and 19.8% between 1975 and 1981, against a decrease of 8.5% and 12.7% respectively, for married couples where the husband was the only one to work.
In 1968 couples where both husband and wife were working were mainly 40 years old and over, the younger couples being less numerous. Now they are more often under 40 years old, although this is not the case for married couples where the husband is the only one working.
2.3.3 Decrease in the size of the family
Between 1968 and 1982 we observed a sharp decrease in the number of large families, partly due to the increase in married women's participation in the labour force. But, as we see below, married women no longer stop working when they have their second or even third child, while, non-working married women with three or more children, are increasingly in a minority.
TABLE 2.14
CHANGES IN THE DISTRIBUTION OF FAMILIES (MARRIED COUPLES AND SINGLE PARENT FAMILIES) ACCORDING TO THE NUMBER OF CHILDREN THEY HAVE
1968 1982
No children One child Two children
Three children or more (of which 4 or more)
4 8 .