eurostat
%
EXTERNAL TRADE
Monthly statistics
1991
OFICINA ESTADÍSTICA DE LAS COMUNIDADES EUROPEAS
DE EUROPÆISKE FÆLLESSKABERS STATISTISKE KONTOR
STATISTISCHES AMT DER EUROPÄISCHEN GEMEINSCHAFTEN
ΣΤΑΤΙΣΤΙΚΗ ΥΠΗΡΕΣΙΑ ΤΩΝ ΕΥΡΩΠΑΪΚΩΝ ΚΟΙΝΟΤΗΤΩΝ
STATISTICAL OFFICE OF THE EUROPEAN COMMUNITIES
OFFICE STATISTIQUE DES COMMUNAUTÉS EUROPÉENNES
ISTITUTO STATISTICO DELLE COMUNITÀ EUROPEE
BUREAU VOOR DE STATISTIEK DER EUROPESE GEMEENSCHAPPEN
SERVIÇO DE ESTATÍSTICA DAS COMUNIDADES EUROPEIAS
L2920 Luxembourg Tél. 43011 Télex : Comeur Lu 3423
B1049 Bruxelles, bâtiment Berlaymont, rue de la Loi 200 (bureau de liaison) Tél. 2351111
Las publicaciones de Eurostat están clasificadas por temas y por series. La clasificación se encuentra al
final de la obra. Para mayor información sobre las publicaciones, rogamos se pongan en contacto con
Eurostat.
Para los pedidos, diríjanse a las oficinas de venta cuyas direcciones figuran en la página interior de la
contracubierta.
Eurostats publikationer er klassificeret efter emne og serie. En oversigt herover findes bag i hæftet.
Yderligere oplysninger om publikationerne kan fås ved henvendelse til Eurostat.
Bestilling kan afgives til de salgssteder, der er anført på omslagets side 3.
Die Veröffentlichungen von Eurostat sind nach Themenkreisen und Reihen gegliedert. Die Gliederung ist
hinten in jedem Band aufgeführt. Genauere Auskünfte über die Veröffentlichungen erteilt Eurostat.
Ihre Bestellungen richten Sie bitte an die Verkaufsbüros, deren Anschriften jeweils auf der dritten
Umschlagseite der Veröffentlichungen zu finden sind.
Οι εκδόσεις της Eurostat ταξινομούνται κατά θέμα και κατά σειρά. Η ακριβής ταξινόμηση αναφέρεται στο
τέλος κάθε έκδοσης. Για λεπτομερέστερες πληροφορίες σχετικά με τις εκδόσεις, μπορείτε να απευθύνεσθε
στην Eurostat.
Για τις παραγγελίες μπορείτε να απευθύνεσθε στα γραφεία πώλησης, των οποίων οι διευθύνσεις αναγράφονται
στη σελίδα 3 του εξωφύλλου.
Eurostat's publications are classified according to themes and series. This classification is indicated at the
end of the publication. For more detailed information on publications, contact Eurostat.
Orders are obtainable from the sales offices mentioned on the inside back cover.
Les publications d'Eurostat sont classées par thème et par série. Cette classification est précisée à la fin
de l'ouvrage. Pour des informations plus détaillées sur les publications, contactez Eurostat.
Pour les commandes, adressez-vous aux bureaux de vente dont les adresses sont indiquées à la page 3
de la couverture.
Le pubblicazioni dell'Eurostat sono classificate per tema e per serie. Tale classificazione è precisata alla
fine dell'opera. Per informazioni più dettagliate sulle pubblicazioni rivolgersi all'Eurostat.
Per eventuali ordinazioni rivolgersi a uno degli uffici di vendita Í cui indirizzi figurano nella 3
apagina
della copertina.
(¡) The introduction of the Single Administrative Document,
which not only covers trade in Community goods
between Member States but is also intended to be used
for the corresponding formalities in trade with non
member countries. This simplification of declaration pro
cedures in the exchange of goods marks an important
step towards completion of the internal market.
(ii) The simultaneous entry into force of a new goods classi
fication known as the Combined Nomenclature (CN),
which is intended to meet Common Customs Tariff and
statistical requirements alike. This nomenclature is
based on the Harmonized Commodity Description and
Coding System (HS), whose aim is to enhance the world
wide comparability of external trade statistics.
As a result of both these changes, customs and statistical
departments were faced with a considerable amount of work
until the procedures had been properly introduced and
tested and formed part of normal working practice.
This meant that there were delays in the forwarding of data
in all the Member States. In addition, there was bound to be
a higher quota of errors and corrections, so that the first
month's data are not directly comparable with those of the
preceding year and therefore need to be interpreted with
caution.
ned Nomenclature and the formerly used Nimexe, leading to
a break in the goodsrelated time series between 1987 and
1988. Up to December 1987 this Bulletin used the SITC Rev.
2, which was worked out using the 6digit Nimexe, while
from January 1988 it uses the SITC Rev. 3, which has been
drawn up using the 8digit subheadings of the Combined
Nomenclature.
As an aid to interpretation of the statistics, Eurostat has
published in Theme 6 'Foreign Trade, Series E: Methods'
brochures entitled 'Nomenclature of goods, CNNimexe cor
relation tables'. These provide a comparison between the old
and new nomenclatures as well as showing the links bet
ween the Combined Nomenclature (CN) and its offshoots,
Eurostat will be glad to provide users of European statistics
with any further information or explanations they may require
with regard to these new developments.
Important note
To seasonally adjust the European Community's
foreign trade time series, Eurostat applies the
"X11 /ARIMA" method, a package developed by the
Canadian "Bureau of Statistics".
former German Democratic Republic and East
Ber-lin, have been applied to the trade series including
the territory of the former German Democratic
Re-public and East Berlin.
As from October 1990, the Federal Republic of
Germany includes the territory of the former
Ger-man Democratic Republic, including East Berlin. As
a result, the trade figures reported for both the
Federal Republic of Germany and for the European
Community have been adjusted to incorporate this
new political reality.
To seasonally adjust the Community's trade series,
the seasonal factors obtained from the
Com-munity's trade series without the territory of the
Seasonally adjusted Community exports to the rest
of the world (extra-EC) continue their downward
trend. In December 1990, exports dropped by over
3% compared to November 1990. Seasonally
ad-justed Community imports from the rest of the world
(EC) remain high. In December 1990,
extra-EC imports were 1.7% lower than in November
1990. Trade between members of the European
Community (intra-EC) dropped by almost 4% in
December 1990 compared to November 1990.
EUR 12 Exports Extra-EC
Mrd. ECU
;
/
^
EUR 12 Imports Extra-EC
Mid ECU
1964 1965 1966 1967 1966 1969 1990
— Not Adjusted —Seasonally Adjusted
EUR 12 Imports Intra-EC
Mrd ECU
1964 1965 1966 1967 1966 1969 1990
— Not Adjusted — Seasonally Adjusted
1964 1965 1966 1967 1966 1989 1990
— Not Adjusted — Seasonally Adjusted
EUR 12 Trade Balance Extra-EC
Mrd. ECU
1984 1965 1966.1987 1986 1989 1990
Not Adjusted Seasonally
Adjusted
Not Adjusted Seasonally
Adjusted
Not Adjusted Seasonally
Adjusted
Not Adjusted Seasonally
Adjusted
Jan-88
Feb-88
Mar-88
Apr-88
May-88
Jun-88
Jul-88
Aug-88
Sep-88
Oct-88
Nov-88
Dec-88
Jan-89
Feb-89
Mar-89
Apr-89
May-89
Jun-89
Jul-89
Aug-89
Sep-89
Oct-89
Nov-89
Dec-89
Jan-90
Feb-90
Mar-90
Apr-90
May-90
Jun-90
Jul-90
Aug-90
Sep-90
Oct-90
Nov-90
Dec-90
22,7
27,1
31,5
27,8
29,7
31,9
30,8
28,5
31,1
32,6
33,1
35,8
30,3
30,9
34,8
33,7
33,4
37,4
34,0
31,3
34,4
37,6
37,1
37,4
34,1
33,6
37,7
33,3
35,6
35,1
35,5
31,4
31,2
38,8
36,9
35,4
26,1
28,2
28,6
29,3
30,2
30,5
30,1
31,2
31,5
31,6
31,2
33,0
34,1
33,0
34,0
33,6
33,4
35,7
34,2
34,0
36,2
34,7
35,2
34,9
37,7
35,9
35,5
35,0
35,1
34,7
34,3
34,0
33,4
35,2
35,1
34,0
25,9
29,5
34,4
30,2
31,9
33,0
31,9
31,1
34,2
35,4
34,7
34,1
35,4
34,3
38,0
37,6
39,1
40,1
35,3
34,4
37,7
40,6
39,1
34,8
39,6
35,6
40,2
37,1
39,4
37,8
36,8
35,2
36,6
43,9
41,9
36,0
26,6
30,2
31,4
30,9
31,6
32,3
33,3
33,6
33,5
34,5
32,9
35,5
35,3
35,8
36,8
37,2
38,5
38,7
38,1
36,4
38,5
37,2
37,8
36,5
39,4
37,3
38,4
38,0
37,8
37,8
37,2
37,8
37,9
40,2
39,9
39,3
35,2
42,9
49,2
42,4
45,6
47,3
43,2
37,5
46.3
50,1
49,3
48,9
47,7
49,1
54,1
52,0
52,5
57,3
50,4
42,5
50,8
58,1
56,4
51,5
53,9
52,3
60,6
54,4
56,6
54,7
54,8
44,5
53,3
62,3
61,1
52,6
38,3
42,2
42,8
42,9
44,8
45,4
44,6
46,9
46,0
47,5
47,2
49,1
49,9
49,8
50,5
50,3
51,8
54,1
52,6
51,9
53,0
52,7
53,7
53,2
56,5
53,4
54,3
54,4
54,5
54,1
54,6
55,2
55,9
56,8
57,1
54,9
-3,2
-2,4
-2,9
-2,4
-2,2
-1,1
-1,2
-2,6
-3,1
-2,7
-1.7
1,6
-5,1
-3,4
-3,2
-3,9
-5,7
-2,7
-1,3
-3,0
-3,3
-3,0
-2,0
2,5
-5,5
-2,0
-2,5
-3,7
-3,8
-2,7
-1.3
-3,8
-5.3
-5.2
-5,0
-0,6
-0,5
-2,0
-2,7
-1.7
-1,3
-1,8
-3,2
-2,4
-2,0
-2.9
-1,7
-2,5
-1,2
-2,8
-2.8
-3.6
-5,2
-3,0
-3,8
-2,3
-2,3
-2,5
-2,6
-1,7
-1,7
-1.4
-2.9
-3,0
-2,8
-3.1
-2.9
-3,8
-4,5
-5,0
-4,8
-5,3
(1 ) As from October 1990, the territory of the Federal Republic of Germany includes the territory of the former German Democratic Republic, including East Berlin.
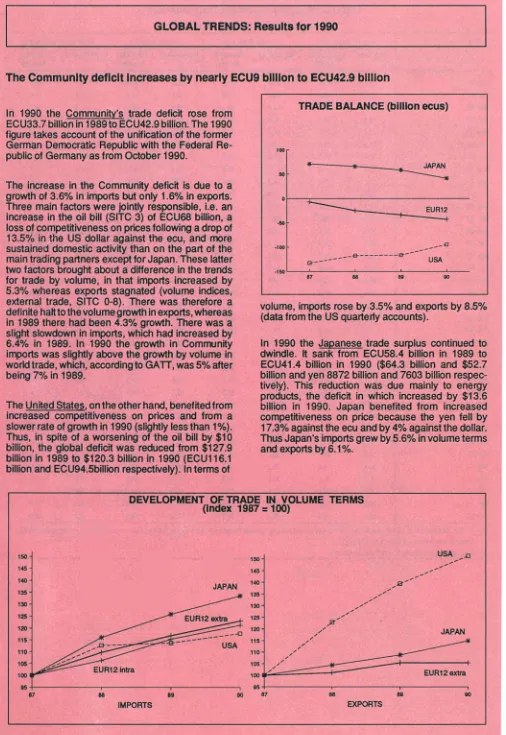
The Community deficit increases by nearly ECU9 billion to ECU42.9 billion
[image:8.595.43.549.34.769.2]In 1990 the Community's trade deficit rose from
ECU33.7 billion in 1989 to ECU42.9 billion. The 1990
figure takes account of the unification of the former
German Democratic Republic with the Federal Re
public of Germany as from October 1990.
The increase in the Community deficit is due to a
growth of 3.6% in imports but only 1.6% in exports.
Three main factors were jointly responsible, i.e. an
increase in the oil bill (SITC 3) of ECU68 billion, a
loss of competitiveness on prices following a drop of
13.5% in the US dollar against the ecu, and more
sustained domestic activity than on the part of the
main trading partners except for Japan. These latter
two factors brought about a difference in the trends
for trade by volume, in that imports increased by
5.3% whereas exports stagnated (volume indices,
external trade, SITC 08). There was therefore a
definite halt to the volume growth in exports, whereas
in 1989 there had been 4.3% growth. There was a
slight slowdown in imports, which had increased by
6.4% in 1989. In 1990 the growth in Community
imports was slightly above the growth by volume in
world trade, which, according to GATT, was 5% after
being 7% in 1989.
The United States, on the other hand, benefited from
increased competitiveness on prices and from a
slower rate of growth in 1990 (slightly less than 1%).
Thus, in spite of a worsening of the oil bill by $10
billion, the global deficit was reduced from $127.9
billion in 1989 to $120.3 billion in 1990 (ECU116.1
billion and ECU94.5billion respectively). In terms of
100
60
so
100
TRADE BALANCE (billion ecus)
*
*
^ ^
JAPAN
~~ "——s
_ ^ _ ^ E U R 1 2
~~*
„■ει
_ g .
β—""
&
_
USA
87
88
89
SO
volume, imports rose by 3.5% and exports by 8.5%
(data from the US quarterly accounts).
In 1990 the Japanese trade surplus continued to
dwindle. It sank from ECU58.4 billion in 1989 to
ECU41.4 billion in 1990 ($64.3 billion and $52.7
billion and yen 8872 billion and 7603 billion respec
tively). This reduction was due mainly to energy
products, the deficit in which increased by $13.6
billion in 1990. Japan benefited from increased
competitiveness on price because the yen fell by
17.3% against the ecu and by 4% against the dollar.
Thus Japan's imports grew by 5.6% in volume terms
and exports by 6.1%.
DEVELOPMENT OF TRADE IN VOLUME TERMS
(index 1987 = 100)
150
145
140
135
125
120
115
110
105
1O0I
9 5
^ ^ ^ ^ " E U R ^
intra
JAPAN
" * E U R 1 2 extra_.
^ j ^ ^ ^ ^ ^ ^ T — α
"^^
USA
87
88
89
90
87
trade expressed in ecus slowed down. A large part
of this slowdown was due to the automatic effects of
the depreciation of the dollar. The slowdown in trade
by volume had a more limited effect.
Imports and exports slowed down equally up to
mid1990, since when there has been a scissors
movement. The growth in imports resumed, whereas
there was a clear downturn in exports. It is from this
point that the Community balance of trade deteriora
ted badly.
In the United States there were similar slowdowns.
However, exports were more sustained than imports,
which explains the distinct improvement in the US
deficit. However, since May 1990 the rate of growth
has been almost identical for exports and imports.
There was a slight upturn at the end of the year.
In Japan, the slowdown was much more marked in
exports.
36
»
11
1Í
t
4
A
knports in ecus
^
DEVELOPMENT OF TRADE IN VALUE TERMS
(yearonyear changes of 3month moving averages,
%)
Η
M
t*
Μ
10
Εφο* in ecus
2 1 4 1 1 7 1 1 1111 12 1 : 9
η
1
EURI!
Exports in ecus
" '
/Λ
ι
^ ^ g ^ V e
Exports In $
Imports in $
^h\ w > $ V
_ J ^
' '
Imports In ecus
\ _ _ Z \ _ , * *
' " '
„Imports In yen
^ ^ /
v\
Exports χ ~ β β β> β ^ ν "
^ ^ β τ β "
\
\
Imports In / ¿Λ
Exports in ecus N s ,
Λ. ecus
1 /
4 I I 7 1 Ι 11 11 12
1 Ι · 4 Ι Ι 7 · Ι · Κ · 1 Ι 8 4 Ι Ι 7 Ι · Β 1 1 ·
1 l l 4 t i r i l B t l 1 f l l t 4 E I 7 l l « 1 i a
Η
Ι
Ι
Η
Ι
Μ
Ι
Ι
Η
1
M
l
USA
JAPAN
COUNTRY
EUR12
USA
JAPAN
EUR12
USA
JAPAN
EUR12
USA
JAPAN
1 USD... ECU
1987
I
7.2
132.5
69.0
1.6
6.5
0.8
0.7
0.8
0.7
14.8
1988
25.0
117.3
65.8
14.0
5.8
22.9
6.9
24.0
13.2
2.4
I
1989
I
1990
I
I
1987
I
TRADE BALANCE (Billion ecu)
33.7
42.9
116.1
94.5
58.4
41.4
IMPORT (% annual increase)
value
15.2
3.6
6.9
14.6
9.3
2.6
20.6
4.0
9.0
EXPORT (% annual increase)
value
13.8
1.6
1.8
21.3
6.1
13.1
11.3
10.6
0.4
1988
9.7
12.6
16
1.1
22.9
4.4
EXCHANGE RATES (% annual increase)
7.4
13.5
I
1989
I
volume
6.5
1.0
8.4
volume
4.2
13.5
4.2
1990
5.3
3.5
6.1
0.0
8.5
5.6
. n 1990 the Community deficit on energy products
(SITC 3) reached ECU59.3 billion, i.e. a deterioration
of ECU6.8 billion. This was the result of a sharp rise
in petroleum prices in August 1990 (on an annual
basis, the average increase is 30%). However, the
deterioration was limited by the dollar's fall against
the ecu and a moderate increase in imports by
volume (+1.8%). In 1989 there was a more serious
deterioration (ECU13.2 billion), since the rise of the
dollar had boosted the increase in oil prices and
imports by volume had increased by 7%.
3 0
3 5
--40
-45
-50
-55
-60
■65
ENERGY BALANCE AND OIL PRICE
CIF price per barrel of oil Imports In $
IMPORTS OF ENERGY PRODUCTS (SITC 3)
(index 1987
·
100)
Γ 40 140 r
30 120
20 10C
10 βΟ
ι ι ι ι ι ι ι ι ι ι ι ι ι ι ι ι ι ι ι ι ι ι ι ι ι ι ι ι ι ι ι ι ι ι ι ι ι ι ι ι ι ι ι ι ι ι
47 Μ Μ 901 Μ 12 8 7
0
βο
value
88
80
Trade In manufactured goods
Since 1987 the Community surplus on manufactured
goods (SITC 5-8) has been decreasing under the
influence of a sharp rise in imports by volume and
near-stagnation in exports by volume. In 1990 the
balance on manufactured goods was ECU54 billion,
after being ECU56.7 billion in 1989. However, the
situation was somewhat uneven, depending on the
type of product. The balance for transport equipment,
well into the black at ECU37.6 billion, improved by
ECU1.6 billion, while the surplus on chemicals was
ECU18.2 billion, a fall of ECU5 billion. On the other
hand, the balance for other manufactures (SITC 6 +
8) is deteriorating rapidly and is now in deficit to the
tune of ECU1.8 billion, after showing a surplus of
ECU3 billion in 1989.
BALANCES BY PRODUCT
(in billion ecu)
Total
SITC 7
SITC 5
SITC 8+6
DEVELOPMENT OF TRADE IN MANUFACTURED PRODUCTS
(SITC 5 to 8,1987 =
100)
166
165
EXTRA-EC
-Food, etc (SITC0+1)
- Crude materials (SITC 2+4) (2)
- Fuel products (SITC 3)
-Chemicals (SITC 5)
- Transport equipment (SITC 7)
- Other manufact goods (SITC 6+8)
- Articles not classified (SITC 9)
EXTRA-EC
-Food, etc (SITC0+1)
- Crude materials (SITC 2+4) (2)
- Fuel products (SITC 3)
-Chemicals (SITC 5)
- Transport equipment (SITC 7)
- Other manufact goods (SITC 6+8)
- Articles not classified (SITC 9)
EXTRA-EC
-Food, etc (SITC 0+1)
- Crude materials (SITC 2+4) (2)
- Fuel products (SITC 3)
-Chemicals (SITC 5)
- Transport equipment (SITC 7)
- Other manufact goods (SITC 6+8)
- Articles not classified (SITC 9)
TURE
%
-100,0
8,1
9,4
13,6
6,6
28,0
28,9
5,4
100,0
7,6
2,3
2,4
11,6
38,7
31,9
5,5
(1 ) External Trade Statistics (Imports CIF, Exports FOB).
(2) Petroleum not included.
* Estimate.
-0,7
-8,6
-24,6
-46,6
16,4
46,3
14,7
1,8
1,6
-6,0
-0,9
-5,4
2,2
8.5
6,7
-82
-0,8
-2,5
6,4
-10,0
1,5
-1,3
-0,8
2,6
SITC Rev.3
III
IV
12
TRADE BALANCE (Mrd ECU)
-25,0 -33,7 -42,9 -10,8 -11,4
3,0
-8,6 -4,7 -5,1 > -1,4 - 1 2 -0,5
-28,5 -32,7 -29,1
-6,4 -6,2 -2,4
-39,3 -52,5 -59,3 -13,9 -19,9
-5,1
19,4 18,7 182 4,6 4,4 1,7
34,5 35,0 37,6
7,9 11,4 5,8
5,9 3,0 -1,8 -1,1 0,5
2,7
-8,4 -0,4 -3,4 -0,4 -0,4 0,9
IMPORTS
% change on the corresponding period of the previous year
14,0 152 3,6 1,2 7,2
-0,7
5,0
3,7
-0,1 -1,9
1,5 -13,6
15,0 13,4 -10,2
-1,9
7,5
-7,2
-15,7 302 13,6 8,0 35,6 25,6
15,5 17,0
3,5 0,4 9,6 -3,4
24,5 172
5,6 4,9 5,3
1,0
19,3 18,6 3,1
2,3 4,6
2,0
38,0 -162
-0,9 -3,6 -4,9
-38,3
EXPORTS
% change on the corresponding period of the previous year
6,9 13,8 1,6 -1,9 -0,2 4,2
7,0 20,0 -1,1 -3,5 -5,6 -12,1
13,7 92
-7,6
-11,3 -3,3 -21,1
-14,1 14,5 17,3 7,7 20,6 2,1
16,9 7,9 1,1 -2,5 2,6 -2,5
7,1 13,3 6,1 2,5 4,4 3,4
7,6 15,1 -0,6 -4,1
-4,0 8,5
-8,1 16,8 -13,8 -16,1 -16,3 38,6
s in application from 1988.
12
-1,1
-0,4
-1,8
-6,7
1,7
4,5
12
0,4
7,1
12
-18,9
29,4
12
9,7
7,6
-27,5
-4,6
3,3
10,3
27,4
-0,1
-2,1
-7,9
-35,1
In 1990 the Community's geographical balances de
teriorated against most areas except Japan. Against
the industrialized countries the Community had a
deficit of ECU 25.5 billion, following ECU 22.2 billion
in 1989. The deficit against the US deteriorated by
ECU 3 billion and that against the EFTA countries by
ECU 2.6 billion. Conversely, the deficit against Japan
improved by ECU 1.7 billion.
The deficit against the developing countries was
ECU 9.5 billion, a drop of ECU3.6 billion compared
with 1989. The sharpest drop (ECU3.7 billion) was
against the OPEC countries. Against the countries
of eastern Europe the deficit remained stable at ECU
3.1 billion, due in large part to the incorporation of
the trade of the former German Democaratic Repu
blic.
BALANCES BY GEOGRAPHICAL ZONES (billion
ecus)
4 0
3 0
2 0
1 0
O
- I O
- 2 0
- 3 0
4 0
3 0
2 0
I O
O
- I O - 2 0 -SO
4 0
3 0
2 0
ΙΟ
Ο
Ί Ο
- 2 0
U S A
J A P A N
M e d . B a s .
—a—
EXTRA-EC
INDUSTRIALIZED THIRD
COUNTRIES
-United States
-Japan
-EFTA
DEVELOPING COUNTRIES
-AsianNICs(2)
-OPEC
-Mediterranean Basin
-ACP
COUNTRIES WITH STATE
TRADE
EXTRA-EC
INDUSTRIALIZED THIRD
COUNTRIES
- United States
-Japan
-EFTA
DEVELOPING COUNTRIES
-AslanNICs(2)
-OPEC
- Mediterranean Basin
-ACP
COUNTRIES WITH STATE
TRADE
INTRA-EC
EXTRA-EC
INDUSTRIALIZED THIRD
COUNTRIES
-United States
-Japan
-EFTA
DEVELOPING COUNTRIES
-AsianNICs(2)
-OPEC
-Mediterranean Basin
-ACP
COUNTRIES WITH STATE
TRADE
%
-100,0
61,0
18,8
10,4
22,9
30,4
6,0
9,0
8,3
4,4
8,6
-100,0
602
18,9
5,1
26,1
31,8
5,6
8.5
9,9
4,0
8,0
-0,7
7,8
15,7
-21,1
7,6
-3,8
-5,4
-5,4
4,9
-2,4
-4,7
1,6
2,0
-0,8
4,6
5,1
0,8
25,3
-9,1
3,5
-16,5
2,1
6,0
-0,8
12
-4,3
19,5
3,6
-2,7
19,1
-16,1
-6,0
-13,5
-7,9
(1 ) External Trade Statistics (Imports CIF, Exports FOB).
TRADE BALANCE (Mrd ECU)
-25,0 -33,7 -42,9 -10,8 -11,4
-16,9 -222 -25,5
-3,6 -7,4
3,5
-5,6 -8,6 -0,5 -1,3
-24,6 -252 -23,5
-5,7 -6,3
5,8 5,4 2,8
1,1
-1,1
-3,0 -5,9 -9,5 -3,6 -3,7
-4,9 -3,7 -3,1 -1,1 -1,1
-0,7 -5,8 -9,5 -2,4 -4,7
5 2
3,5
3,3 0,9 0 2
-2,1 -3,1 -3,5 -0,9 -2,0
-5,1 -5,6 -7,9 -3,6 -0,3
IMPORTS
3,0
0,7
0,4
-1,7
1,1
2,0
-0,1
-0,3
0,9
-0,0
0,3
% change on the
corresponding
period of the previous year
14,0 152 3,6 12 7 2
18,5 13,4
2,0 -0,6
3,4
21,6 22,4 1,8
0,3
- 2 2
19,6 11,3 - 0 2
-3,4
3,3
9,4
132 5,9
3,9
9,7
7,4 17,6 5,0 2,1 11,1
20,3
8,3 -1,3 -5,9 6,6
-8,5
282 10,1
9,5
18,7
3,0
23,1 13,8
6,4
25,4
5,8
11,5 2,7
-1,6
20,0
7,3 19,5
9,5 9,4
19,3
10,8 15,5
6,3 6,0
6,1
EXPORTS
-0,7
-2.4
2,6
-5,6
- 0 2
0,5
-2,0
19,9
14,4
-4,7
6,8
3,8
% change on the corresponding period of the previous year
6,9 13,8 1,6 -1,9 -0,2
6,1 12,0 0,9 -1,0 -3,5
-0,1 8,7 -1,9 -3,6 -6,4
25,0 24,1 7,5 1,5 3,0
6,8 12,0 3 2 12 -1,8
8,5 15,5 2,5 -1,4 -0,7
30,8 16,4 1,5 -5,0 2,3
5,4
12,3 12
-1,8
-8,6
3,7 14,9 12.1 8,1 7,3
10,0 6,8 0,1 -1,9 -7,1
72 21,4 42 -11,0 24,9
(2) Asian NICs include the following countries: Singapore, South Korea, Taiwan and Hong Kong.
4 2
0,7
-6.0
^ . 3
4,4
8,6
-2,8
11.6
16,3
-2,0
11,5
-1,1
-1,7
-0,3
-1,7
-0,5
-0,0
0.0
- 1 2
0,5
-0,5
0,7
7,1
32
-1,5
0 2
10,9
11,5
-1.7
12,6
16,3
21,3
17,9
2,5
^ , 6
-8,4
-11,6
-0,5
- 0 2
-6,4
4,3
-13,1
3,7
-8,1
The Community's balances against the nonEUR12
countries either remianed stable or, in the great
majority of cases, deteriorated slightly. Against non
Community countries the Netherlands' balance de
teriorated by ECU3 billion, Germany's by 2, and
France's and Spain's by 1. This reflects to a great
extent the increase in the oil bill. Germany's balance
would have deteriorated by ECU5.5 billion without
the trade of the former GDR.
On the other hand, there was a profound change in
intraCommunity trade. The German surplus was
reduced by ECU14.6 billion and was only ECU24
Trade by the former GDR
[image:14.595.52.556.31.780.2]The unification of the former GDR with the Federal
Republic of Germany in October 1990 increased the
Community's balance by ECU3.4 billion, of which
ECU3.3 billion was with nonCommunity countries,
in particular the countries of eastern Europe. This
figure is probably not an accurate reflection of the
real situation, since the unification of Germany has
billion. The chief country to benefit from this was the
United Kingdom, which reduced its intraCommunity
deficit by ECU8.5 billion. Italy's deficit was reduced
by ECU2.5 billion and that of France by ECU0.5
billion. On the other hand, the BLEU's surplus de
creased, coming back into balance after rising to
ECU2.7 billion in 1990.
Imports by volume grew slightly less rapidly within
the Community than outside it (5.1 % compared with
5.3%). In 1989 intraCommunity trade had been
much more dynamic (8.5% intraCommunity against
6.4% extraCommunity).
given rise to a number of statistical problems. In
particular, it appears that some of the imports of the
former GDR were made via the Federal Republic of
Germany and therefore swelled the imports of the
latter. It should be noted that in 1989 the GDR did
not have a surplus.
MEMBER STATES' EXTRA AND INTRA TRADE BALANCE
(billion ecu)
I
T^r.
EC B.L DK D
EXTRA 87 f j 88
F IRL I
M
»O
■
40
30
20
10
O
1 0
2 0
--30
-40
-50
■
1987
1990
1990
III
1Í
IV
12
12
EUR12
extra
intra (2)
BLEU
extra
intra
DENMARK
extra
intra
GERMANY
extra
intra
GREECE
extra
intra
SPAIN
extra
intra
FRANCE
extra
intra
IRELAND
extra
intra
ITALY
-0,7
-0,6
-2,0
0,9
1,2
1,0
30,5
26,0
-2,6
-3,0
5,7
3,5
2,4
-14,7
0,2
1,7
TRADE BALANCE (Mrd ECU)
25,0
0,8
4,2
0,9
1,3
-0,4
26,0
34,7
2,3
3,6
-6,9
-5,3
1,1
13.1
0.3
2.4
33,7
12
5,4
2,7
1,0
0,2
25,0
38,6
3,2
4,7
10,8
8.9
0,9
15,4
0,1
3,0
-42,9
-6,9
0.3
0,1
1,6
0,8
23,0
24,0
-3,3
-5,9
11,5
9,2
2.0
14,9
-0,1
2,4
10,8
3,1
-1,4
-02
0 2
0,4
4,2
4,8
0,7
1.6
2,4
2,1
0,6
3,8
-0,1
0,5
11,4
1,1
1,5
0,1
0,4
0,2
5,5
1,6
-0,6
-1,1
2,8
1,9
1,1
3,4
0,0
0,5
3,0
0,7
0,2
0,5
0,1
0,1
2,8
2,0
-1,1
-0,5
0.0
0,6
1,0
1,9
0,1
0,3
-1,1
-02
0,4
0,3
0,3
0,1
1,8
0 2
0 2
0,4
0,7
0,4
-02
-1,5
0,0
0,3
extra
intra
NETHERLANDS
extra
intra
PORTUGAL
extra
intra
UNITED
KINGDOM
extra
intra
3,0
5,8
12,0
12,3
2,0
1,7
8,0
13,0
3,3
5,3
11.9
12,4
2,4
3,5
22,6
20,2
4,4
6,8
15,7
18,5
2,3
3,4
18,8
22,5
5,0
4,3
18,5
18,0
2.8
^ , 1
18,0
14,0
0,3
0,5
4,8
3.7
0,7
0,9
42
4,3
1.6
0,5
5,1
5,2
0,8
1,2
0,8
0,5
0,5
0,2
0,8
1,5
0,1
0,3
0,2
0,5
0.8
0,5
1,3
1.5
02
0.4
1,1
0,5
(1 ) External Trade Statistics (Imports CIF, Exports FOB).
(2) Intra trade balance not zero due to CIF/FOB recording and asymétrie recording of bilateral flows by individual Member States.
' Estimate.
830
795
760
725
690
655
620
585
550
ι Ι Η Ι ι ι Ι ι ι Ι ι ι I t ι Ι ι ι I t ι Ι ι rl n Ι ι ι Ι ι ι 1 ι ι Ι ι Μ ι ι Ι ι ι19Θ7
1988
1989
1990
Impor 11
Expor t i
I n t r a - E C t rade
240
220
200
180
160
140
120
ι il ι ι I ι ι I ι ι I ι il I I I ι ■ I ι ■ I ■ il ι ι I I I I ■ ■ I ■ il I I Ii ι h ι1987
198B
1989
1990
170
160
150
140
130
120
110
100
90
80
E x t r a - E C
t r a d e
USA
ι 11 ι ι I n I n 11 11 η I ι ι I ι ι I ι 11 11 1 Μ 11 ι I ι 11 ι ι 111 11 ι
1987
1988
1989
1990
1987
1988
1989
1990
I n t r a - E F T A t rade
1987
1988
1989
1990
50
46
42
38
34
30
E x t r a - E F T A
t r a d e
USSR
l u l I i i l i i l i i l i i l n l . i l I I l i
1987
1988
1989
1990
1987
1988
1989
1990
Canada
Japan
1987
1988
1989
1990
Chi na
I . . I . . I . i l i ■!■ ■ 111 I ■ ■ I ■ .1 ■■ I ■ ■ I . ■! Ι . ' ■ ' ■ ■ ' ■ ' ' ■ ■ Ι ' ■ ' " ' ■ ■ ' ■ ■ Ι ' ■' ' ■ ' ■ ■ ' ■ ■ Ι ■ ■ ' ■ ■ ' ■ ■ ' ■ ■
Billion ECU
70
60
50
40
30
20
10
0
I ( i
1975 1976 1977 1978 1979 1980 1981 1982 1983 1984 1985 1986 1987 1988 1989
Principal countries
Totals and major products
sa
Morocco
Vegetables and fruit
Fertilizers
Clothing and accessories
Algeria
Petroleum oils, crude
Petroleum products, refined
Gas, natural and manufactured
Tunisia
Petroleum oils, crude
Clothing and accessories
Libya
Petroleum oils, crude
Egypt
Petroleum oils, crude
Liberia
Iron ore
Diamonds
Côte d'Ivoire
Coffee
Cocoa
Wood
Ghana
Cocoa
Aluminium
Nigeria
Cocoa
Petroleum oils, crude
Cameroon
Coffee
Cocoa
Wood
Petroleum oils, crude
Kenya
Coffee
Tea and maté
Gabon
Wood
Petroleum oils, crude
Congo
Petroleum oils, crude
Zaire
Coffee
Diamonds
Copper
Zambia
Copper
Republic of South Africa
Vegetables and fruit
Wool and other animal hair
Metalliferous ores and metal scrap
Coal, coke and briquettes
Diamonds
Million ECU
1988
2 271
280
360
622
4 864
1 826
773
1 220
1 527
178
579
5 223
4 197
1 646
854
679
281
228
1 615
357
417
213
497
171
176
2 876
233
2 323
1 105
139
194
149
367
532
143
154
1 092
103
324
403
209
1 284
140
267
691
314
266
12 528
381
261
412
612
691
1989
2 674
454
444
806
5 848
2 395
855
1 197
1 980
330
718
6 304
4 988
2 441
1 487
1 055
225
537
1 622
297
429
221
642
173
300
3 472
126
3 032
1 096
129
147
130
328
588
183
177
1 002
121
464
569
323
1 348
Totals and major products
Colombia
Bananas
Coffee
Coal, coke and briquettes
Venezuela
Iron ore
Petroleum and petroleum products
Guyana
Sugar and honey
Bauxite
Suriname
Rice
Aluminium oxydes
Aluminium
French Guiana
Ecuador
Bananas
Coffee
Cocoa
Crustaceans, frozen
Peru
Fish meal fodder
Lead ores
Zinc ores
Copper
Brazil
Meat
Orange juice
Coffee
Oil-cake of soya beans
Tobacco
Soya beans
Iron ore
Road vehicles
Aluminium
Footwear
Bolivia
Ores of base metals
Non-monetary gold
Paraguay
Coffee
Soya beans
Cotton
Uruguay
Meat
Wool and other animal hair
Leather and dressed furskins
Non-monetary gold
Leather and fur clothing
Chile
Vegetables and fruit
Fish meal fodder
Copper
Argentina
Meat
Cereal and cereal preparations
Vegetables and fruit
Feedingstuffs for animals
Soya beans
Falkland Islands
Million ECU
1988
1 322
147
757
130
1 155
102
779
119
52
20
150
35
79
2
28
328
148
23
19
5
684
47
65
103
257
9 329
337
480
833
1 402
249
522
1 056
383
234
223
107
59
8
366
42
231
44
884
45
76
36
564
30
2 187
324
447
1 186
2 624
363
78
180
609
396
22
1989
1 525
129
787
339
1 559
138
977
126
69
17
189
27
93
39
72
326
113
31
17
51
1040
124
59
135
412
10 446
346
450
833
1 460
268
858
999
526
264
253
142
79
16
427
29
276
47
659
74
77
47
302
23
2 752
262
203
1519
2 787
478
81
228
620
128
10
Values in Mio ECU
1000 1010 1011 1020 1021 1022 1023 1028 1030 1031 1032 1033 1038 1040 1041 1048 1090 1051 1053 1057 1058 024 028 030 032 036 038 043 046 048 052 056 060 062 064 066 068 204 208 212 216 220 228 248 260 268 272 276 288 302 314 318 322 330 334 346 352 372 373 382 388 389 400 404 412 436 442 448 458 462 480 484 496 500 504 508 512 528 600 604 608 616 624 632 640 647 649 652 662 664 666 669 680 700 701 706 708 720 728 732 736 740 800 Partner countriesW O R L D
Intra-EC (EUR 12) Extra-EC
Class 1 E F T A
Other W e s t . Europe U S A a n d C a n a d a Other class 1
Class 2
A C P {68 countries) DOM
TOM Other class 2
Class 3 (1) Eastern Europe (1) Other class 3 Miscellaneous Mediterranean Basin OPEC
ASEAN Latin America
Main countries :
Iceland N o r w a y S w e d e n Finland Switzerland Austria Andorra Malta Yugoslavia Turkey Soviet Union Poland Czechoslovakia H u n g a r y R o m a n i a Bulgaria M o r o c c o Algeria Tunisia Libya Egypt Mauritania Senegal Guinea Liberia Ivory Coast G h a n a Nigeria C a m e r o o n G a b o n C o n g o Zaire Angola Ethiopia K e n y a Tanzania Reunion Mauritius Z i m b a b w e South Africa (2) Namibia
United Slates of America C a n a d a
Mexico Costa Rica P a n a m a C u b a Guadeloupe Martinique Colombia Venezuela French Guiana Ecuador Peru Brazil Chile Argentina C y p r u s L e b a n o n Syria Iran Israel Saudi Arabia Bahrein United Arab Emirates Oman North Yemen Pakistan India Bangladesh Sri Lanka Thailand Inóonasta Malaysia Singapore Philippines China South Korea Japan Taiwan Hong Kong Australia
I m p o r t s
1988
930 994 S40 833 387 891 238 898 90 653 10 907 76 765 60 573 116 617 17 541 1 363 740 96 973 32 377 24 891 7 486
1 869 30 196 31 851 12 203 23 047 731 12 507 21 965 8 996 29 572 16 681 29 390 5 892 4 346 12 990 • 3 361 2 211 2 158 2 234 462 2 271 4 864 1 527 5 223 1 646 182 384 254 679 1 615 497 2 876 1 105 1 092 403 1 284 713 153 532 183 128 667 603 12 528 68 349 8 415 2 466 355 400 374 133 166 1 322 1 155 28 328 684 9 329 2 187 2 624 400 112 421 3 106 2 885 5 470 109 649 316 197 1 230 3 266 371 349 2 966 2 134 2 687 2 993 1 209 7 005 7 240 41 618 8 067 6 317 4 881 1989 1073 552 624 488
446 716 270 893 102 589 13 436 93 472 61 396 137 113 19 597 1 413 878 115 225 3B707 28 992 9 715 2 347 37 174 40 843 15 173 26 047 779 15 365 25 406 9 918 32 029 19 092 33 568 6 997 5 536 15 166 3 858 2 558 2 587 2 548 531
2 674 5 848 1 980 6 304 2 441 252 413 333 1 055 1 622 642 3 472 1 096 1 002 569 1 348 538 201 588 207 110 718 752 8 185 63 660 9 812 2 760 397 401 433 122 169 1 525 1 559 72 326 1 040 10 446 2 752 2 787 524 101 775 5 352 3 197 6 666 98 1 553 144 479 1 271 4 181 427 419 3 362 2 553 3 507 4 023 1 325 9 149 6 953 46 337 9 259 6 432 5 271 1990 1129 055 663 797 462 720 276 380 108 597 14 646 94 591 58 545 143 948 20 125 1 588 712 121 523 42 391 31 274 11 118 2 538 42 298 44 982 16 748 25 356 936 16 465 25 432 10 438 34 338 20 989 36 649 7 664 5 943 16 749 5 278 2 766 3 004 1 617 593 3 043 6 940 2 250 7 888 2 299 239 411 306 702 1 677 730 4 386 1 379 1 095 602 1 142 1 092 129 520 177 125 756 577 5 929 1 724 65 182 9 409 2 947 433 490 325 97 194 1 465 1 784 75 354 803 9 203 2 617 3 474 581 97 1 239 5 798 3 467 8 224 90 1 509 153 640 1 461 4 553 501 440 4 105 2 863 3 606 4 694 1 257 10 603 6 557 46 224 9 159 5 916
4 822 1988
IV
256 185 149 699 104 909 64 979 25 165 3 133 20 831 15 850 31 039 4 614 324 227 25 874
8 892 6 836 2 054 547 8 031 8 837 3 378 5 940 193 3 292 6 195 2 510 8 314 4 660 7 99 1 593 1 365 3 420 981 637 664 564 149 626 1 200 409 1 354 426 46 92 59 153 383 143 752 296 253 86 341 147 45 148 56 35 189 239 2 863 18 424 2 407 595 90 103 113 24 35 361 272 9 99 155 2 546 592 663 81 32 89 939 703 1 827 40 323 53 45 279 784 111 94 768 584 757 881 329 1 908 1 659 11 375 2 162 1 700 1 244 I 259 737 150 914 108 324 66 236 24 979 3 472 23 285 14 500 33 139 4 713 424 188 27 814
8 948 6 679 2 269 499 8 967 9 731 3 769 5 979 191 3 633 6 301 2 467 7 822 4 565 6 149 1 790 1 454 3 472 903 585 586 600 134 650 1 342 495 1 322 560 65 93 83 279 397 168 847 290 175 126 314 163 52 142 67 33 141 166 1 972
20 947 2 338 674 98 86 115 49 46 388 334 8 72 214 2 330 690 602 152 33 118 1 394 847 1 769 29 455 62 69 350 1 098 105 98 891 652 851 829 361 2 127 1 771 10 877 2 200 1 592 1 319 1989 II 278 704 162 170 115 929 71 576 26 695 3 335 25 309 16 238
34 329 4 912 369 228 28 820 10 020 7 684 2 337 606 9 508 9 812 3 666 7 041 194 3 971 6 753 2 608 8 247 4 922 7 136 1 751 1 366 4 129 1 015 649 618 696 126 678 1 638 470 1 569 625 65 110 97 227 437 138 782 290 255 133 364 86 59 159 59 33 177 180 2 191 22 600 2 708 747 118 118 115 29 49 387 453 22 108 336 2 804 765 678 142 21 221 1 058 824 1 307 24 274 25 121 319 1 132 109 107 845 637 839 1 010 319 2 187 1 710 12 174 2 383 1 462 1 411 III 253 178 144 712 107 785 63 717 23 808 3 133 21 441 15 335 34 464 4 782 280 234 29 168
9 603 6 967 2 636 682 8 919 9 834 3 834 6 895 205 3 851 5 609 2 339 7 260 4 544 10 139 1 645 1 268 3 578 928 608 643 679 121 658 1 336 467 1 671 579 72 103 79 258 386 162 803 247 245 163 343 131 51 142 43 27 209 192 2 037 19 077 2 364 694 80 90 95 23 34 384 390 31 57 263 2 886 632 885 121 21 209 1 423 756 1 581 25 299 32 113 294 981 102 95 822 617 878 1 042 341 2 505 1 829 11 614 2 434 1 798 1 285 IV 281 932 166 693 114 679 69 363 27 107 3 495 23 437 15 324 35 181 5 189 339 229 29 424 10 135 7 662 2 473 561 9 780 11 466 3 905 6 132 189 3 910 6 742 2 504 8 701 5 061 8 145 1 810 1 448 3 987 1 011 717 740 574 150 689 1 531 548 1 742 678 51 107 74 291 401 173 1 040 269 327 147 328 158 38 145 39 17 190 194 1 986 21 036 2 401 645 100 107 108 22 40 366 382 11 89 226 2 426 664 622 109 26 227 1 478 769 2 009 19 526 25 176 307 .971 111 118 804 648 939 1 141 304 2 330 1 644 11 671 2 242 1 580 1 257 I 283 034 166 338 116 119 70 341 27 301 3 753 24 662 14 625
36 129 4 837 417 156 30 719
9 649 6 983 2 666 578 10 796 11 321 4 275 5 770 219 3 887 6 610 2 574 8 796 5 215 9 132 1 997 1 536 3 600 1 093 653 667 455 138 843 1 714 605 1 792 692 63 120 71 269 423 156 915 323 223 169 363 129 33 142 47 27 169 135 1 556 414 22 276 2 387 661 100 115 73 22 56 355 372 11 92 203 2 249 610 607 161 22 254 1 398 991 1 851 23 447 47 155 423 1 324 131 110 1 091 803 970 1 035 353 2 550 1 582 11 270 2 280 1 502 1 366 1990 II 282 413 167 167 114 668 70 990 26 823 3 570 25 665 14 932 33 537 4 352 437 186 28 563 10 141 7 601 2 540 559 9 747 9 282 4 000 6 484 271 3 400 6 505 2 811 8 630 5 206 9 171 1 983 1 327 3 890 1 306 689 707 389 153 736 1 497 529 1 571 506 68 100 79 221 460 186 513 322 306 137 268 157 32 124 39 36 165 123 1 526 464 23 203 2 462 668 126 114 76 32 60 351 346 14 97 190 2 373 822 899 147 23 290 1 151 899 1 491 23 348 25 86 368 1 149 123 100 997 696 857 1 080 303 2 432 1 512 11 677 2 316 1 292 1 312 III 263 154 153 429 109 053 63 357 24 742 3 405 21 296 13 914 35 188 4 707 345 203 29 933 10 509 7 597 2 912 676 9 487 10 764 4 240 6 407 228 3 641 5 654 2 365 7 902 4 952 8 156 1 801 1 351 4 082 1 253 610 737 391 148 696 1 390 473 1 830 533 57 101 77 142 373 198 938 288 306 145 267 237 24 119 38 19 220 153 1 311 459 19 135 2 161 598 105 161 86 26 40 342 390 33 69 211 2 375 596 1 070 92 23 337 1 970 756 1 900 21 270 25 180 328 1 065 118 113 1 078 668 889 1 214 306 2 760 1 649 11 222 2 229 1 593 1 004 IV 300 452 176 847 122 880 71 692 29 731 3 920 22 968 15 073
E x p o r t s
II
Partner countries
906 730 1043 289 1081 428
540 012 625 722 656 872
362 909 413 010 419 813
268 878
162 962
278 776
165 861
222 029
96 434
12 886
81 933
30 776
113 634 15 551
7 254
1 404
89 425
27 247
20 740
6 506
3 808
35 423
31 198
10 689
13 227
625
8 515
21 132
7 767
35 881 22 514 643 843
5 714
5
22510
1142
7562
1692
355 6151 406
2 609
3 704
2 003
2 706
3 676 210 537 231 453 988 412
2 166 677
1 017
317 725 626 565 811 377
1 039 313 283
6 360
71 809
10 124
2 296 128 390 511 837 839 778
2 406 379 333 403
3 122 851
1 311
1 053 851 659
2 873
4 712
7 572 437
2 288 826 411
1 606
5 638 403 375
2 072
1 934
1 385
4 067 912
5 802
4 392
17 020
4 460
6 772 248 718 107 968
14 947
88 675
37 128
131 197 16 627
8 307
1 683 104 580
33 086
25 870
7 216
4 557
40 699
35 031
14
11015 109
592
8 607
24 058
9 372
40 071 25 268 773
1 064
7 031
5 609
12 603
3 945
2 385
2 988 689
1 477
3 226
4 715
2 531
2
9113 764 241 641 261 480
1 142 453
2 216 758 722 345 787 819 454 891 421
1 150 395 353
6 450
78 020
10 655
3 511 166 563 587 962 896 865
1 667 672 391 371
3 841
1 207
1 181
1 438 829 780
3 286
5 101
8 805 670
3 110 742
414 1 460
7 083 445 391
2 765
2 039
2 049
5 486 1 197
6 369
5 207
21 130
5 206
7 023 250 920 111 370
18 773
85 859
34 917
134 425 16 649
8 532
1 679 107 564
34 467 28 176
6 291
4 742
45 633
35 439
16 083
15 067
638
9 306
23 941
9 165
41 340
26 981 874
1 210
8 521
7 722
13 614
4 934
2 909
3 220
1 415
1 034
3 562
4 976
2 971
2 660
4 153 221 684 251
1 008 832 501
2 501 736 545 350 732 843 414 797 401
1 176 391 336
4 090
1 668
76 561
9 298
3 881 166 564 665
1 061 988 812
1 692 910 328 334
3 653
1 170
1 238
1 280 756 845
5 021
5 240
7 756
456 3 567 694 363
1 428
6 019 402
347 3 429
2 841 2 497
5 689
1 247 5 318
6 061 22 721
4 917
6 602
101 593
61 629 26 652
3 462 22 765
8 750
31 878 4 294
2 131 391 25 063
6 277
1 809
1 084
9 775
8 701
3 062
3 701
143
2 290
6 160
2 194
9 570
6 295 175 255
1 662
1 233
2 904 936 726 712 187 381 749
1 079 589 670
1 068
63 161 60 75 268 111 606 192 250 80 200 209 137 238 112 285 91 20 119 2 113 145 251 235 190 709 124 91 96 859 252 331 288 276 194 786
1 240
2 015 132 702 207 99 426
1 491 143 111 575 560 383
1 215 229
1 611
1 288
4 832
1 225
1 951
96 363 104 766 100 162 111 719
58 000 25 774
2 989 20 646
8 592
30 775
4 048
2 014 390
24 323
7 587 5 572
2 016
955
9 078
8 160
3 095
3 466
147
2 013
5 869
2 257
9 523
5 964 162 228
1 436
1 057
2 785 842 480 629 123 333 736
1 024 565 606 917 55 177 62 175 313 106 491 181 151 103 174 166 99 182 104 258 83 74 1 611
18 104
2 542 715 41 133 147 211 214 190 510 178 80 74 847 231 324 375 234 151 775
1 257
2 145 122 732 160 106 382
1 632 114
88
564 406 401
1 221 272
1 807
1 217
4 798
1 120
1 702
63 705
27 537
4 005 22 675
9 489
32 717
4 088
2 078 405
26 146
8 337 6 627
1 710
1 151
10 352
8 548
3 410
3 649
142
2 173
6 089
2 403
10 331
6 399 195 277
1 908
1 478
3 110
1 038 566 772 184 370 852
1 057 672 736 905 54 165 68 111 311 125 556 184 158 76 225 190 109 198 117 297 102 90 1 658
19 930
2 745 848 37 139 163 235 231 228 387 126 108 82 890 288 324 408 127 186 796
1 316
2 046 183 848 190 '
94
397
1 860 102 123 753 524 469
1 332 278
1 483
1 333
5 306
1 335
1 951
60 387 25 510
3 588
21 922
9 368
32 019 3 903
1 986 415 25 716
7 756 6 037
1 719
1 255
9 612
8 560
3 749
3 795
157
2 016
5 422
2 212
9 474
6 230 204 256
1 652
1 377
2 905 948 588 739 172 339 737
1 088 577 782 925 66 133 51 103 247 97 485 187 213 86 188 197 92 216 92 279 101 81 1 659
19 363
2 559 890 41 162 138 205 189 217 356 226 111 91 1 056 307 237 311 169 200 776
1 177
2 215 129 716 230
75
315
, 1 731 108
82
648 547 537
1 510
314 1 519
1 308
5 418
1 366
1 683
66 625 29 148
4 366
23 432
9 679
35 687
4 588
2 230 473
28 396
9 405 7 634
1 772
1 196
11 657
9 764
3 856
4 199
147
2 405
6 678
2 500
10 742
6 675 213 303
2 035
1 697
3 803
1 117 750 848 210 434 902
1 546 716 786
1 016
66 166 80 91 272 125 685 206 201 80 199 266 154 295 108 316 109 108
1 523
20 623
2 809
1 059
47 130 139 311 262 230 414 141 91 124
1 048 381 276 343 298 243 940
1 350
2 400 236 814
161
138 365
1 860 121
98
800 562 642
1 423 333
1 560
1 349
5 ι 1 385
1 687
272 388
165 574
105 717
63 434 28 339
4 198
21 786
9 111
34 131 4 193
2 104 386
27 448
8 150 6 570
1 580
1 098
11 185
9 016
3 878
3 622
137
2 265
6 244
2 414
10 595
6 683 193 255
1 940
1 699
3 480 901 577 656 287 341 857
1 418 708 633
1 028
49 171 66 241 225 120 626 179 126 89 223 225 105 217 101
• 281
94 86 1 010 450
19 292
2 494 884 41 121 117 256 253 202 352 284 78 107 881 294 359 340 192 241 956
1 326
1 915 182 857 153
90
355
1 645 107 96 847 608 572 1 441 362
1 408
1 606
5 990
1 364
1 584
270 756
165 245
104 350
63 403 28 593
4 766
21 555
33 286
4 365
1 958 447
26 516
7 661
6 175
1 162
11 546
9 091
3 802
3 467
149
2 426
6 155
2 412
10 724
6 726 221 318
2 195
1 906
2 923 951 587 763 384 179 936
1 294 757 660
1 055 59 161 66 552 206 128 625 194 112 81 176 199 103 210 97 293 107 79 1 115 417
19 307
2 248 966 42 108 167 250 235 223 412 119 76 91 718 287 233 347 164 193 1 114 1 310
1 878 113
1 021 165
87
371
1 342 104
78
767 614 612
1 381 330
1 254
1 477
5 455
1 199
1 667
249 628 288 I
150 305 175
98 238 111 508
59 764
25 827
4 384 20 997
8 556
31 570 3 827
1 982 397 25 363
6 905 5 414
1 491
1 084
10 394
8 406
3 928
3 712
151
2 143
5 260
2 093
9 702
6 478 227 304
1 866
1 891
2 426
1 003 598 676 247 753 992 631 698
1 057
49 143 54 27 186 124 597 176 164 90 165 179 100 185 83 270 101 73 1 020 399
18 664
2 333 945 42 130 143 238 217 176 432 224 74 77 1 001 263 281 280 193 178
1 297
1 199
1 991
99
763 140
74
339
1 385 106
85
793 707 581
1 429 269
1 293
1 451
5 501
1 079
1 614
64 320 28 612
5 424
21 521
8 762
35 438 4 264
2 489 449
28 237
11 751 10 017
1 734
1 399
12 508
8 925
4 475
4 265
201
2 471
6 281
2 245
10 318
7 095 234 333
2 520
2 226
4 785
2 079
1 146
1 124 498 345
1 015
1 272 876 669
1 012
64 209 214 129 652 187 143 90 168 240 107 185 119 331 90 98 946 403
19 298
2 223
1 087
42 207 238 317 283 211 496 284 99 58 1 053 326 366 313 206 234
1 654
1 405
1 972
62
926 236 112 364
1 647
84 87 1 022 912 731
1 438 266
1 362
1 528
5 775
1 275
1 737
WORLD
Intra-EC (EUR 12)
Extra-EC
Class 1 EFTA
Other West. Europe USA and Canada Other class 1 Class 2
ACP (68 countries) DOM
TOM Other class 2 Class 3 (1)
Eastern Europe (1) Other class 3 Miscellaneous Mediterranean Basin OPEC
ASEAN Latin America
Main countries :
Iceland Norway Sweden Finland Switzerland Austria Andorra Malta Yugoslavia Turkey Soviet Union Poland Czechoslovakia Hungary Romania Bulgaria Morocco Algeria Tunisia Libya Egypt Mauritania Senegal Guinea Liberia Ivory Coast Ghana Nigeria Cameroon Gabon Congo Zaire Angola Ethiopia Kenya Tanzania Reunion Mauritius Zimbabwe South Africa (2) Namibia
United States ol America Canada Mexico Costa Rica Panama Cuba Guadeloupe Martinique Colombia Venezuela French Guiana Ecuador Peru Brazil Chile Argentina Cyprus Lebanon Syria Iran Israel Saudi Arabia Bahrein
Values in Mio ECU
1000 1010 1011 1020 1021 1022 1023 1028 1030 1031 1032 1033 1038 1040 1041 1048 1090 1051 1053 1057 1058 024 028 030 032 036 038 043 046 048 052 056 060 062 064 066 068 204 208 212 216 220 228 248 260 268 272 276 288 302 314 318 322 330 334 346 352 372 373 382 388 389 400 404 412 436 442 448 458 462 480 484 496 500 504 508 512 528 600 604 608 616 624 632 640 647 649 652 662 664 666 669 660 700 701 706 708 720 728 732 736 740 800 Partner countries WORLD Intra-EC (EUR 12) Extra-ECClass 1 EFTA
Other West. Europe USA and Canada Other class 1 Class 2
ACP (68 countries) DOM
TOM Other class 2 Class 3 (1)
Eastern Europe (1) Other class 3
Miscellaneous Mediterranean Basin OPEC
ASEAN Latin America
Main countries :
Iceland Norway Sweden Finland Switzerland Austria Andorra Malta Yugoslavia Turkey Sovi