INFLUENCE OF YIELD AND OTHER CANE CHARACTERISTICS ON
CANE LOSS AND PRODUCT QUALITY
By
S KHAWPRATEEP1, 2, TA JENSEN1, BL SCHROEDER1, S EBERHARD1
1University of Southern Queensland/NCEA, Australia
2 Faculty of Agriculture at Kamphaeng Saen, Kasetsart University, Thailand
Email address: [email protected]
Keywords: Cane Loss, Cane Harvesting, Pour Rate, Field and Crop Conditions
Abstract
Field and crop conditions affect cane loss, cane supply quality and the amount of extraneous matter that is mixed with cane billets supplied to the mill. The size of the crop produced also impacts on machine performance and cane loss during harvest. Crop physical properties and the composition of the sugarcane stalk are driven by a wide range of agronomic practices, including nutrition. The objective of this study was to investigate the impact of changing crop conditions on sugar loss during harvest, with in-field nutrient practises being the primary driver of the changing cutting pour rates when the ground speed is fixed.
The physical properties of the sugarcane (stalk length and diameter, population density and yield) were measured in the experimental plots that had received a range of different nitrogen (N) application rates before being cut by a chopper harvester. The experimental plots utilised were part of a Sugar Research Australia (SRA) funded project 2014/ 045 ‘Boosting NUE (Nitrogen Use Efficiency) in sugarcane through temporal and spatial management’. Cane loss during cutting was then determined at harvest by collecting all material (leaves, tops, stalks,
yields (t/ha). With the harvester operating at a constant ground speed (and set fan speed) the pour rate was driven by the N applied. As pour rate increased, the ability of the extractor fan to efficiently differentiate trash from billets decreased, resulting in greater sugar loss. Sugarcane sizing influenced by the varying N rates led to the sugar loss differences occurring during the cutting by the harvester. This paper reported on the results collected from a field in
Bundaberg in 2014 and a field at Macknade in 2015.
Introduction
Sugarcane is the most important sucrose crop in the world. Sugarcane that is delivered to the mill is harvested by three methods; hand-cut, labour combined with machines and fully automated harvesting (whole stick or chopper system). In Australia, sugarcane is one of the main agricultural crops in Queensland and New South Wales and is fully cut by the chopper harvesters. During cane harvesting, parameters such as the percentage of cane tops and leaves, stalk weight and size, result in changes to the quality and quantity of cane supply during harvesting. Also, harvester settings (ground and fan speed, etc.) and pour rate impact on the amount of cane loss and extraneous matter (EM) delivered to the mill (Anon. 2014). Cane variety and the severity of lodging affect harvester performance and cane quality (Anon. 2013). Attempts have been made to solve and reduce the problem by improving the machinery and reviewing the process (Davis et al. 2009), harvesting best practise (Agnew et al. 2002; Anon. 2014; Jones 2004) and improving the field and crop conditions (Anon. 2014) to assist the sugar feed systems. However, other factors also impact on the cane loss and quality during cutting due to the different pour rates resulting from the various crop densities within a row. The applied fertiliser rates are one of the important methods for driving the crop sizing to increase or decrease the different characteristic of cane. The varying crop sizes during harvest cause the machine capacity, especially pour rate and cane cleaning efficiency, to decrease. The objective of this study was to investigate the impact of changing crop conditions on sugar loss during cutting, with in-field nutrient practises being the primary driver of the changing pour rate.
Material and methods
variables. In Bundaberg, the harvesting trial was carried out on variety KQ228 that was grown on a row spacing 1.83 m and received a range of nitrogen rates (75, 150 and 225 kg/ha). The crop was harvested with an Austoft model 7000/1996 (specifications: 3 knives per chopper drum (knife size 65 mm wide), a vertical primary extractor fitted with 3 standard blades). In the Macknade trial, the cane variety was MQ239 which was grown on a row spacing of 1.83 m
and received a range of nitrogen rates (0, 100 and 200 kg/ha). The experimental fields were cut by a Cameco model 2500/1997 (specifications: 4 blades (width 65 mm each) per chopper drum, 3 standard blades for primary extractor fan). In both trials, the harvesters were not using the toppers but the secondary extractor was operating.
The physical properties of sugarcane (stalk diameter, length, weight, population density and yield) in each plot were measured before cutting. Cane loss due to mechanical harvesting was determined by gathering all materials (tops, stalks, leaves, etc.) discharged from the harvester. In this experiment, ground and extractor speed of the chopper harvester were fixed during cutting (4.5 km/h ground speed / 1150 r/min fan speed for the Austoft and 3.3 km/h / 1210 r/min for the Cameco), so that yield variation due to N rate would be reflected in pour rate. To collect all cane fractions, an invisible loss technique, based on the standard ‘tarp test’ was used. This method was developed by Whiteing (2013) and attempts to measure the juice lost on trash to capture of the entire sugar (juice, etc.) loss. The residues from the harvest were shredded and frozen on field before laboratory analysis. The samples were blended with distilled water and the juices were extracted by a hydraulic press for later evaluation of the amount of sugar loss by the colorimetric technique (Campbell et al. 1999). In addition to the sampling regime from Bundaberg in 2014, samples of billet were collected from the Macknade field during cutting from each plot in order to measure the billet size distribution and quantify the amount of extraneous matter from the chopper harvester following the method of De Beer
et al. (1985).
Results and discussion
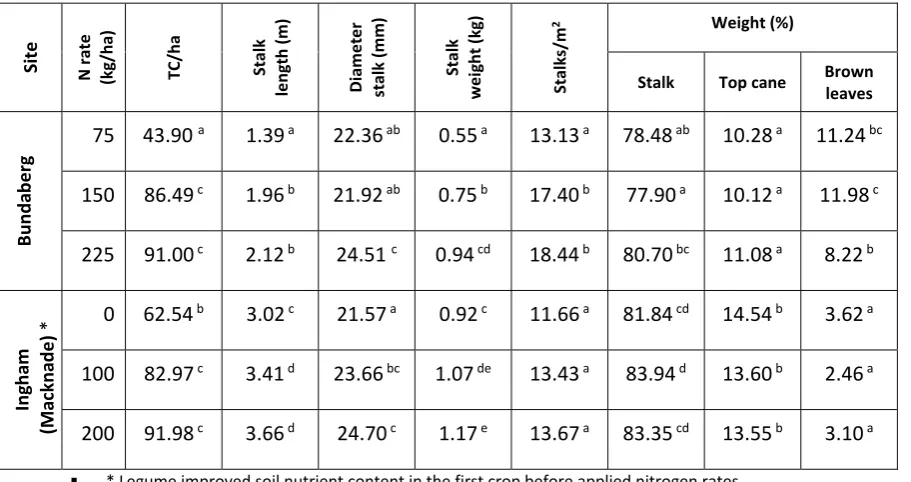
The varying nitrogen rates applied to the field (Table 1) resulted in a range of crop
significant (P<0.05) particularly at the Macknade site. Cane yield, influenced by the N applied, would then lead to the various pour rates when the ground speed of the harvester was constant.
Table 1 The physical properties of sugarcane influenced by the different nitrogen rates
Site N rate (kg/ha) TC/h a Stalk lengt h (m) Diamet er stalk (mm) Stalk weight (kg) Stalks/m 2
Weight (%)
Stalk Top cane Brown leaves
Bu
nda
berg
75 43.90
a 1.39 a 22.36 ab 0.55 a 13.13 a 78.48 ab 10.28 a 11.24 bc
150 86.49 c 1.96 b 21.92 ab 0.75 b 17.40 b 77.90 a 10.12 a 11.98 c
225 91.00 c 2.12 b 24.51 c 0.94 cd 18.44 b 80.70 bc 11.08 a 8.22 b
Ing h am (Mackna d e) *
0 62.54 b 3.02 c 21.57 a 0.92 c 11.66 a 81.84 cd 14.54 b 3.62 a
100 82.97 c 3.41 d 23.66 bc 1.07 de 13.43 a 83.94 d 13.60 b 2.46 a
200 91.98 c 3.66 d 24.70 c 1.17 e 13.67 a 83.35 cd 13.55 b 3.10 a * Legume improved soil nutrient content in the first crop before applied nitrogen rates
[image:4.595.73.529.154.395.2]
Fig. 1. The classification of cane samples from the different pour rate impacted by varying
nitrogen rates at Macknade trials
The billet samples were assessed for both billet length and quality (Figure 2 and 3). The billet length distribution (Figure 2) in Low, Medium and High fertiliser rates showed different means, however, the differences were not statistically significant (P<0.05). The billet length category 100-150 mm contained 43.89% of all samples and was, therefore, the most abundant.
Fig. 2. The classification of billet length from the harvester influenced by the different
nitrogen rates at Macknade trails
94.19a 92.75b 92.31b
5.78a 7.15b 7.51b
0.03a 0.10a 0.18a
0 10 20 30 40 50 60 70 80 90 100
37.52 T/h 49.78 T/h 55.19 T/h
M
aterial (%)
Harvesting Pour Rate
Cane Billet (%) Trash (%) Soil and Dirt (%)
Low N Medium N High N
0 10 20 30 40 50 60
0-100 100-150 150-200 200-250 250-300 300-350
Billet in
Each
Categ
o
ry
(%)
Billet Length Category (mm)
[image:5.595.104.492.69.315.2] [image:5.595.103.494.471.678.2]Billets were classified into three quality based categories (Figure 3) on the assessment methodology detailed by De Beer et al. (1985):
Sound billet - stalk section longer than 100 mm with no splits, small rind crack
less than 40 mm long and no section of rind more than 400 mm2 removed; Damaged billet - spilt of rind larger than 40 mm or rind section around
400-2000 mm2 removed, all billets less than 100 mm long;
Mutilated billet - numerous rind cracks with more than 2000 mm2 of rind
removed.
Nitrogen rates influenced the quality of cane cut by the mechanical harvester. The percentage of damaged and mutilated billets increased when the higher nitrogen was applied in the plots. The percentage of sound billets increased when cut in the lower N plots. The volume of fertiliser which affected the size of stalk length and diameter also resulted in the increase of billet weight and size. The light billets (damaged and mutilated types in the low N plots) were easier to be ejected by the cleaning system compared to the heavy ones. The proportion of sound billet quality driven by the lower N levels lead to an increase in cane supply. Conversely, in the high nutrient plots, larger and heavier billets mixing with trash were more difficult to separate by the cleaning system. Some billets impacted the extractor fan during separation of EM and fell down to mix with the other billets in the bin.
Fig. 3. The billet quality from the harvester influenced by the different nitrogen rates at
Macknade trials.
87.97a
79.76b
74.13b
5.87a 8.24ab
12.49b
6.16a 12.00
b 13.38b
0 10 20 30 40 50 60 70 80 90 100
SL SM SH DL DM DH ML MM MH
Percen
tag
e o
f Billet
Qu
ality
Billet Quality Category
Billet Quality S : Sound D : Damaged M: Mutilated
Nitrogen L : Low M: Medium H : High
[image:6.595.95.503.473.713.2]When the ground speed of the harvester is constant, the varying cane yields and crop factors drive the pour rate conditions during cutting by the machine. The different crop factors are influenced by the many fertiliser rates which impact on the quality and quantity of billets during harvesting (Anon. 2014) particularly sugar loss and trash mixing in the billet supply from the cleaning systems. The residues, which were removed during the cleaning by the
extractor fans, were gathered by the tarp test (De Beer et al. 1985; Whiteing 2013). The juice samples were measured by the colorimetric method (Campbell et al. 1999) to find the sugar loss adhering to trash during harvesting by testing with a Glucose and Sucrose Assay Kit from Sigma-Aldrich, USA. The sugar loss resulting from the cutting are shown in Table 2. In the Bundaberg trials, the tarp sugar loss occurring from the nitrogen rates increased (0.43 t/ha) during harvesting in the low nutrient (N 75 kg/ha) but were not significant different (P<0.05) from the other rates. However, when compared to sugar loss percentage in three nutrient rates, sugar loss (7.09 %) in the low fertiliser rate was the highest (P< 0.05).
Table 2 The amount of sugar loss during cutting by the chopper harvester at Bundaberg
trials.
Site N rate (kg/ha)
Sugar yield
(t/ha)
Tarp sugar loss
(t/ha)
sugar loss per sugar yield
(%)
Bu
nda
berg
75 6.84a 0.43a 7.09 a
150 13.92b 0.35a 2.55 b
225 14.25b 0.38a 2.67 b
P < 0.05
[image:7.595.73.526.406.517.2]Besides the crop production (Muchow et al. 1996; Wiedenfeld 1997) and sugar quality (Wiedenfeld 1995) attributes influenced by the varying N rates, the physical properties of sugarcane were also affected causing quality and quantity differences during harvesting by the machine. The EM and sugar loss resultants from the varying pour rates driven by the N applied (with a fixed ground speed) are one of the important impacts on cane supply identified in this
work. Thus, the crop nutrient practises are important factors to improve cane supply during harvesting for this industry.
Conclusions
Crop condition is one of the important factors to impact the cane harvester efficiency especially pour rate, cane cleaning and loss during cutting. Crop yield in this report was driven by the rate of N fertiliser and resulted in the different physical properties of cane such as stalk length, diameter and weight, and the percentage of the tops and brown leaves. When the ground speed of the harvester was constant during the cutting, the pour rate was impacted by the various cane factors. As the pour rate increased, the capacity of the cleaning fan to efficiently differentiate trash from billets decreased, resulting in increased sugar loss. The billet length distribution test at the Macknade site indicated that 43.9% of cane billets from all fertiliser treatments were in the range of 100-150 mm. The percentage of sound billets from the low nutrient plots during the cutting increased whereas in the blocks which received high levels of N fertiliser, it decreased. Also, the percentage of damaged and mutilated types tended to increase with an increase in N rate as billets hit the extractor fan during cleaning. The sugar loss of samples from different fertilisation was different during cutting. Trash samples blown out by the cleaning fan were collected from the field to test in a laboratory by the colorimetric technique. The percentage of sugar loss in the samples from the low fertilisere soil was higher compared to the loss in the samples from higher fertilisations when cut by the sugarcane harvester.
Acknowledgement
The authors gratefully acknowledge the financial and facilities support from Sugar
Research Australia (SRA) and in particular, staff at Bundaberg (John Panitz) and Ingham (Glen
Park) for their assistance. Funding from USQ to cover operating costs is also acknowledged.
Finally, the Royal Thai Government and Kasetsart University are also acknowledged for their
Reference
Agnew JR, Sandell GR, Stainlay GT, Whiteing C. 2002. Increased sugar industry profitability
through harvesting best practice. Proceedings of the Australian Society of Sugar Cane
Technologists 24: 184-189.
Anon. 2013. The sugarcane advisors information kit. Sugar Research Australia, Indooroopilly, Brisbane.
Anon. 2014. Harvesting best practice manual. Sugar Research Australia, Indooroopilly, Brisbane.
Campbell JA, Hansen RW, Wilson JR. 1999. Cost-effective colorimetric microtitre plate
enzymatic assays for sucrose, glucose and fructose in sugarcane tissue extracts. Journal of the
Science Food and Agriculture 79: 232-236.
Davis RJ, Norris CP, Whiteing C. 2009. A review of opportunities to improve the performance of sugarcane harvesters, FSA Consulting Report 6889/1, Toowoomba, Queensland.
De Beer AG, Baxter SWD, Ridge DR, Abreu Cil J, Clayton JE. 1985. Report by the agricultural engineering section committee. International Society of Sugar Cane Technologists, South African Sugar Association Experiment Station, Mount Edgecombe.
Jones RK (Ed.). 2004. Cane harvesting to improve industry performance: a review of sugar cane harvesting practices and options for improvement. SRDC Technical Report 2/2004, Sugar
Research and Development Corporation, Brisbane.
Muchow R, Robertson M, Wood A, Keating B. 1996. Effect of nitrogen on the time-course of sucrose accumulation in sugarcane. Field Crops Research 47: 143-153.
Whiteing C. 2013. Measurement of in-field sucrose loss by mobile refractometer. SRDC Final Report SD13001, Sugar Research and Development Corporation, Brisbane.
Wiedenfeld R. 1997. Sugarcane responses to N fertilizer application on clay soils. J. Amer.
Soc. Sugar Cane Technol 17: 14-27.
Wiedenfeld RP. 1995. Effects of irrigation and N fertilizer application on sugarcane yield and