Faculty of Health, Engineering and Sciences
Operational Characteristics of Surge
Arresters within High Voltage
Substations
A dissertation submitted by
Mr Andrew James Close
In fulfilment of the requirements of
ENG4112 Research Project
Bachelor of Engineering (Honours)
Power Major
ABSTRACT
Surge arresters form a critical component in the safe and reliable operation of electrical zone substations. Overvoltages resulting from a lightning strike pose the greatest risk of damage to substation equipment reaching peak values of over 100 times the nominal line voltage within microseconds. During such overvoltage events, the surge arrester limits the level of voltage that the equipment is subjected to, thus providing protection to very expensive, and specialised electrical infrastructure.
Correct arrester specification is the first step in determining the type of surge arrester required for each installation. A second, but no less important step is determination of its physical location and connection method. The distance a surge arrester is located from equipment is a significant factor in its ability in protecting equipment.
University of Southern Queensland Faculty of Health, Engineering and Sciences
ENG4111/ENG4112 Research Project
Limitations of Use
The Council of the University of Southern Queensland, its Faculty of Health, Engineering & Sciences, and the staff of the University of Southern Queensland, do not accept any responsibility for the truth, accuracy or completeness of material contained within or associated with this dissertation.
Persons using all or any part of this material do so at their own risk, and not at the risk of the Council of the University of Southern Queensland, its Faculty of Health, Engineering & Sciences or the staff of the University of Southern Queensland.
University of Southern Queensland Faculty of Health, Engineering and Sciences
ENG4111/ENG4112 Research Project
Certification of Dissertation
I certify that the ideas, designs and experimental work, results, analyses and conclusions set out in this dissertation are entirely my own effort, except where otherwise indicated and acknowledged.
I further certify that the work is original and has not been previously submitted for assessment in any other course or institution, except where specifically stated.
Andrew Close
ACKNOWLEDGEMENTS
This dissertation would not have been possible without the help and support of a number of people who I would like to give thanks.
I wish to firstly thank my wife Tennille, who has stood beside me both during the exciting times when all the pieces of the puzzle fell together as well as through the challenging times. After all your love and support through countless late nights, frustrations and sacrifices I am honoured to be completing this last chapter with you by my side.
To my two wonderfully understanding girls Sienna and Charlotte. You both have been so patient and understanding when I have had to study. Thank you. And to my unborn son, thank you for listening to me each night. I am looking forward to so much more time with you all.
Thank you to my supervisor, Associate Professor Dr Tony Ahfock. Your support and guidance truly has been appreciated. Thank you also for all the time you have given me to assist whenever it was needed. It has been an honour to complete this dissertation under your guidance.
Thanks are given to my employer Essential Energy. They have provided both financial and technical assistance throughout my years of studying, without which, completion of this dissertation would not have been possible.
To Luke Clout and Glen Barnes. Thank you for your support, supervision and guidance throughout this dissertation. Working with you both has shown me not only the technical traits that make for a great engineer, but also the professionalism and integrity required.
TABLE OF CONTENTS
ABSTRACT ... II
LIMITATIONS OF USE ... III
CERTIFICATION OF DISSERTATION ... IV
ACKNOWLEDGEMENTS ... V
LIST OF FIGURES ... X
LIST OF TABLES ... XV
GLOSSARY OF TERMS ... XVII
NOMENCLATURE ... XVIII
INTRODUCTION... 1
BACKGROUND ... 2
RESEARCH OBJECTIVES ... 2
LITERATURE REVIEW ... 4
INTRODUCTION ... 4
SURGE VOLTAGES ... 5
2.2.1 Lightning Overvoltages ... 5
2.2.2 Switching Overvoltages... 5
2.2.3 Temporary Overvoltages... 6
2.2.4 Travelling Wave ... 6
2.2.5 Surge Impedance and Velocity ... 7
2.2.6 Sequence Components... 9
2.2.7 Steepness of Incoming Surge ... 11
LIGHTNING ... 12
2.3.1 Lightning Process ... 13
2.3.2 Lightning Categories ... 13
2.3.3 Back Flashover ... 15
2.3.4 Direct Lightning Strike... 15
2.3.5 Indirect Lightning Strike ... 16
2.3.6 Lightning Parameters ... 16
HISTORY OF SURGE ARRESTERS ... 20
SURGE ARRESTER DESIGN ... 21
2.5.1 Electrical Characteristics ... 21
2.5.2 Construction Characteristics ... 21
2.5.3 Energy Handling Capability ... 22
2.5.4 Surge Arrester Models ... 23
2.5.5 Pincetti-Gianettoni Model ... 24
2.5.6 Fernandez-Diaz Model ... 25
2.5.7 ATP Model ... 26
2.5.8 Model Parameters ... 27
2.5.9 Model Accuracy ... 28
SURGE ARRESTER OPERATION ... 29
INSULATION CO-ORDINATION ... 30
2.7.1 Insulation Types ... 30
2.7.2 Basic Lightning Impulse Insulation Level (BIL) ... 30
2.7.3 Critical Flash Over ... 31
2.7.4 Basic Switching Impulse Level (BSL) ... 31
SURGE ARRESTER CLASSIFICATION ... 32
2.8.2 Intermediate Class ... 32
2.8.3 Distribution Class ... 32
SURGE ARRESTER PROTECTIVE ZONE ... 33
AUSTRALIAN AND INTERNATIONAL STANDARDS ... 34
2.10.1 AS1307 Surge Arresters ... 34
2.10.2 AS2067-2016 Substations and High Voltage Installations Exceeding 1kV a.c ... 34
2.10.3 AS1768-2007 Lightning Protection... 35
2.10.4 AS1824 Insulation Co-ordination ... 35
2.10.5 AS1824.2-1985 Part 2: Application Guide ... 36
2.10.6 AS7000-2010 Overhead Line Design ... 36
COMPUTER SIMULATION PROGRAMS ... 38
2.11.1 Simulation Accuracy ... 38
2.11.2 Alternative Transients Program ... 38
2.11.3 ATPDraw ... 39
2.11.4 CDEGS... 39
2.11.5 Software Determination ... 44
CASE STUDIES ... 45
INTRODUCTION ... 45
CASE STUDY 1-STANDARD OVERHEAD LINE AND ZONE SUBSTATION ... 45
3.2.1 Standard Overhead Line ... 45
3.2.2 Standard Zone Substation ... 45
CASE STUDY 2-KYWONG ZONE SUBSTATION ... 46
3.3.1 Overhead Line 840/3 and 840/4 ... 46
3.3.2 Zone Substation ... 46
DESIGN METHODOLOGIES ... 47
INTRODUCTION ... 47
66KVSUBTRANSMISSION LINES ... 47
4.2.1 Standard 66kV Intermediate Delta Construction ... 47
4.2.2 66kV Feeders 840/3 & 840/4 Construction ... 48
4.2.3 Maximum Operating Temperature ... 49
4.2.4 Maximum Span Length... 49
4.2.5 Phase Conductors ... 50
4.2.6 Overhead Earth Wire ... 51
4.2.7 Optical Fibre Ground Wire ... 53
4.2.8 Conductor Sag ... 53
4.2.9 Insulators ... 53
TEMPLATE ZONE SUBSTATION DESIGN ... 55
4.3.1 Introduction ... 55
4.3.2 Minimum Electrical Clearances ... 55
4.3.3 Lightning Protection ... 55
4.3.4 Lightning Protection Level ... 56
4.3.5 Insulators ... 56
4.3.6 Equipment ... 57
4.3.7 Zone Substation Primary Conductors ... 57
4.3.8 Substation Earth Grid ... 58
4.3.9 Surge Arrester Locations ... 58
ESSENTIAL ENERGY PERIOD CONTRACT SURGE ARRESTER ... 61
MODELLING METHODOLOGIES ... 62
ATP ... 62
5.1.1 ATP Settings ... 62
5.1.2 IEEE Modelling Guidelines for Fast Front Transients ... 62
5.1.4 Power Frequency Voltage ... 67
MODEL VALIDATION ... 68
INTRODUCTION ... 68
6.1.1 Aim ... 68
6.1.2 Objectives ... 68
VALIDATION CASE STUDY 1 ... 68
6.2.1 Methodology ... 68
6.2.2 Case Study 1, Validation Results ... 69
6.2.3 Case Study 1, Validation Results Discussion ... 70
VALIDATION CASE STUDY 2 ... 71
6.3.1 Methodology ... 71
6.3.2 Case Study 2, Validation Results ... 72
6.3.3 Case Study 2, Validation Results Discussion ... 72
SIMULATION RESULTS ... 74
INTRODUCTION ... 74
7.1.1 Surge Arrester Connection Leads ... 75
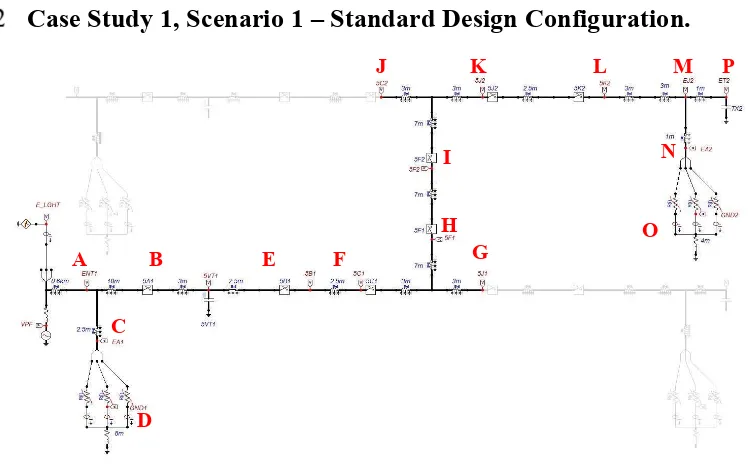
CASE STUDY 1,SCENARIO 1–STANDARD DESIGN CONFIGURATION. ... 76
7.2.1 Objective ... 76
7.2.2 Methodology ... 76
7.2.3 Case Study 1, Scenario 1 Results ... 77
7.2.4 Case Study 1, Scenario 1 Result Discussion ... 78
CASE STUDY 1,SCENARIO 2–STANDARD DESIGN,TRANSFORMER SURGE ARRESTER ONLY. 81 7.3.1 Objective ... 81
7.3.2 Methodology ... 81
7.3.3 Case Study 1, Scenario 2 Results ... 82
7.3.4 Case Study 1, Scenario 2 Result Discussion ... 83
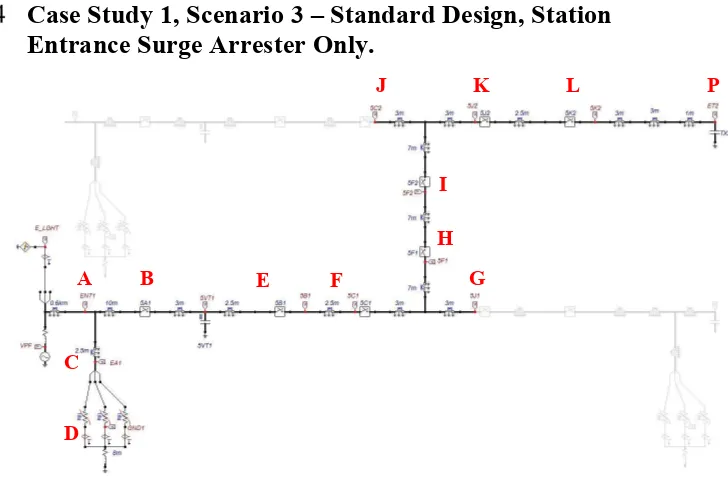
CASE STUDY 1, SCENARIO 3 – STANDARD DESIGN, STATION ENTRANCE SURGE ARRESTER ONLY. ... 84
7.4.1 Objective ... 84
7.4.2 Methodology ... 84
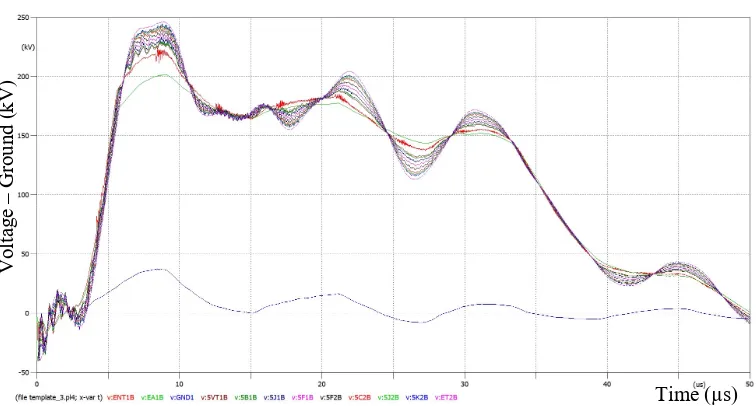
7.4.3 Case Study 1, Scenario 3 Results ... 85
7.4.4 Case Study 1, Scenario 3 Result Discussion ... 86
CASE STUDY 1,SCENARIO 4– STANDARD DESIGN CONFIGURATION.COMPARISON OF VARYING INCOMING LEAD AND EARTH CONNECTION LENGTHS. ... 87
7.5.1 Objectives ... 87
7.5.2 Methodology ... 87
7.5.3 Case Study 1 Scenario 4a Results ... 88
7.5.4 Case Study 1 Scenario 4b Results ... 91
7.5.5 Case Study 1, Scenario 4c Results ... 94
7.5.6 Case Study 1, Scenario 4d Results ... 97
7.5.7 Case Study 1, Scenario 4d Result Discussion ... 98
7.5.8 Case Study 1, Scenario 4e Results ... 100
7.5.9 Case Study 1, Scenario 4e Result Discussion ... 101
7.5.10 Case Study 1, Scenario 4f Results ... 102
7.5.11 Case Study 1, Scenario 4f Result Discussion ... 103
CASE STUDY 1,SCENARIO 5–ALTERNATE SURGE ARRESTER CONNECTION ARRANGEMENT. ... 105
7.5.12 Objectives ... 105
7.5.13 Methodology ... 105
7.5.14 Results ... 106
7.5.15 Result Discussion ... 106
7.6.1 Objectives ... 108
7.6.2 Methodology ... 108
7.6.3 Case Study 1 Scenario 6 Results ... 110
7.6.4 Case Study 1, Scenario 6 Result Discussion ... 110
CASE STUDY 1,SCENARIO 7–LIGHTNING STRIKE ONTO ZONE SUBSTATION... 112
7.7.1 Objectives ... 112
7.7.2 Methodology ... 112
7.7.3 Case Study 1 Scenario 7 Results ... 113
7.7.4 Case Study 1, Scenario 7 Result Discussion ... 113
CASE STUDY 2,SCENARIO 1–IN SERVICE SUBSTATION CONFIGURATION. ... 115
7.8.1 Objectives ... 115
7.8.2 Methodology ... 115
7.8.3 Case Study 2, Scenario 1 Results ... 116
7.8.4 Case Study 2, Scenario 1 Result Discussion ... 116
CASE STUDY 2,SCENARIO 2–RECORDED LIGHTNING STRIKE ONTO OVERHEAD LINE. ... 118
7.9.1 Objectives ... 118
7.9.2 Methodology ... 118
7.9.3 Case Study 2, Scenario 2 Results ... 119
7.9.4 Case Study 2, Scenario 2 Result Discussion ... 120
CASE STUDY 2,SCENARIO 3–LIGHTNING STRIKE ONTO ZONE SUBSTATION ... 121
7.10.1 Objectives ... 121
7.10.2 Methodology ... 121
7.10.3 Case Study 2, Scenario 3 Results ... 122
7.10.4 Case Study 2, Scenario 3 Result Discussion ... 124
7.10.5 Results Summary ... 125
CONCLUSION ... 127
FURTHER WORK ... 128
REFERENCES ... 129
APPENDIX A ... 136
APPENDIX B ... 137
APPENDIX C ... 138
APPENDIX D ... 139
APPENDIX E ... 140
APPENDIX F ... 146
APPENDIX G ... 149
APPENDIX H ... 151
APPENDIX I ... 159
APPENDIX J ... 161
APPENDIX K ... 164
APPENDIX L ... 168
APPENDIX M ... 172
LIST OF FIGURES
Figure 1-1 Essential Energy Regional Area (Essential Energy 2015b) ... 1
Figure 2-1 Bewley Lattice diagram ... 7
Figure 2-2 Balanced and Unbalance System (Marx & Bender 2013) ... 9
Figure 2-3 Sequence Components (Electrical4u 2011) ... 9
Figure 2-4 Lightning Density Map of Australia (AS1768 2007) ... 12
Figure 2-5 Lightning Strokes (a) Negative Downward (b) Positive Downward (c) Positive Upward (d) Negative Upward (Heidler et al. 2008) ... 15
Figure 2-6 Seasonal Distribution of Monthly Mean Thunderstorm Days – Melbourne (Kuleshov 2012) ... 17
Figure 2-7 Lightning Capture Area (Google Earth 2013a) ... 17
Figure 2-8 Negative Polarity Lightning Magnitude Probability Density Plot ... 18
Figure 2-9 Discharge Current Waveshape (AS1768 2007) ... 18
Figure 2-10 Open-Circuit Voltage Waveshape (AS1768 2007) ... 19
Figure 2-11 Porcelain MO arrester cross section (Hinrichsen 2012) ... 22
Figure 2-12 Polymer MO arrester cross section (Hinrichsen 2012) ... 22
Figure 2-13 Surge Arrester Line Discharge Class (AS1307.2 1996) ... 23
Figure 2-14 IEEE ‘Conventional’ Model (Abdulwadood 2013)... 24
Figure 2-15 Pincetti-Gianettoni Model (Abdulwadood 2013) ... 25
Figure 2-16 Fernandez-Diaz (Abdulwadood 2013) ... 25
Figure 2-17 A0 and A1 V-I Characteristics (Abdulwadood 2013) ... 27
Figure 2-18 Simplified overvoltage diagram (ABB high voltage technologies 1999) ... 29
Figure 2-19 Insulation Strength Characteristic (Hileman 1999) ... 31
Figure 2-20 Example of Double Exponential Lightning Surge (SES Technologies 2006) ... 40
Figure 2-21 Example of Transient Voltage Response using CDEGS (SES Technologies 2006) ... 41
Figure 2-22 CDEGS Results 20kA, 10000m, 10mH Simulation ... 42
Figure 2-23 ATP Results 20kA, 10000m, 10mH Simulation ... 42
Figure 2-24 Typical MOV arrester V-I characteristics for various values of α (Stephane Franiette et al. 2015) ... 43
Figure 3-1 Typical 66kV Construction Feeder 840/3 & 4 ... 46
Figure 4-1 66kV Intermediate Delta Construction (Essential Energy 2014h) ... 47
Figure 4-2 Shielding Angle () (Hileman 1999) ... 51
Figure 4-3 Geometric model depicting angle alpha (Hileman 1999) ... 52
Figure 4-4 Essential Energy Type 1 Construction Shielding Angles ... 52
Figure 4-5 Case Study 1 - Insulator Arrangement ... 54
Figure 4-6 Case Study 2 - Insulator Arrangement (Preformed Line Products 2014) ... 54
Figure 4-7 Case Study 1 - Lightning Protection Using 30m Rolling Sphere (Essential Energy 2014f) ... 56
Figure 4-8 Case Study 2 - 66kV Insulator ... 56
Figure 4-11 Case Study 1 - Surge Arresters at HV Side of Transformer (Essential Energy 2014e)60
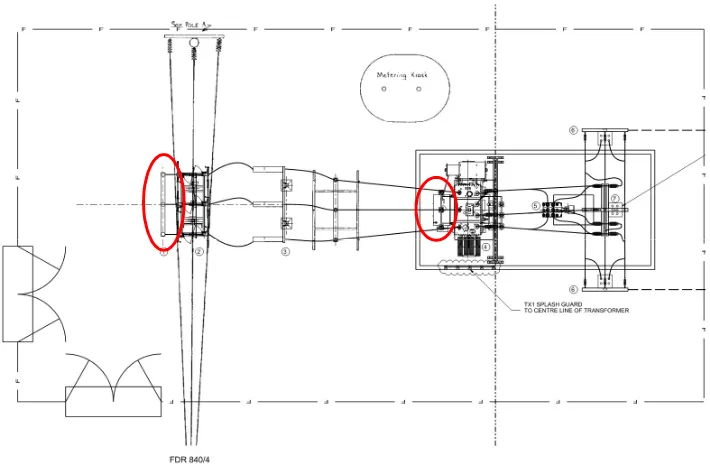
Figure 4-12 Case Study 2 - Surge Arrester Locations (Plan View) (Essential Energy 2016d) ... 60
Figure 4-13 Case Study 2 - Surge Arresters Located at Station Entrance and Transformer (Essential Energy 2016c) ... 60
Figure 5-1 ATP-Draw Distributed Parameter Line Component ... 63
Figure 5-2 ATP-Draw LCC Component ... 63
Figure 5-3 Resultant ATP Calculated Voltage Waveform Comparison. Negative Polarity (Left), Positive Polarity (Right) ... 65
Figure 5-4 Case Study 1 Validation Lightning Waveform ... 66
Figure 5-5 14 kA 8/20 s Lightning Current Waveform ... 66
Figure 6-1 Case Study 1, Validation - ATP Model ... 68
Figure 6-2 Case Study 1, Validation - ATP Voltage to Ground Measurements ... 69
Figure 6-3 Case Study 2, Validation - ATP Model ... 71
Figure 6-4 Case Study 2, Validation - ATP Voltage to Ground Measurements ... 72
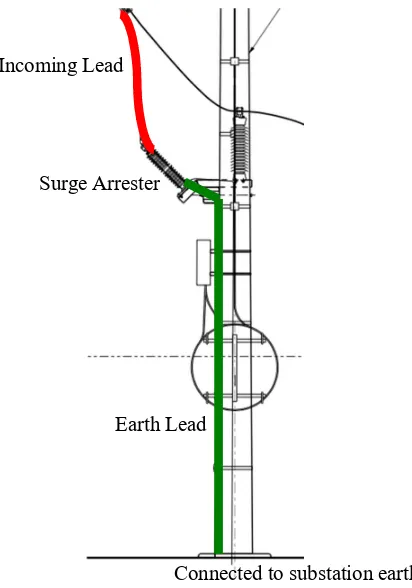
Figure 7-1 Typical Surge Arrester Incoming Lead (Red) and Earth Lead (Green) ... 75
Figure 7-2 Case Study 1, Scenario 1 - ATP Model ... 76
Figure 7-3 Case Study 1, Scenario 1 - ATP Voltage to Ground Measurements ... 77
Figure 7-4 Case Study 1, Scenario 1 - ATP Arrester Currents ... 77
Figure 7-5 Network Equivalent Circuit ... 79
Figure 7-6 Case Study 1, Scenario 2 - ATP Model ... 81
Figure 7-7 Case Study 1, Scenario 2 - ATP Voltage to Ground Measurements ... 82
Figure 7-8 Case Study 1, Scenario 3 - ATP Model ... 84
Figure 7-9 Case Study 1, Scenario 3 - ATP Voltage to Ground Measurements ... 85
Figure 7-10 Case Study 1, Scenario 4 - ATP Model ... 87
Figure 7-11 Case Study 1, Scenario 4a – 1m ATP Voltage to Ground Measurements ... 89
Figure 7-12 Case Study 1, Scenario 4a –15m ATP Voltage to Ground Measurements ... 89
Figure 7-13 Case Study 1, Scenario 4b – 1m ATP Voltage to Ground Measurements ... 91
Figure 7-14 Case Study 1, Scenario 4b – 15m ATP Voltage to Ground Measurements ... 92
Figure 7-15 Case Study 1, Scenario 2 – 5 m Lead Length at Transformer 2 ATP V - G Measurement... 93
Figure 7-16 Case Study 1, Scenario 4c – 1m ATP Voltage to Ground Measurements ... 95
Figure 7-17 Case Study 1, Scenario 4c – 30m ATP Voltage to Ground Measurements ... 95
Figure 7-18 Case Study 1, Scenario 4c – 21m ATP Voltage to Ground Measurements ... 96
Figure 7-19 Case Study 1, Scenario 4d – 1 m ATP Voltage to Ground Measurements ... 98
Figure 7-20 Case Study 1, Scenario 4d – 30 m ATP Voltage to Ground Measurements ... 98
Figure 7-21 Case Study 1, Scenario 4d – 12m ATP Voltage to Ground Measurements ... 99
Figure 7-22 Case Study 1, Scenario 4e – 1 m ATP Voltage to Ground Measurements ... 100
Figure 7-23 Case Study 1, Scenario 4e – 15 m ATP Voltage to Ground Measurements ... 101
Figure 7-24 Case Study 1, Scenario 4f – 1 m ATP Voltage to Ground Measurements ... 103
Figure 7-25 Case Study 1, Scenario 4f – 30 m ATP Voltage to Ground Measurements ... 103
Figure 7-26 Case Study 1, Scenario 5 - ATP Model ... 105
Figure 7-28 Case Study 1, Scenario 5 – Extended Transformer Incoming Lead Length ATP
Voltage to Ground Plot ... 107
Figure 7-29 Case Study 1, Scenario 6 - CB 5B1 ATP Voltage to Ground Measurements ... 110
Figure 7-30 Case Study 1, Scenario 6 - Transformer ET2 ATP Voltage to Ground Measurements110 Figure 7-31 Case Study 2, Scenario 1 - ATP Model ... 115
Figure 7-32 Case Study 2, Scenario 1- ATP Voltage to Ground Measurements ... 116
Figure 7-33 Case Study 2, Scenario 1 Station entrance Surge Arrester Only ATP Voltage to Ground Measurements ... 117
Figure 7-34 Case Study 2, Scenario 2 - ATP Model ... 118
Figure 7-35 Case Study 2, Scenario 2 - ATP Voltage to Ground Measurements ... 119
Figure 7-36 Case Study 2, Scenario 3 - ATP Model ... 121
Figure 7-37 Case Study 2, Scenario 3 Station Entrance And Transformer Surge Arrester, ATP Voltage to Ground Measurements ... 123
Figure 7-38 Case Study 2, Scenario 3 Station Entrance Surge Arrester Only, ATP Voltage to Ground Measurements ... 123
Figure 7-39 Case Study 1, Scenario 7 Transformer Surge Arrester Only, ATP Voltage to Ground Measurements ... 123
Figure 11-1 Zone Substation Minimum Electrical Clearances (AS2067 2016) ... 137
Figure 12-1 Essential Energy Standard 66 kV Pole Constructions (Essential Energy 2014d) ... 138
Figure 13-1 Essential Energy 66kV Intermediate Delta Construction (Compact) (Essential Energy 2014h) ... 139
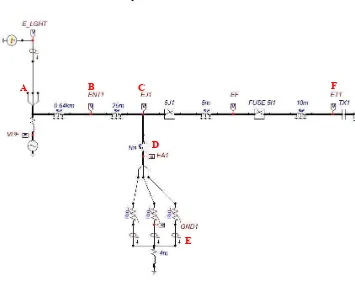
Figure 14-1 Case Study 1, Essential Energy Standard 66/11kV Zone Substation Single Line Diagram (Essential Energy 2016b) ... 140
Figure 14-2 Case Study 1, Essential Energy Standard 66/11kV Zone Substation Plan View (Essential Energy 2014a) ... 141
Figure 14-3 Case Study 1, Essential Energy Standard 66/11kV Zone Substation Station Entrance Elevation (Essential Energy 2014f) ... 142
Figure 14-4 Case Study 1, Essential Energy Standard 66/11kV Zone Substation Transformer Elevation (Essential Energy 2014e) ... 143
Figure 14-5 Case Study 1, Essential Energy Standard 66/11kV Zone Substation Transverse Busbar Elevation (Essential Energy 2014c) ... 144
Figure 14-6 Case Study 1, Essential Energy Standard 66/11kV Zone Substation Equipment Table (Essential Energy 2014b) ... 145
Figure 15-1 Case Study 2, Kywong 66/11kV Zone Substation Single Line Diagram (Essential Energy 2016a) ... 146
Figure 15-2 Case Study 2, Kywong 66/11kV Zone Substation Plan View (Essential Energy 2016d)147 Figure 15-3 Case Study 2, Kywong 66/11kV Zone Substation Elevation (Essential Energy 2016c)148 Figure 19-1 Essential Energy 66 kV Period Contract Surge Arrester Specification Part 1 (Tyree 2015) ... 161
Figure 19-3 Essential Energy 66 kV Period Contract Surge Arrester Specification Part 3 (Tyree
2015) ... 163
Figure 22-1 Case Study 1, Scenario 1 - ATP Voltage to Ground Plot ... 172
Figure 22-2 Case Study 1, Scenario 1 - ATP Surge Arrester & Lightning Current Plot ... 172
Figure 22-3 Case Study 1, Scenario 2 - ATP Voltage to Ground Plot ... 173
Figure 22-4 Case Study 1, Scenario 3 - ATP Voltage to Ground Plot ... 173
Figure 22-5 Case Study 1, Scenario 4a – 1m ATP Voltage to Ground Plot ... 173
Figure 22-6 Case Study 1, Scenario 4a – 2.5m ATP Voltage to Ground Plot ... 174
Figure 22-7 Case Study 1, Scenario 4a – 5m ATP Voltage to Ground Plot ... 174
Figure 22-8 Case Study 1, Scenario 4a – 10m ATP Voltage to Ground Plot ... 174
Figure 22-9 Case Study 1, Scenario 4a –15m ATP Voltage to Ground Plot ... 175
Figure 22-10 Case Study 1, Scenario 4b – 1m ATP Voltage to Ground Plot ... 175
Figure 22-11 Case Study 1, Scenario 4b – 2.5m ATP Voltage to Ground Plot ... 175
Figure 22-12 Case Study 1, Scenario 4b – 5m ATP Voltage to Ground Plot ... 176
Figure 22-13 Case Study 1, Scenario 4b – 10m ATP Voltage to Ground Plot ... 176
Figure 22-14 Case Study 1, Scenario 4b – 15m ATP Voltage to Ground Plot ... 176
Figure 22-15 Case Study 1, Scenario 4c – 1m ATP Voltage to Ground Plot ... 177
Figure 22-16 Case Study 1, Scenario 4c – 2m ATP Voltage to Ground Plot ... 177
Figure 22-17 Case Study 1, Scenario 4c – 4m ATP Voltage to Ground Plot ... 177
Figure 22-18 Case Study 1, Scenario 4c – 8m ATP Voltage to Ground Plot ... 178
Figure 22-19 Case Study 1, Scenario 4c – 15m ATP Voltage to Ground Plot ... 178
Figure 22-20 Case Study 1, Scenario 4c – 30m ATP Voltage to Ground Plot ... 178
Figure 22-21 Case Study 1, Scenario 4d – 1 m ATP Voltage to Ground Plot ... 179
Figure 22-22 Case Study 1, Scenario 4d – 2 m ATP Voltage to Ground Plot ... 179
Figure 22-23 Case Study 1, Scenario 4d – 4 m ATP Voltage to Ground Plot ... 179
Figure 22-24 Case Study 1, Scenario 4d – 8 m ATP Voltage to Ground Plot ... 180
Figure 22-25 Case Study 1, Scenario 4d – 15 m ATP Voltage to Ground Plot ... 180
Figure 22-26 Case Study 1, Scenario 4d – 30 m ATP Voltage to Ground Plot ... 180
Figure 22-27 Case Study 1, Scenario 4e – 1 m ATP Voltage to Ground Plot ... 181
Figure 22-28 Case Study 1, Scenario 4e – 2.5 m ATP Voltage to Ground Plot ... 181
Figure 22-29 Case Study 1, Scenario 4e– 5 m ATP Voltage to Ground Plot ... 181
Figure 22-30 Case Study 1, Scenario 4e – 10 m ATP Voltage to Ground Plot ... 182
Figure 22-31 Case Study 1, Scenario 4e – 15 m ATP Voltage to Ground Plot ... 182
Figure 22-32 Case Study 1, Scenario 4f – 1 m ATP Voltage to Ground Plot ... 182
Figure 22-33 Case Study 1, Scenario 4f – 2 m ATP Voltage to Ground Plot ... 183
Figure 22-34 Case Study 1, Scenario 4f – 4 m ATP Voltage to Ground Plot ... 183
Figure 22-35 Case Study 1, Scenario 4f – 8 m ATP Voltage to Ground Plot ... 183
Figure 22-36 Case Study 1, Scenario 4f – 15 m ATP Voltage to Ground Plot ... 184
Figure 22-37 Case Study 1, Scenario 4f – 30 m ATP Voltage to Ground Plot ... 184
Figure 22-38 Case Study 1, Scenario 5 - ATP Voltage to Ground Plot ... 184
Figure 22-39 Case Study 1, Scenario 6 - CB 5B1 ATP Voltage to Ground Plot ... 185
LIST OF TABLES
Table 2-1 Assumed Z0 and Kc (Hileman 1999) ... 11
Table 2-2 A0 and A1 V-I Characteristics (Abdulwadood 2013) ... 27
Table 2-3 Surge Arrester Model Errors using 20kA 8/20s surge ... 28
Table 2-4 Protection Level and Rolling Sphere Radius (AS1768 2007) ... 35
Table 2-5 Minimum 66kV Conductor Clearances to Ground ... 37
Table 4-1 Feeder 840/3 and 840/4 Span Lengths... 50
Table 4-2 66kV Phase Conductor Physical Properties ... 50
Table 4-3 66kV Phase Conductor Electrical Properties ... 51
Table 4-4 Overhead Earth Wire Shielding Angles (Darveniza 2006) ... 52
Table 4-5 66kV OPGW Conductor Physical Properties ... 53
Table 4-6 66kV OPGW Conductor Electrical Properties ... 53
Table 4-7 Case Study 1 - Insulator Properties ... 54
Table 4-8 Case Study 2 - Insulator Properties (Preformed Line Products 2014) ... 54
Table 4-9 66kV Minimum Electrical Clearances... 55
Table 4-10 66kV Zone Substation Post Insulators (AK Power Solutions PTY LTD 2012) ... 56
Table 4-11 66kV Zone Substation Primary Conductor Physical Characteristics ... 57
Table 4-12 66kV Zone Substation Primary Conductor Electrical Characteristics ... 57
Table 4-13 Zone Substation Effectively Earthed Calculations ... 58
Table 4-14 Essential Energy Period Contract 66kV Surge Arresters ... 61
Table 4-15 Period Contract Surge Arrester Specifications (Siemens 2011), (Tyco Electronics 2001) ... 61
Table 5-1 Conductor Positive and Zero Sequence Values ... 63
Table 6-1 Case Study 1, Validation - Comparison of Simulated and Calculated Voltages to Ground ... 69
Table 6-2 Case Study 1, Validation - Comparison of Simulated and Calculated Surge Voltages .. 69
Table 6-3 Case Study 2, Validation - Comparison of Simulated and Calculated Voltages to Ground ... 72
Table 6-4 Case Study 2, Validation - Comparison of Simulated and Calculated Surge Voltages .. 72
Table 7-1 Case Study 1, Scenario 1 – ATP Results ... 78
Table 7-2 Case Study 1, Scenario 2 – ATP Results ... 82
Table 7-3 Case Study 1, Scenario 3 – ATP Results ... 85
Table 7-4 Case Study 1, Scenario 4a – ATP Results ... 88
Table 7-5 Case Study 1, Scenario 4b – ATP Results ... 91
Table 7-6 Case Study 1, Scenario 4c – 1 m, 2.5 m & 5 m ATP Results ... 94
Table 7-7 Case Study 1, Scenario 4c – 10 m, 15 m & 30 m ATP Results ... 94
Table 7-8 Case Study 1, Scenario 4d – 1 m, 2.5 m & 5 m ATP Results ... 97
Table 7-9 Case Study 1, Scenario 4d – 10 m, 15 m & 30 m ATP Results ... 97
Table 7-10 Case Study 1, Scenario 4e – ATP Results ... 100
Table 7-11 Case Study 1, Scenario 4f – 1 m, 2.5 m & 5 m ATP Results ... 102
Table 7-13 Case Study 1, Scenario 6 - Surge Arrester Manufacturer Data ... 109
Table 7-14 Case Study 1, Scenario 6 – Calculated Results ... 109
Table 7-15 Case Study 1, Scenario 7 – Calculated Results ... 113
Table 7-16 Case Study 2, Scenario 1 – Calculated Results ... 116
Table 7-17 Case Study 2, Scenario 2 – Calculated Results ... 119
Table 7-18 Case Study 2, Scenario 3 – Calculated Results ... 122
Table 17-1 Case Study 1 ATP Conductor Data ... 151
Table 17-2 Case Study 1 Validation, ATP Component Data Part 1 ... 152
Table 17-3 Case Study 1 Validation, ATP Component Data Part 2 ... 153
Table 17-4 Case Study 1 Scenario 1, ATP Component Data Part 1 ... 154
Table 17-5 Case Study 1 scenario 1, ATP Component Data Part 2 ... 155
Table 17-6 Case Study 2 ATP Conductor Data ... 156
Table 17-7 Case Study 2 Validation, ATP Component Data ... 157
Table 17-8 Case Study 2 Scenario 1, ATP Component Data ... 158
Table 18-1 Case Study 1 Conductor Sequence Component Attributes ... 159
GLOSSARY OF TERMS
AAAC All Aluminium Alloy Conductor AER Australian Energy Regulator
AS Australian Standard
ATP Alternative Transients Program BFR Back Flash Rate
Bi Bismuth
BIL Basic Insulation Level BSL Basic Switching Level CCT Covered Conductor Thick
CDEGS Current Distribution Electromagnetic fields Grounding and Soil structure analysis
CFO Critical Flashover Co Cobalt
EE Essential Energy
EMTP Electromagnetic Transients Program EPR Earth Potential Rise
FFT Fast Fourier Transform
fr The rated frequency of the power network. FRP Fibre Reinforced Plastic
HV High Voltage
HDBC Hard Drawn Bare Copper
IEEE Institute of Electrical and Electronic Engineers LIPL Lightning Impulse Protective Level
LIWL Lightning Impulse Withstand Level Mn Manganese
MO Metal Oxide
MTBF Mean Time Between Failure MTBS Mean Time Between Surge
NSR Non Self Restoring Insulation OHEW Overhead Earth Wire
OPGW Overhead Pilot Ground Wire Sb Antimony
SiC Silicon Carbide
SR Self Restoring Insulation u Power Frequency Voltage
Uc Continuous Operating Voltage
NOMENCLATURE
Aluminium Flange The base on which the arrester housing is secured. Mounting holes in the flange allow the arrester to be fixed to an appropriately designed structure.
Arrester disconnector test Applicable to surge arresters fitted with
disconnectors.
Arrester Housing Porcelain housings may be either quartz or alumina porcelain. Higher mechanical strength may be achieved with the latter. The housing is designed with sheds to ensure the creepage distance between the active terminal and the base is adequate.
Back Flash Rate The product of flashover probability and the number of strokes terminating on the OHEW (or OPGW).
Capacitive Coupling Voltages between long lines that are isolated from earth, and nearby clouds may rise to damaging levels due to capacitance between them.
Cement Joint Sulphur cement provides superior mechanical properties over Portland cement typically used in insulator construction. Modern techniques allow for cement joints stronger than porcelain housings.
Compression spring A brace for the column of MO resistors, metallic spacers, supporting rods and holding plates.
Conductive Coupling (Refer to Residual Voltage)
Continuous Operating Voltage The voltage that the arrester may be operated at continuously, without any restrictions. Uc > u
Effectively Earthed Where the ratio of zero sequence reactance to positive sequence reactance (X0/X1) is greater than zero and less than three, and, the ratio of zero sequence resistance to positive sequence reactance (R0/X1) is greater than zero and less than one.
External Insulation The insulation component of equipment that is in direct contact with the surrounding atmosphere. For example porcelain bushing.
Holding Plate Manufactured from FRP, the holding rods provide additional mechanical strength to the supporting rods, limiting sagging.
into nearby conductors intersecting the magnetic field
Inductive Voltage Drops The inductive characteristics of the conductor between the line, surge arrester and the earth result in significant voltage drops. Lead length plays a significant part in the magnitude of this voltage. Example: With an inductance of 1μH/m and a lightning current impulse of 10kA / μs:
u=L*di dt=10μH*10kA/μs = 100kV (Hinrichsen 2012)
Insulation withstand test Determines the surge arrester housings ability to withstands voltage stresses in both wet and dry conditions.
Internal Insulation The insulation component of equipment which is not in contact with the surrounding atmosphere. For example transformer insulating oil.
Lightning Flash Density The number of lightning flashes across an area, over a time period (AS1768-2007)
Lightning Impulse Protective
Level (Refer to Residual Voltage)
Lightning Impulse Withstand Level
For non-restoring type arresters, this is the maximum (test) voltage the arrester may experience. This voltage level should never be reached in operation although inductive voltage drops, travelling waves and excessive discharge currents may cause a voltage greater than LIWL to be experienced.
Lightning Protection System A system used to reduce the probability of danger from direct lightning strikes (AS1768-2007)
Long duration current impulse
withstand test Determines the resistive surge arrester elements ability to withstand dielectric and energy stresses without experiencing flashover.
Mean Time Between Failure The probability of a surge exceeding a determined level which would result in equipment failure
Mean Time Between Surge The reciprocal of the number of surges used in the determination of BFR.
Metallic Spacers Predominantly aluminium tubes with end covers designed to ensure even contact pressure with the MO resistor.
Multi column arrester current distribution test
Determines the current flowing through each column of parallel resistors.
Non Self Restoring Insulation Internal insulation which does not contain the ability to recover after a flashover has occurred.
Operating duty test Determines the surge arresters thermal ability when exposed to pre-defined conditions.
Partial discharge test Determines partial discharge measured within the surge arrester.
Power Flow Current The current which continues to flow following the discharge of the arrester.
Power Frequency Voltage The highest phase-to-earth voltage of the system.
Pressure relief test Applicable to surge arrester fitted with pressure relief devices, determines the arresters ability to withstand short circuit conditions without failure to the housing.
Rated Voltage The highest voltage the arrester may temporarily handle. The ratio between Uc & Ur is generally 1.25.
Residual Voltage The voltage dropped across the surge arrester terminals when nominal discharge current flows through the arrester.
Residual voltage test Determines the protective levels of the surge arrester.
Resistive Coupling A cloud to ground lightning strike raises the earth potential of all bonded equipment and conductors. Separately earthed equipment may still be subjected to resistively coupled transients when separated by short distances
Seal test Determines the integrity of the surge arrester seals.
Sealing Ring and Pressure Relief Diaphragm
Appearing at both the top and bottom of the arrester, these integral components deter water ingress, provide a mechanism for pressure relief allow the build-up of high-pressure gasses before failure of the housing is reached and maintain an electrical path through to the MO resister column.
Single Impulse Energy Handling Capability
The ability of the arrester to withstand the initial energy causing initial sudden temperature rises. The arrester will experience mechanical tensile and compressive forces that may cause physical damage such as cracking or shattering of porcelain type units.
Supporting Rods Surrounding cage manufactured from FRP for the MO resister blocks.
Thermal Energy Handling Capability
The maximum energy an arrester can handle and return to normal operating temperature.
Venting Outlet Mechanism within an arrester to allow the venting of pressurised hot gasses.
INTRODUCTION
Essential Energy is a NSW state owned corporation that owns and operates the electricity network supplying power to over 800,000 residences and businesses across 95% of the state. The network consists of approximately 350 zone substations at operating voltages ranging from 132kV to 11kV (Essential Energy 2015a). When construction work is to be undertaken at any one of these sites or when a new substation is required, standard design practices and templates have been created. Delivering consistent, safe and cost effective designs through the use of templates ensures conformance to relevant Australian standards, corporate guidelines, policies and procedures.
Figure 1-1 Essential Energy Regional Area (Essential Energy 2015b)
Background
To date, there has been no recorded investigation by Essential Energy into the operational performance of surge arresters installed within their zone substations. Additionally, no consistent approach towards the assessment on surge arrester performance arising from modifications to electrical connections or equipment positions within the zone substation exists. This effectively leads to uncertainty, and excessive safety margins are factored into the template designs in an attempt to mitigate any increased risk of damage, loss of supply or injury to people. Such increased safety margins have the tendency to add unnecessary costs to projects, without quantifiable or measurable benefits.
The majority of studies into the performance of electrical networks during overvoltage events such as lightning or switching surges have been undertaken using software such as EMTP/ATP. This project presents an opportunity to investigate the viability of using the existing Essential Energy corporate approved software package known as Current Distribution Electromagnetic fields Grounding and Soil structure analysis (CDEGS) to determine if overvoltages are present within zone substations during the transient. Such suitability would present significant cost savings to the business, reduce staff training requirements applicable to new software and present an alternative simulation method for engineers within the industry.
Research Objectives
There are Four main objectives to this research.
The first objective is to adopt a suitable computer software package to complete the network modelling and lightning simulation. Research into frequency domain (CDEGS) and time domain (ATP) methods shall be undertaken to make this determination.
The second objective is to determine:
a) The effectiveness of the existing surge arrester protective zones whilst maintaining the surge arresters in their present locations.
b) What impacts the surge arrester location and connection methods have in maintaining overvoltage levels below equipment BIL ratings when subjected lightning surges.
The third objective shall identify any improvements to zone substation designs that may be achieved through changes to Essential Energy’s contract surge arrester specification.
LITERATURE REVIEW
Introduction
This chapter aims to:
a) Describe the various transient overvoltages that result in disturbances to electrical networks.
b) Distinguish between the various types of lightning and the properties relating to each, to allow an accurate representation during the computer simulation. c) Document the history of surge arrester technology and research the electrical and
physical characteristics of surge arresters influencing their operation during both real world and computer-simulated events.
d) Identify the differences between surge arrester classes and establish the influence the surge arrester protective zone has on the equipment.
e) Introduce insulation co-ordination and the factors affecting performance of equipment insulation.
f) Provide background into relevant Australian standards relating to both surge arresters, and the design of zone substations and transmission lines they are installed to protect.
g) Determine a suitable computer program to perform the simulation of the network
Surge Voltages
2.2.1 Lightning Overvoltages
Overvoltages resulting from a lightning strike pose the greatest risk of damage to substation equipment reaching a peak value over 100 times the nominal line voltage within microseconds (Hinrichsen 2012). The lightning overvoltage may arise due to either backflash or shielding failure with each resulting in slightly differing wave fronts. Such waveshape variations are a result of a number of key factors such as magnitude, polarity and shape of the lightning stroke current, line and tower surge impedances, tower footing impedance and the critical flashover rating of the line insulation (IEEE 1998).
There are two scenarios by which a lightning overvoltage may be inflicted upon the High Voltage (HV) electricity network. The first, and most damaging, is through a direct strike to the network infrastructure. The second, less severe surge, is when an adjacent strike is conducted onto the equipment through the ground.
Lightning overvoltages are transient in nature and are also referred to as fast front transients covering a frequency range 10kHz to 1MHz (Imece et al. 1996). Waveshapes generally consist of a steep front and a long decaying tail. The unpredictability and random nature exhibited by lightning results in many variations to the overvoltage waveshape. AS1768-2007 details the most common waveshapes to represent transients are the 1.2/50s voltage and the 8/20s current waveforms.
2.2.2 Switching Overvoltages
There are a number of factors that may initiate a switching overvoltage of up to double the nominal line voltage. These high magnitude events pose a risk to insulation breakdown of equipment and include:
a) Circuit breaker operation to clear network faults
b) Switching of HV capacitor banks
2.2.3 Temporary Overvoltages
Lasting for short durations in the order of tenth of seconds, through to a number of hours, temporary overvoltages may occur due to earth connection faults, energisation of unloaded lines, resonance or during load rejection. The system temporary overvoltage rating must be equal to or less than that of the surge arrester (Hileman 1999).
2.2.4 Travelling Wave
A transient disturbance to an overhead transmission line, such as lightning or switching surge will propagate throughout the electrical network in the form of a travelling (or incident) wave. The velocity at which the wave travels is proportional to the impedance of the conductor and is inversely proportional to the permittivity of the medium.
2.2.4.1 Reflection and Transmission of Travelling Waves
The incident wave may approach a junction within the network that appears as either open circuit, short circuit or a change in surge impedance. In each of these cases a fraction of the incident wave is either reflected back toward the source, or transmitted through to the adjacent section of line. The reflection and transmission factors of the incident wave are defined in section 2.2.4.2.
2.2.4.2 Bewley Lattice Diagram
Figure 2-1 Bewley Lattice diagram
Where transmission factors:
Φ = ( − )/( + ) 2-1
β = 2( )/( + ) 2-2
ω = 2 /( + ) 2-3
and reflection factors:
δ = 2( )/( + ) 2-4
γ = ( − )/( + ) 2-5
α = ( − )/( + ) 2-6
2.2.5 Surge Impedance and Velocity
The speed at which the voltage and current travelling waves propagates due to a transient event (such as lightning or switching overvoltages) is proportional to the cable or conductors surge impedance. The surge impedance is purely resistive meaning the voltage and current waveforms have the same shape.
The surge impedance and velocity is described within may be derived from the line inductance and capacitance as follows:
δ Φ
e γ β α ω
R
Z1 Z2
TIME e
0
βe
γe ωβe
αβe τ1
Φαβe
δαβe ωΦαβe
Φα2βe
τ2
Φ2α2βe
δΦα2βe ωΦ2α2βe
Φ2α3βe
τ3
Surge Impedance:
Z = √ ∗ Ω 2-7
v = 1/√ ∗ / 2-8
Where:
is the inductance measured in H/m.
is the capacitance measured in F/m.
2.2.5.1 Overhead Lines
The inductance and capacitance of overhead conductors may be defined as:
L = (2 ∗ 10 ) ∗ ln (2ℎ/ ) μH/m 2-9
= (10 /18) ∗ ln (2ℎ/ ) μF/m 2-10
Where:
h is the conductor height above the ground measured in m.
r is the radius of the conductor measured in m.
The surge impedance and velocity therefore equates to:
= 60 ∗ ln (2ℎ/ ) Ω 2-11
v = 300 / ( ℎ ) 2-12
2.2.5.2 Cables
The permittivity of the cables insulation medium significantly influences the resultant surge impedance and velocity. The inductance and capacitance of cable may be defined as:
L = (2 ∗ 10 ) ∗ ln ( / )/√ μH/m 2-13
Where:
r1 is the radius of the current carrying conductors measured in m.
r2 is the radius of the outside cable insulation measured in m.
is permittivity of the medium which varies from 2.4 to 4.
The surge impedance and velocity therefore equates to:
= 60/√ ∗ ln (2ℎ/ ) Ω 2-15
v = 300/√ / 2-16
2.2.6 Sequence Components
In normal (steady state) operation, an electrical power system operates in a balanced state. During a transient event such as lightning strike, the system becomes unbalanced and the displacement between each phase is no longer equal.
Figure 2-2 Balanced and Unbalance System (Marx & Bender 2013)
The method to solve unbalanced systems is by means of transforming the three phase voltages or currents into three sets of balanced vectors also referred to as positive, negative and zero sequence components (Figure 2-3).
The complex operator ‘a’ is often utilised in the definition of symmetrical components and represents a unit phasor with a magnitude of 1 and an angle of 120°. The relationship between phase and sequence components is therefore:
E = E + E + E 2-17
E = E + E + E = E + E + E 2-18
E = E + E + E = E + E + E 2-19
E =1
3(E + E + E ) 2-20
E =1
3(E + E + E ) 2-21
E =1
3(E + E + E ) 2-22
Positive (Z1) and negative (Z2) sequence impedances are equal in power system components such as transformers and overhead lines. For rotating machines they are
different. Zero sequence (Z0) impedance value may vary significantly depending on the
physical arrangement of the circuit (Electrical4u 2011).
A lightning strike to overhead conductors is essentially either a phase to earth fault, or in some instances a double phase to earth fault. The equations to calculate sequence currents for earth faults are as follows:
Phase to Earth Fault Current (Electrical4u 2011)
I = = (
+ + ) 2-23
Double Phase to Earth Fault Current (Electrical4u 2011)
I =
(Z + + ) 2-24
I = I (
+ ) 2-25
I = I (
2.2.7 Steepness of Incoming Surge
The steepness of the incoming surge refers to the rate at which the surge reaches the peak or crest value.
Two different methods for deriving the steepness of the incoming surge have been presented:
= / 2-27
(Hileman 1999)
= 1/((1/ ) + ∗ / 2-28
(ABB high voltage technologies 1999)
Where:
is the co-ordination factor.
is the initial surge steepness.
is the incoming line length
Hileman’s method uses assumed surge impedance values as shown in Table 2-1 for (expressed in pF/kV-m) and calculates the length of the incoming line using the following:
= 1/( ∗ ) + 2-29
Where:
is the backflash rate measured in flashovers/100km-years.
is the mean time between failures measured in years.
is an additional length added to align with the designed span length measured in km.
Table 2-1 Assumed Z0 and Kc (Hileman 1999)
ABB approximates the value for as 5 ∗ 10 s/kV-m and requires the incoming
length of the line to be expressed in meters. No. of
conductors
Z0 (Assumed)
Kc (Suggested)
1 450 700
2 350 1000
3 or 4 320 1700
Lightning
There are around 2000 thunderstorms occurring simultaneously across the globe. This equates to an estimated 100 lightning flashes to ground every second, or 8 million per day (Hileman 1999). Despite this, the likelihood of a fatality due to being struck by lightning is in the order of 1 in 2,000,000 (AS1768 2007).
Average lightning density throughout Australia is highest across the northern coast of Western Australia and Northern Territory with 12 flashes per km2, per year. In contrast, the New South Wales maximum is between 3 and 4 flashes per km2, per year, coincidently located within Essential Energy’s franchise area.
Electrical infrastructure is more susceptible to lightning strikes, which, when subjected to a lightning strike, results in a sudden disturbance to the system. Such transient events are akin to “closing a big switch” (Abdulwadood 2013) between the power line and a current source.
2.3.1 Lightning Process
As warm air close to the earth’s surface rises into the atmosphere a resulting cloud formation develops with regions of positive and negatively charged particles. With the positive charged particles residing at the top of the cloud, and the negative charged particles at the bottom, both charges continue to increases until the air gap breaks down and a subsequent lightning strike develops.
The formation of a lightning strike may be categorized into two stages. The first stage begins with what is known as the stepped leader. Progressing slowly from the cloud towards the earth in intermittent steps of around 50m, this leader is not visible to the naked eye and contains comparatively small current between 50-200 amperes. The final stage involves an upward leader meeting the stepped downward leader resulting in the visible flash. Shockwaves produced as a result of the rapid rise of temperature in the upward leader (exceeding 25,000 degrees Celsius). The upward leader typically averages 5-6km in length and may discharge hundreds of thousands of amps. The extreme temperature rise as a result of this discharge current produces shockwaves that is heard as thunder. It is common for subsequent strikes to follow with the average being three per flash. Typically, the first strike is higher in magnitude than subsequent strokes.
2.3.2 Lightning Categories
Intra-cloud, cloud to cloud, and cloud to ground, are three common categories of lightning.
2.3.2.1 Intra-Cloud Lightning
Intra-cloud lighting, or IC lightning, is the most common category of lightning. The lightning discharge occurs between areas of differing potential within a single cloud with the corresponding lightning flash illuminating the night sky with a “sheet” of light, thus leading to intra-cloud lightning commonly referred to as sheet lightning.
2.3.2.2 Cloud to Cloud Lightning
The least common category of lightning is cloud-to-cloud or CC lightning. It occurs when there is an electrical discharge between two or more individual clouds.
2.3.2.3 Cloud to Ground Lightning
It wasn’t until 1975, when Karl Berger undertook a study to record the parameters of lightning strokes. The data was analysed and initially, three types of lightning strokes were discovered; negative downward, negative upward and positive downward. A fourth type, positive upward was identified after Berger’s initial study (Hileman 1999).
2.3.2.4 Negative Downward Stroke
Exhibiting a high median current value of around 33kA, the negative downward flash has been recorded as the most predominant type of lightning stroke, accounting for approximately 85-95% of flashes to structures less than 100m (Berger, Anderson & Kroninger 1975).
2.3.2.5 Negative Upward Stroke
More frequently observed with taller structures. In 1975, Berger found the negative upward stroke to have contributed to approximately 75% of the 1196 recorded lightning strikes upon both 70m and 80m masts installed at the summit of the 650m Mt San Salvadore in Switzerland. A lower median current value of less than 25kA is typical for this type of stroke (Berger, Anderson & Kroninger 1975).
2.3.2.6 Positive Upward Stroke
Known also as a “Super Flash”, the positive upward stroke exhibits current magnitudes approximately 1.2 to 2.2 times those found during a negative downward stroke. More prolific during the winter season, and found over oceans, positive upward strokes generally exhibit a greater time from crest to half value (Berger, Anderson & Kroninger 1975).
2.3.2.7 Positive Downward stroke
Figure 2-5 Lightning Strokes (a) Negative Downward (b) Positive Downward (c) Positive Upward (d) Negative Upward (Heidler et al. 2008)
2.3.3 Back Flashover
When lightning strikes the overhead earth wire, the discharge current flows through to earth, during which a voltage builds up across the line insulation. At the point this voltage exceeds (or equals) the line’s critical flash over voltage, back flashover will occur (Hileman 1999).
2.3.4 Direct Lightning Strike
A direct lightning strike onto electrical equipment or overhead conductors will conduct to earth through the lightning protection system, or along any other metallic path, often resulting in unpredictable back flashovers (Thompson 2008). For 66kV systems, significant overvoltages are produced only by direct strikes (AS1824.2 1985). Such overvoltages may occur between the conductor and ground (VCG) and conductor to conductor (VCC).
The maximum overvoltages may be calculated by (Darveniza 2006):
= 0.5( ) 2-30
And
= 0.5( )(1 − ) 2-31
Where:
is the surge impedance.
is the peak lightning current.
2.3.5 Indirect Lightning Strike
Transient overvoltages induced onto adjacent or nearby conductors may result from resistive, inductive and capacitive coupling (Thompson 2008).
The maximum induced voltage may be expressed as (Darveniza 2006):
= ∗ ∗ ∗ (ℎ + 0.15 )/ 2-32
Where:
is the surge impedance.
is the return stroke velocity factor.
is the peak lightning current.
is the ground resistivity.
is the distance from the line.
ℎ is the height of the line.
It is universally agreed that induced overvoltages above 200kV are rare (Darveniza 2006), and as such would be of concern only to overhead lines and equipment less than 33kV.
2.3.6 Lightning Parameters
The geography across Essential Energy’s network varies from low lying coastal areas to mountainous regions above 1000m. Positive strokes have been discounted from this study on the basis that they are predominantly found over oceans, during winter and at the beginning and end of storms (Hileman 1999). Of the remaining negative polarity strokes, negative downward type is chosen due the higher median discharge current and the proven higher likelihood for striking structures less than 100m in height (typical of substation equipment).
2.3.6.1 Crest Current
Published lightning currents across Australia were not widely available. A more accurate representation of peak lightning current in south-eastern Australia is proposed. Reviewing Kuleshov (2012) identified a positive relationship between rainfall and cloud to ground lightning, with lightning activity across south-eastern Australia to be most prevalent between the six months from October to March.
Figure 2-6 Seasonal Distribution of Monthly Mean Thunderstorm Days – Melbourne (Kuleshov 2012)
To derive a lightning magnitude value which represents an average of what would be expected across Essential Energy’s network area, data on all recorded negative polarity, cloud to ground lightning strikes within an 800km radius of the regional city of Dubbo New South Wales, between October 2015 and March 2016 was obtained using Essential Energy’s licence from Weather Zone online. The regional city of Dubbo was chosen as the location due to the geographical proximity to the centre of New South Wales, and ensured Essential Energy’s entire network was captured.
Figure 2-7 Lightning Capture Area (Google Earth 2013a)
M
ea
n
T
hu
nd
er
st
or
m
D
ay
The results found a total of 2,670,262 negative polarity cloud to ground strikes were recorded. The maximum magnitude was recorded at -383.5 kA, whilst the minimum was -0.1 kA. The average (mean) magnitude was calculated at -13.7 kA. This value shall be rounded to -14 kA for inclusion in simulations. Figure 2-8 below provides a probability density plot of the recorded lightning magnitudes from 0 kA to -46.5 kA (3 standard deviations from the mean).
Figure 2-8 Negative Polarity Lightning Magnitude Probability Density Plot
2.3.6.2 Current Waveshape
As shown in Figure 2-9, the industry accepted lightning current waveshape is represented by the 8/20s curve (AS1768 2007). This curve represents the lightning current
increasing from 10% to 90% of its peak (crest) value in 8s, and decaying to 50% of the
crest value after 20s.
2.3.6.3 Voltage Waveshape
As shown in Figure 2-10, the industry accepted lightning voltage waveshape is represented by the 1.2/50s curve (AS1768 2007). This curve represents the lightning
voltage increasing from 30% to 90% of its peak (crest) value in 1.2s, and then decaying to 50% of the crest value after 50s.
Figure 2-10 Open-Circuit Voltage Waveshape (AS1768 2007)
2.3.6.4 Number of Strokes per Flash
For positive lightning strokes, it is uncommon for more than a single stroke per flash (Hileman 1999). For negative polarity lightning strokes, Anderson and Eriksson (1980) have deduced from Berger’s initial study that the average number of strokes is three. The time between each strike is between 40 to 50ms (Uman 1986)
2.3.6.5 Flash Incidence
History of Surge Arresters
The first surge arresters (also known as lightning arresters) were developed over 100 years ago. They included a simple air gap between the line and the ground and provided excellent lightning protection, but could not clear power follow current without a large enough linear resistance connected in series (Sakshaug 1991). A surge arrester or fuse was therefore needed to break this current.
From the early 1900’s through till around 1930, the first ‘non-linear resister’ type arrester was used. It comprised of an array of aluminium cells (inverted cones), each rated at 300V, separated by approximately 0.3 inches of electrolyte and placed in a tank of oil, which is connected in series to a sphere or horn gap (Sakshaug 1991). This type of arrester was very large, and required continual maintenance, but exhibited good current limitation properties.
Prior to the superseding of aluminium cell type arresters, 1920 to 1930 saw ‘Oxide Film Arresters’ introduced, with a modified version remaining in service until approximately 1954. An array of cells that contained lead peroxide and coated in an insulating film made up the internals of the arrester. Once subjected to a voltage surge, the resistance lowered allowing current to flow. This type of arrester allowed for many operations to be performed before reduction of the performance characteristics was experienced. Unlike the nonlinear resister type arresters of the early 1900’s, the ability to handle power follow currents was achieved with the oxide film arrester (Sakshaug 1991).
The introduction of SiC arresters in 1954 heralded a major improvement in arrester design. Improvements to heating and erosion characteristics resulted in a reduction to the BIL of substation equipment protected by the arrester. The use of a porous gap plate material resulted in an arrester that was capable of withstanding high fault current (Sakshaug 1991) and significant reductions in the size of the arresters led to further economic benefits.
Surge Arrester Design
There are a number of basic parameters that influence the design and operation of metal oxide surge arresters. Split into two categories, Electrical and Construction, they are listed below:
2.5.1 Electrical Characteristics
Defined by Australian Standards AS1842.1-1995 and AS1307.2-1996, key characteristics include:
a. Power Frequency Voltage (u)
b. Continuous Operating Voltage (Uc) Note: Uc > u c. Rated Voltage (Ut)
d. Rated Frequency (fr)
e. Lightning Impulse Protective Level (Uref)
f. Lightning Impulse Withstand Level (LIWL)
g. Single Impulse Energy Handling Capability
h. Thermal Energy Handling Capability
2.5.2 Construction Characteristics
The construction of MO surge arresters has been simplified significantly since the silicon carbide types used prior to the mid 1970’s. Modern surge arresters tend to be of either porcelain or polymer construction.
The active components of both porcelain and polymer arresters operate in a similar fashion. The main difference is in the outer housing. The silicone rubber housing of polymer type surge arresters exhibit much improved hydrophobicity (Hinrichsen 2012). Suppression of contaminants forming a conductive path along the outer sheds is greatly reduced. Porcelain housed surge arresters are prone to explosive damage. In the event of failure to the outer housing, polymer surge arresters reduce the risk of damage to nearby equipment and injury to persons in close proximity.
2.5.2.1 Porcelain Construction
Components include:
a. Metallic Spacers
b. MO Resistor Column
c. Supporting Rods
d. Holding Plate
e. Compression spring
f. Cement Joint
g. Arrester Housing
h. Sealing Ring
i. Pressure Relief Diaphragm
j. Venting Outlet
k. Aluminium Flange
2.5.2.2 Polymer Construction
Key components include:
a. End Fitting
b. Outer housing
c. Metal Oxide resister stack
d. Fibre reinforced plastic support rods.
2.5.3 Energy Handling Capability
The energy handling capability of surge arresters are related to the line discharge class of the arrester. There are five line discharge classes defined with AS1307.2-1996. Figure 2-13 shows the energy handling of each line discharge against the ratio of switching impulse to rated voltage of the arrester.
Figure 2-11 Porcelain MO arrester cross section (Hinrichsen 2012)
Figure 2-13 Surge Arrester Line Discharge Class (AS1307.2 1996)
2.5.4 Surge Arrester Models
The application of accurate surge arrester models is dependent on the chosen software package. For common software such as ATP/EMTP and Matlab, there are numerous papers comparing the V-I characteristics and accuracy of surge arresters through simulated models. The IEEE, Pincetti-Gianettoni, Fernando-Diaz and the Alternative Transients Program (ATP) developed model are four of the more common types that have been included for comparison in this report.
The following surge arrester models are relevant only to programs which derive solutions using time domain methods (for example ATP).
2.5.4.1 IEEE Model
Developed by the IEEE WG 3.4.11, this surge arrester model is often known as the ‘conventional, or non-linear resistor’ model for MOV type surge arresters (Bayadi et al. 2003).
significant. Matching the dynamic characteristics of MOV type surge arresters, inductor L1 derives greater current through A0, and subsequently, a larger voltage across the arrester terminals. It is important to note that the value of L1 will require adjustment until measured voltages match manufacturers data.
For slow transients, the two resistances are in parallel simulating arrester behaviour during normal system operation. Additionally, R0 eliminates numerical oscillations, which may arise when using computer simulation, and C is the surge arrester external capacitance (Zadeh, Abniki & Akmal 2009).
Figure 2-14 IEEE ‘Conventional’ Model (Abdulwadood 2013)
L = 0.2 ∗ ( / ) 2-33
R = 100 ∗ ( / ) Ω 2-34
L = 15 ∗ ( / ) 2-35
R = 65 ∗ ( / ) Ω 2-36
C = 100 ∗ 2-37
Where:
d is the surge arrester height.
n is the number of parallel metal oxide columns within the surge arrester.
2.5.5 Pincetti-Gianettoni Model
Figure 2-15 Pincetti-Gianettoni Model (Abdulwadood 2013)
L = 1 12
/ − /
/ ∗
2-38
L =1 4
/ − /
/ ∗
2-39
R = 1 Ω 2-40
Where:
/ is the residual voltage at 10kA for a 1/2 s fast front current surge in kV.
/ is the residual voltage at 10kA for a 8/20 s fast front current surge in kV.
is the rated voltage.
2.5.6 Fernandez-Diaz Model
A variation of both IEEE and Pincetti-Gianettoni models, the Fernandez-Diaz model has been developed to simulate arrester characteristics when subjected to time to crest values 8s and greater (Bayadi et al. 2003). Two non-linear resistances designated by A0 and A1 are separated by a single inductance L1 whilst a single resistance R0, and capacitance C0 are connected across the arrester terminals. Again R0 is included to eliminate numerical oscillations when running computer simulations, and C is the surge arrester external capacitance (Christodoulou et al. 2008).
L =2 5
/ −
/ ∗
2-41
= 1 55
/ −
/ ∗
2-42
R = 1 Ω 2-43
Where:
is the residual voltage at 500A for a 60/2000 s current surge or 30/70 s in kV .
/ is the residual voltage at 10kA for a 1/2 s fast front current surge in kV.
/ is the residual voltage at 10kA for a 8/20 s fast front current surge
is the rated voltage in kV.
2.5.7 ATP Model
Utilised with computer software package ATP, the model consists of a number exponential, non-linear devices defined as:
= ( ) 2-44
(Meister, Shayani & de Oliveira 2011)
Where:
is a coefficient.
is the exponent defining the shape of the V-I characteristic.
is the residual voltage
is an arbitrary voltage to normalize the equation.
2.5.8 Model Parameters
The values for non-linear devices A0 and A1 have been derived from experiments conducted by the IEEE WG 3.4.11. Their non-linear characteristics are shown in Table 2-2.
Figure 2-17 A0 and A1 V-I Characteristics (Abdulwadood 2013)
Table 2-2 A0 and A1 V-I Characteristics (Abdulwadood 2013)
* The per unit voltage values are based on the 8.20 µs residual voltage of the arrester.
I (kA) V
* (p.u)
A0 A1
0.1 0.963 0.769
1 1.05 0.85
2 1.088 0.894
4 1.125 0.925
6 1.138 0.938
8 1.169 0.956
10 1.188 0.969
12 1.206 0.975
14 1.231 0.988
16 1.25 0.994
18 1.281 1
2.5.9 Model Accuracy
The recorded accuracy between the abovementioned surge arrester models is presented in Table 2-3. These results have been compared against measured results from actual surge arrester units within each respective reference.
Table 2-3 Surge Arrester Model Errors using 20kA 8/20s surge
I = 20kA (8/20s) IEEE Pincetti-Gianettoni
Fernandez-Diaz ATP
Zadeh, Abniki and Akmal
(2009) 6.21% 10.92% 0.008% -
Bayadi et al. (2003) 2.56% 2.89% 0.89% 0.56%
Christodoulou et al. (2008) 1.38% 0.87% 2.04% -
Meister, Shayani and de
Oliveira (2011) 0.84% 0.25% 1.6% 1.3%
Surge Arrester Operation
A typical lightning strike may consist of one or more lightning strikes (or discharge) over a period of up to 1/3 of a second (Woodworth 2008). Surge arresters do not operate any differently between any of the four types of lightning described in section 2.3.2.
The surge arrester limits the surge magnitude seen by the equipment by ‘dropping’ voltage across its terminal to ground. This is known as its lightning impulse protective level or arrester discharge voltage. Figure 2-18 has been adapted from ABB high voltage technologies (1999) and provides a simple diagram to show the voltage drop across the arrester (Ed) and the remaining voltage (Eeq) that will be seen by downstream equipment.
Where:
E is the crest voltage of the incoming surge.
v is the velocity of the incoming surge.
S is the steepness of the incoming surge.
A is the surge arrester.
la and lb are the connecting line lengths between the equipment and the surge arrester.
Ed is the voltage drop across the arrester.
Eeq is the overvoltage seen at the downstream equipment.
Figure 2-18 Simplified overvoltage diagram (ABB high voltage technologies 1999) E
v
A
Ed lb
la S
Insulation Co-ordination
2.7.1 Insulation Types
Insulation types may be classified as Internal or External, and be either self-restoring or non-self-restoring in nature.
2.7.2 Basic Lightning Impulse Insulation Level (BIL)
Insulation co-ordination is critical to the reliability, longevity and effective operation of zone substation equipment and overhead power lines. The BIL rating of equipment defines “the electrical strength of insulation expressed in terms of the crest value of a standard lightning impulse” (Hileman 1999). It is also referred to as the equipment’s Lightning Impulse Withstand Voltage. Effective co-ordination ensures the chosen surge arrester will adequately protect equipment. An example is shown in Figure 2-18 where if the overvol