Research Article
Research Difference of Strain Distribution and Microstructure
Evolution between Rolling Direction and Transverse Direction
of AM50 Mg Alloy Plate by Digital Image Correlation
Qiang Li,
1,2Fuan Hua,
3Jianping Li,
3and Hao Wang
21School of Material Sciences and Engineering, Shenyang University of Technology, No. 111 Shenliao Road, Shenyang 110780, China 2Center of Excellence in Engineered Fibre Composites, University of Southern Queensland, West Street, Toowoomba,
QLD 4350, Australia
3State Key Lab of Rolling & Automation, Northeastern University, Shenyang 110004, China
Correspondence should be addressed to Qiang Li; [email protected]
Received 27 June 2015; Accepted 3 November 2015
Academic Editor: Pavel Lejcek
Copyright © 2015 Qiang Li et al. This is an open access article distributed under the Creative Commons Attribution License, which permits unrestricted use, distribution, and reproduction in any medium, provided the original work is properly cited.
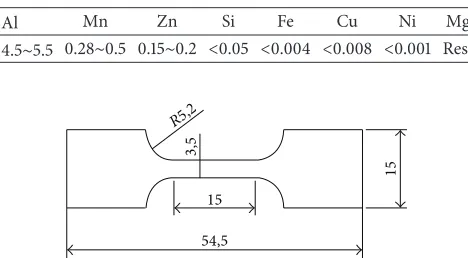
The rolling direction (RD) and transverse direction (TD) of AM50 Mg alloy plate were drawn by tensile test while Digital Image Correlation (DIC) was applied to record local strain distribution and evolution. Then, the microstructure in the maximum strain position was observed so as to find the reason causing the difference between RD and TD specimen. Finally, the fracture surface morphology of the broken specimen was observed by scanning electron microscope (SEM) to determine the crack types. Through the analysis, it is found that the critical failure equivalent strains in the RD specimen and TD specimen are 0.1675 and 0.118, respectively, and the maximum equivalent strain position is the crack source; more twinning is generated in the RD specimen than that of the TD specimen, which indicates that twinning plays an important role in affecting its plasticity. The fracture surface morphology indicates that the RD specimen fracture is quasi-cleavage fracture while the TD specimen shows character of cleavage fracture.
1. Introduction
Mg alloy, as the lightest structural metal, has been widely used in 3C (communication, computer, and consumer), transport, and aerospace industries [1, 2]. Due to hexagonal close packing-HCP crystal structure at room temperature, poor plastic forming ability limits Mg alloy application. To overcome the low plastic weakness, researchers had developed a series of wrought Mg alloys [2–4], such as AZ series, AM series, and WE series. Meanwhile, great effort had also been made to develop new forming technology, such as hot rolling, semisolid forming, and equal channel angle extruding method [3, 5–7], and the essence of these processes is to raise the deforming temperature or to refine the grain size to improve its deforming ability [2]. With attractive mechanical properties, AM50 was widely applied in automobile industry [8], but most of the research works on AM50 Mg alloy were focused on casting [2].
Currently, most of research works on Mg alloy plas-tic forming process are based on homogeneous assump-tion that all parts of specimen have the same properties [9]. The assumption neglects the anisotropic properties of grain that leads to the uneven strain distribution during deformation process [10]. In order to explain the uneven defamation mechanism, researchers had developed several crystal plasticity models, such as Sachs model, Taylors model, and self-consistent model to explain local strain distribu-tion according to mechanism of crystal plasticity [10–15], but all of these models have their shortcomings, such as assumption of continuous stress or continuous strain in different grains. Recently, some researchers adopted crystal plasticity finite element method to study the nonuniform distributed deformation in the microscale [16–18], which was helpful to quantitatively research local strain distribution. Meanwhile some adopted electron backscatter diffraction (EBSD) and orientation imaging microscopy (OIM) to view
15 15
54,5
Figure 1: The size of sheet type tensile specimen (unit is mm).
grain deformation and rotation during deformation process [19–21], but these experimental approaches are costly and can be only applied to a small domain with few grains, which limits this method to apply into macroscale. Compared with ESBD and OIM methods, Digital Image Correlation (DIC) is a low cost, high efficiency, and nondestructive method, and the method can be applied from microscale to macroscale, even in 3D [21, 22]. The basic theory of DIC for measuring the displacement and strain can be seen in [22, 23].
To date, some researchers also adopted rolling method to produce AM50 Mg alloy sheet [9, 24], and the research for rolling AM50 Mg alloy is helpful to develop a high efficient technology to produce AM50 Mg alloy plate, which can extend the application field of AM50 Mg alloy. When the critical strain of AM50 Mg alloy sheet is measured, the fab-rication process of AM50 Mg alloy sheet can be made more reasonably without destroying AM50 Mg alloy sheet. There-fore, the differences of plasticity between rolling direction (RD) and transverse direction specimens (TD) of AM50 Mg alloy plate are analyzed to determine the maximum critical failure strain in the specimens before the specimens break. Then, initial microstructure and the microstructure in the maximum strain position after deformation are compared. Finally, SEM is used to study the fracture morphology of RD and TD tensile specimen to determine the crack type and crack reason.
2. Experiments
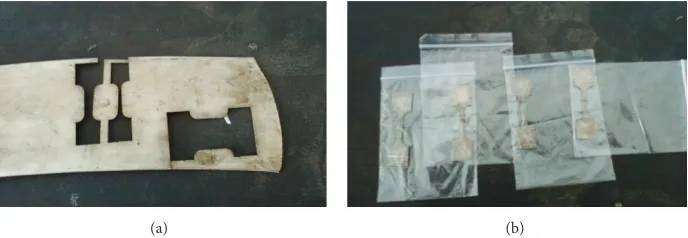
Experimental material adopts hot rolling AM50 Mg alloy plate, and the thickness of plate is reduced to 1 mm from ini-tial 8 mm by 6 cycles of hot rolling reduction. The hot rolling temperature is selected as 320∘C. Its chemical composition is listed in Table 1. The geometry of specimen is shown in Figure 1. Both the RD and the TD specimens are taken from an AM50 Mg alloy plate as shown in Figure 2.
After the tensile specimen is machined by wire-electrode cutting, the surface of specimens will be polished firstly to get rid of the pollutants. And then black paint is sprayed on one side of the specimen surface uniformly with fine speckles. When the black paint dries, white paint is sprayed on the black painted layer uniformly so that each black and white
tensile testing. The time interval for taking image is set as 0.05 s, which means 20 pieces of image per second.
When the tensile test specimen breaks, the position of maximum equivalent strain will be polished and etched by using 2 g oxalic acid in 100 mL water. Optical microstructure observation is carried out in Zeiss optimal microscope and fracture surface morphology is observed by Hitachi S-3400N scanning electron microscope (SEM). Microstructure in the maximum equivalent strain position is compared with the original microstructure before deformation.
3. Results and Discussion
3.1. Strain Distribution of the RD Specimen. Figure 3 shows
the 𝑦-direction strain distribution in the RD specimen at 5 s, 25 s, and 35 s, in which 𝑦-direction strain is parallel to the elongation direction, and the different color in each figure stands for the different𝑦-direction strain𝜀𝑦. In this paper, 𝑦-direction strain is defined as strain along with loading direction, and𝑥-direction strain is defined as strain perpendicular to loading direction. At 5 s (Figure 3(a)) the maximum and the minimum𝑦-direction strain are 0.0196 (marked in𝐴zone) and 0.0038 in the left top and the bottom part of the specimen, respectively. The difference between the maximum and minimum 𝑦-direction strain is 0.0158. When time is 25 s, as shown in Figure 3(b), the maximum𝑦 -direction strain rises up to 0.117 (marked in𝐵zone) five times higher than that in Figure 3(a) the minimum 𝑦-direction strain is 0.0435. The difference between the maximum and the minimum𝑦-direction strain reaches 0.0735, which indicates that the𝑦-direction strain distribution is more uneven and some local region bears higher strain and the other region bears lower strain. In addition, from 5 s to 25 s, the maximum
𝑦-strain position transfers from𝐴to𝐵position gradually. At 35 s, the maximum𝑦-direction strain reaches 0.206, which is 10 times higher than that at 5 s. Figure 3 also shows the maximum𝑦-direction strain position gradually moving from marked𝐴in the top side of the specimen to marked𝐵in the bottom side of specimen and finally breaks in the marked𝐵 position. According to the preset loading rate 3 mm/min, the averaged strain at 35 s is𝜀 = (3 ∗ 35/60)/15 = 0.1167much lower than the maximum𝑦-direction strain 0.206 at 35 s.
Neglecting thickness changing during tensile process, the specimen deformation can be regarded as plain deformation that the equivalent strain can be calculated as
𝜀 = √2
3 √𝜀2𝑥+ 𝜀𝑦2+ (𝜀𝑥− 𝜀𝑦)2+ 6𝛾𝑥𝑦2 , (1)
[image:2.600.52.286.86.215.2](a) (b)
Figure 2: The tensile test specimens in AM50 Mg alloy plate. (a) Position of AM50 Mg alloy specimens, (b) specimens of the RD and the TD.
Ey
y [1]-lagra
ng
e
0.0196 0.0186125 0.017625 0.0166375 0.01565 0.0146625 0.013675 0.0126875 0.0117 0.0107125 0.009725 0.0087375 0.00775 0.0067625 0.005775 0.0047875 0.0038
A
(a)
Ey
y [1]-lagra
ng
e
0.117 0.112406 0.107813 0.103219 0.098625 0.0940313 0.0894375 0.0848437 0.08025 0.0756563 0.0710625 0.0664687 0.061875 0.0572812 0.0526875 0.0480937 0.0435
B
(b)
Ey
y [1]-lagra
ng
e
0.206 0.196562 0.187125 0.177687 0.16825 0.158812 0.149375 0.139937 0.1305 0.121062 0.111625 0.102187 0.09275 0.0833125 0.073875 0.0644375 0.055
B
(c)
Figure 3:𝑦-direction strain𝜀𝑦distribution during tensile testing process. (a) 5 s; (b) 25 s; (c) 35 s.
strain can be measured directed by DIC analysis. Therefore, the equivalent strain of AM50 Mg alloy sheet can be got according to local𝜀𝑥,𝜀𝑦, and𝛾𝑥𝑦.
Figure 4 shows the equivalent strain distribution in the RD specimen at 5 s, 25 s, and 35 s, respectively, in which the different color stands for different equivalent strain. In Figure 4(a), the maximum equivalent strain is 0.0166 in marked𝐴 position slightly smaller than the maximum𝑦 -direction strain in Figure 3(a), and the maximum equivalent strain position is the same as in Figure 3(a). The minimum equivalent strain is 0.0027, and the difference between the maximum and the minimum equivalent at 5 s is 0.0139. As time is 25 s, in Figure 4(b), the maximum equivalent strain reaches 0.099 in the middle part and bottom part of specimen as marked𝐵. The minimum equivalent strain is 0.035, and the difference between the maximum and the minimum equivalent strain is 0.064. When time is 35 s, in Figure 4(c), the maximum equivalent strain is 0.1675 in the marked 𝐵 position. The minimum equivalent strain is 0.045, and the difference between the maximum and the minimum equivalent strain is 0.1225. After 35 s, the specimen breaks, and𝐵position is the initial crack source and then diffuses from the left to right side of the specimen until the specimen completely breaks. Figure 4 indicates the maximum
equivalent strain, the minimum equivalent strain, and the difference between them all increase as time increases, which means that the strain in the RD specimen becomes more and more uneven during the deformation process. In addition, the critical failure equivalent strain for the RD specimen of AM50 Mg alloy is 0.1675.
Comparing Figure 4 with Figure 3, it can be found that the equivalent strain is slightly smaller than𝑦-direction strain in the same position because the equivalent strain relied on its value in𝑥-,𝑦-direction and shear strain, as shown in (1). If in (1) only𝜀𝑦is big and other two strains are small, the equivalent strain may be smaller than𝜀𝑦. Figure 4 also indicates when the local equivalent strain reaches 0.1675, the specimen is at risk of failure and 0.1675 is the critical failure strain for the RD specimen of AM50 Mg alloy plate.
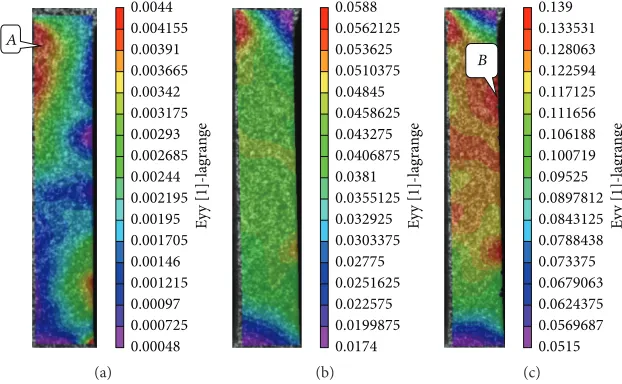
3.2. Strain Distribution of the TD Specimen. Figure 5 shows𝑦
-direction strain distribution in the TD specimen at 2.5 s, 15 s, and 30 s, respectively, and different color stands for different
Eq
. en
0.00878125 0.0079125 0.00704375 0.006175 0.00530625 0.0044375 0.00356875 0.0027
(a)
Eq
. en
0.063 0.059 0.055 0.051 0.047 0.043 0.039 0.035
B
(b)
Eq
. en
0.0985938 0.0909375 0.0832812 0.075625 0.0679688 0.0603125 0.0526563 0.045
B
[image:4.600.149.452.72.265.2](c)
Figure 4: Equivalent strain distribution of the RD specimens: (a) 5 s; (b) 25 s; (c) 35 s.
Ey
y [1]-lagra
ng
e
0.0044 0.004155 0.00391 0.003665 0.00342 0.003175 0.00293 0.002685 0.00244 0.002195 0.00195 0.001705 0.00146 0.001215 0.00097 0.000725 0.00048
A
(a)
Ey
y [1]-lagra
ng
e
0.0588 0.0562125 0.053625 0.0510375 0.04845 0.0458625 0.043275 0.0406875 0.0381 0.0355125 0.032925 0.0303375 0.02775 0.0251625 0.022575 0.0199875 0.0174
(b)
Ey
y [1]-lagra
ng
e
0.139 0.133531 0.128063 0.122594 0.117125 0.111656 0.106188 0.100719 0.09525 0.0897812 0.0843125 0.0788438 0.073375 0.0679063 0.0624375 0.0569687 0.0515
B
(c)
Figure 5:𝑦-direction strain distribution of TD specimen: (a) 2.5 s; (b) 15 s; (c) 30 s.
shown in Figure 5(b), the maximum 𝑦-direction strain is 0.0588 in the left top side of the specimen. The minimum
𝑦-direction strain is 0.0174, and the difference between the maximum and the minimum𝑦-direction strain is 0.0414 at 15 s. At 30 s in Figure 5(c), the maximum𝑦-direction strain is 0.139 in marked𝐵 zone, and the minimum 𝑦-direction strain is 0.0518. The difference between the maximum and the minimum𝑦-direction strain is 0.0872 at 30 s. After 30 s the specimen breaks. Figure 5 shows that the maximum strain position gradually transfers from marked𝐴position to marked𝐵position and finally the specimen fails in marked𝐵 position.
For the TD specimen, loading rate is also 3 mm/min, and the total 𝑦-direction strain at 30 s can be got as 𝜀 =
(3 ∗ 30/60)/15 ≈ 0.1, which is only little smaller than the
maximum 𝑦-direction strain. Comparing Figure 5(c) with Figure 3(c), it can be found that the𝑦-direction strain distri-bution in TD specimen is more even with smaller difference
between the minimum and the maximum𝑦-direction strain than that in RD specimen. In addition, the maximum 𝑦 -direction strain in RD specimen is 1/3 higher than that in the TD specimen, which means that the RD specimen can bear higher𝑦-direction strain than TD specimen.
[image:4.600.143.454.302.494.2]Eq
. en
gr
. s
tra
in [1]
0.0038 0.00360875 0.0034175 0.00322625 0.003035 0.00284375 0.0026525 0.00246125 0.00227 0.00207875 0.0018875 0.00169625 0.001505 0.00131375 0.0011225 0.00093125 0.00074
A
(a)
Eq
. en
gr
. s
tra
in [1]
0.0508 0.048475 0.04615 0.043825 0.0415 0.039175 0.03685 0.034525 0.0322 0.029875 0.02755 0.025225 0.0229 0.020575 0.01825 0.015925 0.0136
(b)
Eq
. en
gr
. s
tra
in [1]
0.118 0.113281 0.108562 0.103844 0.099125 0.0944062 0.0896875 0.0849687 0.08025 0.0755313 0.0708125 0.0660938 0.061375 0.0566562 0.0519375 0.0472188 0.0425
B
[image:5.600.141.457.71.264.2](c)
Figure 6: Equivalent strain distribution at different time: (a) 2.5 s; (b) 15 s; (c) 30 s.
Figure 6(c), the maximum equivalent strain is 0.118 in marked
𝐵position and the minimum equivalent strain is only 0.0425. The difference between the maximum and the minimum equivalent strain is 0.0755. After 30 s, TD specimen breaks, and 0.118 is the critical failure equivalent strain. Figure 6 indicates the maximum strain gradually transferring from𝐴 position to𝐵position, and finally the specimen breaks at𝐵 position and diffuses from the right side to the left side of specimen.
Comparing Figure 6 with Figure 4, the differences between the maximum equivalent strain and the minimum equivalent strain in the RD and the TD specimen are 0.1225 (0.1675–0.045) and 0.0755 (0.118–0.0425), respectively, which indicates more uneven distribution of equivalent strain in the RD specimen than that of the TD specimen. Furthermore, the minimum equivalent strain difference between the RD (0.045) and the TD (0.0425) specimen is less. If the time period difference between the TD and the RD specimen is considered, the minimum equivalent strain is nearly the same under the same drawing time. On the contrary, there is a relatively big difference in maximum equivalent strain between the RD specimen (0.1675) and the TD specimen (0.118), which means under loading rate 3 mm/min the maximum equivalent strain in the RD specimen is 1/3 higher than that in the TD specimen.
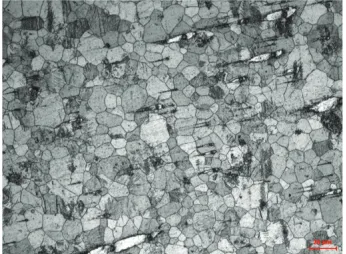
3.3. Microstructure Evolution. Figure 7 shows the initial
microstructure of AM50 Mg alloy plate after annealing treatment before tensile test begins, and averaged grain size is 10𝜇m with no twinning appearing in grains. It is typical fine annealing microstructure.
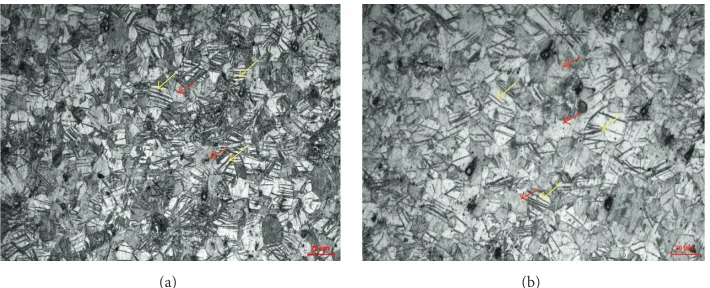
[image:5.600.342.515.310.437.2]Figure 8 shows microstructure in the maximum equiv-alent strain position after specimen breaks. Figure 8(a) is microstructure in the maximum equivalent strain position of the RD specimen. Figure 8(b) is the microstructure in the maximum equivalent strain position of the TD specimen. As shown in Figure 8(a), during the tensile process, most of the grains generated the twinning as marked yellow
Figure 7: Initial microstructure before tensile test.
arrow, and there are still some grains with less twinning generated. As stated by Liu and Ding [25], when the tensile stress is parallel to the𝑐-axis of Mg alloy crystal structure,
{1 0 1 2}twinning can be generated at room temperature
(a) (b)
Figure 8: Microstructure in the maximum strain position: (a) RD; (b) TD.
[image:6.600.123.474.255.402.2](a) (b)
Figure 9: Fracture surface morphology: (a) RD specimen; (b) TD specimen.
than TD specimen. On the contrary, as shown in Figure 8(b), in the TD specimen marked red arrow grains are fewer than that in Figure 8(a) because during the rolling process the orientation of microstructure tends to (0002) plane and its orientation is parallel to rolling direction, which means in the TD specimen the tensile stress is perpendicular to the (0002) plane. When tensile stress is perpendicular to the (0002) plane,{1 0 1 1}twinning can be generated. Generally, at room temperature,{1 0 1 2} twinning is more preferred due to the fact that it has a lower critical shear stress compared
with{1 0 1 1}twinning. In addition,{1 0 1 2}twinning
can reduce the hardening effect and make the yield strength drop, which increases its plasticity of AM50 Mg alloy. So in Figure 8(a) RD specimen shows more twinning than TD specimen in Figure 8(b); that is why the RD specimen has nearly 1/3 higher strain compared to TD specimen.
Figure 9 shows SEM images of the fracture morphology. Figure 9(a) shows the fracture image of the RD specimen, which is classic characteristic of quasi-cleavage fracture morphology, which contains cleavage facets blended with dimples, as the arrow marked. The fracture morphology of Figure 9(a) indicates that the RD specimen bears a little plasticity deformation before it breaks, while in the TD specimen (Figure 9(b)) fracture morphology indicates a characteristic of typical cleavage fracture with clear cleavage plane and steps as arrow marked, which indicates that
the fracture morphology is a typical brittle fracture with low plasticity. In Figure 9, it shows that the more the dimple is, the better the deformation ability is. Comparing Figure 9(a) with Figure 9(b), the reason why the RD specimen has better deformation ability than that of the TD specimen can be found.
4. Conclusion
Through DIC recording and analyzing of the local strain distribution and microstructure morphology observing and fracture surface observation in AM50 Mg alloy specimens during tensile deformation, the following conclusions can be drawn:
(1) In the RD specimen the critical failure equivalent strain is 0.1675, while in the TD specimen the critical failure equivalent strain is only 0.118. The RD speci-men can bear 1/3 higher strain than TD specispeci-men. (2) In both the RD and the TD specimens, the maximum
equivalent strain position is the crack source. (3) More twinning can be observed in the RD
(4) The fracture surface of the RD specimen shows some quasi-cleavage fracture while the TD specimen fracture surface shows the cleavage crack feature.
Conflict of Interests
The authors declare that there is no conflict of interests regarding the publication of this paper.
Acknowledgment
Thanks for the financial support go to National Science Foundation of China, Grant no. 50971039.
References
[1] Z. Wenyu, “Study progress of magnesium alloy and its working
technology,”Rare Metals Letters, vol. 26, pp. 15–19, 2007.
[2] Z. Chen,Mg Alloys, Chemical Industry Press, Beijing, China,
2004 (Chinese).
[3] H. K. Lim, J. Y. Lee, D. H. Kim, W. T. Kim, J.-S. Lee, and D. H. Kim, “Enhancement of mechanical properties and formability of Mg–MM–Sn–Al–Zn alloy sheets fabricated by cross-rolling
method,”Materials Science and Engineering A, vol. 506, no. 1-2,
pp. 63–70, 2009.
[4] X. Meng, R. Wu, M. Zhang, L. Wu, and C. Cui, “Microstructures and properties of superlight Mg–Li–Al–Zn wrought alloys,” Journal of Alloys and Compounds, vol. 486, no. 1-2, pp. 722–725, 2009.
[5] Q. Q. Zhang, Z. Y. Cao, Y. B. Liu, J. H. Wu, and Y. F. Zhang, “Study on the microstructure evolution and rheological
parameter of semisolid Mg–10Al–4Zn alloys,”Materials Science
and Engineering A, vol. 478, no. 1-2, pp. 195–200, 2008. [6] S. Ha, S.-J. Kim, S. Hong et al., “Improvement of ductility
in magnesium alloy sheet using laser scanning treatment,” Materials Letters, vol. 64, no. 3, pp. 425–427, 2010.
[7] A. Fern´andez, M. T. P. Prado, Y. Wei, and A. J´erusalem, “Continuum modeling of the response of a Mg alloy AZ31
rolled sheet during uniaxial deformation,”International Journal
of Plasticity, vol. 27, no. 11, pp. 1739–1757, 2011.
[8] Y. Ma, J. Zhang, and M. Yang, “Research on microstructure and
alloy phases of AM50 magnesium alloy,”Journal of Alloys and
Compounds, vol. 470, no. 1-2, pp. 515–521, 2009.
[9] H. Ding, K. Hirai, T. Homma, and S. Kamado, “Numerical simulation for microstructure evolution in AM50 Mg alloy
during hot rolling,”Computational Materials Science, vol. 47, no.
4, pp. 919–925, 2010.
[10] F. Roters, P. Eisenlohr, L. Hantcherli, D. D. Tjahjanto, T. R. Bieler, and D. Raabe, “Overview of constitutive laws, kinemat-ics, homogenization and multiscale methods in crystal plasticity finite-element modeling: theory, experiments, applications,” Acta Materialia, vol. 58, no. 4, pp. 1152–1211, 2010.
[11] G. I. Taylor, “The mechanism of plastic deformation of crystals.
Part I—theoretical,”Proceedings of the Royal Society of London
Series A: Containing Papers of a Mathematical and Physical Character, vol. 145, no. 855, pp. 362–387, 1934.
[12] G. I. Taylor, “The mechanism of plastic deformation of crystals.
Part II—comparison with observations,” Proceedings of the
Royal Society of London A, vol. 145, pp. 388–404, 1934.
[13] E. Kr¨oner, “On the plastic deformation of polycrystals,”Acta
Metallurgica, vol. 9, no. 2, pp. 155–161, 1961.
[14] H. Wang, B. Raeisinia, P. D. Wu, S. R. Agnew, and C. N. Tom´e, “Evaluation of self-consistent polycrystal plasticity models for
magnesium alloy AZ31B sheet,”International Journal of Solids
and Structures, vol. 47, no. 21, pp. 2905–2917, 2010.
[15] A. Vinogradov, D. Orlov, A. Danyuk, and Y. Estrin, “Effect of grain size on the mechanisms of plastic deformation in wrought Mg-Zn-Zr alloy revealed by acoustic emission measurements,” Acta Materialia, vol. 61, no. 6, pp. 2044–2056, 2013.
[16] N. Zaafarani, D. Raabe, R. N. Singh, F. Roters, and S. Zaef-ferer, “Three-dimensional investigation of the texture and microstructure below a nanoindent in a Cu single crystal using
3D EBSD and crystal plasticity finite element simulations,”Acta
Materialia, vol. 54, no. 7, pp. 1863–1876, 2006.
[17] G. X. Zhang Keshi, L. Jinshan, and H. Rui, “Tensile necking under the mechanism of slip deformation of single crystal Cu
specimen,”Science China Earth, vol. 37, pp. 866–874, 2007.
[18] T. B¨ohlke, G. Risy, and A. Bertram, “A texture component model
for anisotropic polycrystal plasticity,”Computational Materials
Science, vol. 32, no. 3-4, pp. 284–293, 2005.
[19] M. Sachtleber, Z. Zhao, and D. Raabe, “Experimental
inves-tigation of plastic grain interaction,” Materials Science and
Engineering A, vol. 336, no. 1-2, pp. 81–87, 2002.
[20] A. Bhattacharyya, E. El-Danaf, S. R. Kalidindi, and R. D. Doherty, “Evolution of grain-scale microstructure during large strain simple compression of polycrystalline aluminum with quasi-columnar grains: OIM measurements and numerical
simulations,”International Journal of Plasticity, vol. 17, no. 6, pp.
861–883, 2001.
[21] S. Cooreman, D. Lecompte, H. Sol, J. Vantomme, and D. Debruyne, “Identification of mechanical material behavior
through inverse modeling and DIC,”Experimental Mechanics,
vol. 48, no. 4, pp. 421–433, 2008.
[22] M. A. Sutton, J. H. Yan, V. Tiwari, H. W. Schreier, and J. J. Orteu, “The effect of out-of-plane motion on 2D and 3D digital image
correlation measurements,”Optics and Lasers in Engineering,
vol. 46, no. 10, pp. 746–757, 2008.
[23] S. Mguil-Touchal and F. M. M. Brunet, “Various experimen-tal applications of digiexperimen-tal image correlation method,” http:// icasoft.insa-lyon.fr/data/CMEM.pdf.
[24] F. Hua, C. Zhang, Q. Li et al., “Numerical simulation of rolling process and microstructure evolution of AM50 Mg alloy during
hot rolling process,”Advanced Materials Research, vol. 291–294,
pp. 449–454, 2011.
[25] C. Z. Liu and C. Ding, “Microstructure evolution and defor-mation behavior of hot rolled mg alloy at low temperature,” The Chinese Journal of Nonferrous Metals, vol. 18, pp. 1577–1584, 2008 (Chinese).
[26] G.-S. Song, S.-H. Zhang, L. Zheng, and L. Ruan, “Twinning, grain orientation and texture variation of AZ31 Mg alloy
during compression by EBSD tracing,”Journal of Alloys and
Compounds, vol. 509, no. 22, pp. 6481–6488, 2011.
[27] Y. Chino, K. Kimura, M. Hakamada, and M. Mabuchi, “Mechanical anisotropy due to twinning in an extruded AZ31
Mg alloy,”Materials Science and Engineering A, vol. 485, no. 1-2,
Submit your manuscripts at
http://www.hindawi.com
Scientifica
Hindawi Publishing Corporation
http://www.hindawi.com Volume 2014
Hindawi Publishing Corporation
http://www.hindawi.com Volume 2014
Ceramics
Journal ofNanoparticles
Journal of Hindawi Publishing Corporationhttp://www.hindawi.com Volume 2014
Hindawi Publishing Corporation
http://www.hindawi.com Volume 2014
International Journal of
Biomaterials
Hindawi Publishing Corporation
http://www.hindawi.com Volume 2014
Nanoscience
Journal ofTextiles
Hindawi Publishing Corporation
http://www.hindawi.com Volume 2014 Journal of
Crystallography
Journal ofHindawi Publishing Corporation
http://www.hindawi.com Volume 2014
The Scientific
World Journal
Hindawi Publishing Corporationhttp://www.hindawi.com Volume 2014
Hindawi Publishing Corporation
http://www.hindawi.com Volume 2014
Coatings
Journal of Advances inMaterials Science and Engineering
Hindawi Publishing Corporation
http://www.hindawi.com Volume 2014
Hindawi Publishing Corporation
http://www.hindawi.com Volume 2014
Hindawi Publishing Corporation
http://www.hindawi.com Volume 2014
BioMed
Research International
Materials
Journal ofHindawi Publishing Corporation
http://www.hindawi.com Volume 2014
N
a
no
ma
te
ria
ls
Hindawi Publishing Corporation
http://www.hindawi.com Volume 2014
Journal of