Preliminary Validation of a High
Docosahexaenoic Acid (DHA) and -Linolenic
Acid (ALA) Dietary Oil Blend: Tissue Fatty
Acid Composition and Liver Proteome
Response in Atlantic Salmon (
Salmo salar
)
Smolts
Waldo G. Nuez-Ortín1,2*, Chris G. Carter1, Richard Wilson3, Ira Cooke4, Peter D. Nichols1,2
1Institute for Marine and Antarctic Studies, University of Tasmania, Private Bag 49, Hobart, TAS 7001, Australia,2CSIRO Food Nutrition and Bio-based Products, Oceans & Atmosphere, GPO Box 1538, Hobart, TAS 7001, Australia,3Central Science Laboratory, University of Tasmania, Bag 74, Hobart, TAS 7001, Australia,4Department of Molecular and Cell Biology, James Cook University, Townsville, QLD 4811, Australia
*waldo.nuezortin@utas.edu.au
Abstract
Marine oils are important to human nutrition as the major source of docosahexaenoic acid (DHA), a key omega-3 long-chain (C20) polyunsaturated fatty acid (n-3 LC-PUFA) that is
low or lacking in terrestrial plant or animal oils. The inclusion of fish oil as main source of n-3 LC-PUFA in aquafeeds is mostly limited by the increasing price and decreasing availability. Fish oil replacement with cheaper terrestrial plant and animal oils has considerably reduced the content of n-3 LC-PUFA in flesh of farmed Atlantic salmon. Novel DHA-enriched oils with high alpha-linolenic acid (ALA) content will be available from transgenic oilseeds plants in the near future as an alternative for dietary fish oil replacement in aquafeeds. As a prelimi-nary validation, we formulated an oil blend (TOFX) with high DHA and ALA content using tuna oil (TO) high in DHA and the flaxseed oil (FX) high in ALA, and assessed its ability to achieve fish oil-like n-3 LC-PUFA tissue composition in Atlantic salmon smolts. We applied proteomics as an exploratory approach to understand the effects of nutritional changes on the fish liver. Comparisons were made between fish fed a fish oil-based diet (FO) and a commercial-like oil blend diet (fish oil + poultry oil, FOPO) over 89 days. Growth and feed efficiency ratio were lower on the TOFX diet. Fish muscle concentration of n-3 LC-PUFA was significantly higher for TOFX than for FOPO fish, but not higher than for FO fish, while retention efficiency of n-3 LC-PUFA was promoted by TOFX relative to FO. Proteomics analysis revealed an oxidative stress response indicative of the main adaptive physiological mechanism in TOFX fish. While specific dietary fatty acid concentrations and balances and antioxidant supplementation may need further attention, the use of an oil with a high content
a11111
OPEN ACCESS
Citation:Nuez-Ortín WG, Carter CG, Wilson R, Cooke I, Nichols PD (2016) Preliminary Validation of a High Docosahexaenoic Acid (DHA) and -Linolenic Acid (ALA) Dietary Oil Blend: Tissue Fatty Acid Composition and Liver Proteome Response in Atlantic Salmon (Salmo salar) Smolts. PLoS ONE 11 (8): e0161513. doi:10.1371/journal.pone.0161513
Editor:José L Soengas, Universidade de Vigo, SPAIN
Received:May 12, 2016
Accepted:August 5, 2016
Published:August 24, 2016
Copyright:© 2016 Nuez-Ortín et al. This is an open access article distributed under the terms of the Creative Commons Attribution License, which permits unrestricted use, distribution, and reproduction in any medium, provided the original author and source are credited.
Data Availability Statement:All relevant data are within the paper and its Supporting Information files. The mass spectrometry proteomics data have been deposited to the ProteomeXchange Consortium via the PRIDE partner repository with the dataset identifier PXD004114.
of DHA and ALA can enhance tissue deposition of n-3 LC-PUFA in relation to a commer-cially used oil blend.
1. Introduction
The importance of seafood in human nutrition and the ability of aquaculture, as it meets the increasing demand for seafood, to provide nutrients traditionally supplied by seafood, particu-larly key fatty acids, are central issues in global food security [1]. The absolute content of omega-3 longchain (C20) polyunsaturated fatty acid(n-3 LC-PUFA), particularly
docosahex-aenoic acid (22:6n-3, DHA) and eicosapentdocosahex-aenoic acid (20:5n-3, EPA), is one of the critical contributions that Atlantic salmon makes to human diet and nutrition [2], and the benefits of an adequate dietary supply of n-3 LC-PUFA are well documented [3,4]. Current dietary rec-ommendations for weekly intake of n-3 LC-PUFA range between 2 and 14 g [5,6], equivalent to at least two weekly servings of 100 g of fatty fish such as Atlantic salmon. However, concerns regarding the actual content of n-3 LC-PUFA in the fillet of farmed Atlantic salmon and the potential health benefits delivered to the consumer have been raised [7]. As shown by recent reports from Australia and Europe, current absolute concentrations of the n-3 LC-PUFA have dropped to half (~ 1000 mg per 100 g of muscle) in the last decade and/or show high variability among retailers [2,8]. This decrease in n-3 LC-PUFA content was attributed by the same authors to industry feeding practices, which are a consequence of reduced fish oil availability, competition from other industries and increasing price. Terrestrial vegetable oils and rendered animal fats are used to replace fish oil in salmon aquafeeds; and although less expensive and more readily available than fish oil, they are low or lacking in n-3 LC-PUFA [2,9]. Therefore, enhancing the actual nutritional value of Atlantic salmon fillet necessarily requires the inclu-sion in aquafeeds of new and sustainable oils with higher n-3 LC-PUFA content than those currently in use.
A parallel line of thought is that sustainable feed formulation should also aim to promote efficient tissue deposition of n-3 LC-PUFA. The foundation for this is that tissue fatty acid composition is not only dependent on dietary fatty acid composition, but also on the respective metabolic fates such as utilization for energy, bioconversion or de novo production [10]. The concept of a“n-3 LC PUFA sparing effect”was revised by Codabaccus et al. [11], concluding that equally important to the absolute dietary supply of n-3 LC-PUFA is an increase in the DHA:EPA ratio that promotes enhanced tissue deposition efficiency. Concurrently, the effi-ciency of tissue deposition of n-3 LC-PUFA in salmonid teleosts can be promoted by increasing the availability of the alpha-linolenic acid (18:3n-3, ALA) precursor, which can be further desa-turated and elongated [10,12,13], or alternatively, preferentially oxidized over n-3 LC-PUFA if present in high amounts [14,15].
Over the last 15 years, considerable progress has been made in the field of plant metabolic engineering for effective production of oilseeds rich in n-3 LC-PUFA [16]. This research and development has been encouraged by the relatively low production cost of transgenic oilseeds as well as by the potential capability to adequately scale up for large volume applications [17]. The recent development of a DHA-containing oil extracted fromCamelina sativacontaining fish oil-like DHA levels of 12%, EPA levels of 3% and ALA levels of 29% presents a future alter-native to meet the demand for n-3 LC-PUFA from aquaculture [18,19]. This particular profile suggests promise as a substitute for fish oil because it theoretically supports the idea of enhanc-ing efficiency of tissue deposition of n-3 LC-PUFA by sparenhanc-ing their deposition and promotenhanc-ing
Flagship and the University of Tasmania. The funder Nuseed approved the publication of the manuscript but had no role in study design, data collection and analysis, or preparation of the manuscript.
Competing Interests:This research was funded by Nuseed Pty Ltd and CSIRO Ocean and Atmosphere, formerly as the Food Futures Flagship and the University of Tasmania. This does not alter our adherence to PLOS ONE policies on sharing data and materials.
Abbreviations:n-3 LC-PUFA, omega-3 long-chain (C20) polyunsaturated fatty acids; DHA,
of ALA bioconversion. Novel DHA-containing oils extracted from transgenic plants are pres-ently under development [18,20], are only produced in limited quantities, and at the time of this study were unavailable in sufficient amount to perform a feeding trial. Thus, two oils were blended, tuna oil as a source of DHA (27% of total fatty acids), and flaxseed oil as a source of ALA (56% of total fatty acids), to obtain an oil blend that attempted to mimic the fatty acid profile of a novelCamelina-DHA oil. We tested the hypothesis that such a blended oil profile would result in fillet contents of n-3 LC-PUFA higher than those from current alternative oil-based diets and improve the efficiency of tissue deposition of n-3 LC-PUFA as compared to a fish oil-based diet. While EPA-containing oil extracted from transgenicCamelinahas been produced [21] and tested in Atlantic salmon [22] in the United Kingdom, the present study is the first attempt to perform a preliminary validation of an oil with high DHA and ALA profile in salmon, thereby aiming to assist in the further development and use in aquafeeds of novel DHA-containing oils with high ALA content.
A more precise control of feed composition requires both a broader screening and a more sensitive approach to understanding dietary induced physiological changes in fish. This can be achieved by being able to interpret changes in the liver proteome, as previously reported in response to other dietary modifications [23,24]. The liver is a crucial site for fatty acid metabo-lism and body lipid homeostasis in Atlantic salmon and possesses other regulatory functions related to protein and carbohydrate metabolism, immunity or xenobiotic metabolism [22,25]. With regard to the specific use of sustainable ingredients in salmon aquafeeds, the liver prote-ome of Atlantic salmon has been studied in response to protein substitution [26], but the rela-tionship between the liver proteome and oil manipulation has not been investigated.
The objective of the present study was to test the effectiveness of an oil blend with high DHA and ALA content, as found in oil from transgenicCamelinaseeds [18], as a substitute for dietary fish oil in Atlantic salmon. Comparisons were made to a fish oil-based diet and a com-mercial-like oil blend containing fish oil and poultry oil as is currently used in aquafeeds for Atlantic salmon farmed in Tasmania (Australia). Our findings will primarily contribute towards further development and use of DHA-containing oil from transgenic plants as a sus-tainable solution for improving the nutritional value of salmon fillet. Secondly, knowledge of the liver proteome response to dietary oil manipulation is likely to provide useful insights into the regulatory mechanisms governing lipid metabolism and other metabolism-relevant mecha-nisms that directly affect phenotypic traits in Atlantic salmon.
2. Materials and Methods
2.1. Experimental feeds
Three isonitrogenous and isolipidic experimental feeds were formulated to contain 240 g kg−1 of lipid and 490 g kg−1of protein, varying only the lipid source: A 100% fish oil feed (FO), a blend of 20% fish oil and 80% poultry oil (FOPO) regarded as representative of current feeding practices in Tasmania, and a blend of 60% tuna oil and 40% flaxseed oil formulated to mimic the fatty profile of DHA-containing oil fromCamelina(TOFX) (Table 1). Each feed included fish meal and yttrium oxide as a digestibility marker. Feeds were manufactured into 3 mm diameter pellets using a California Pellet Mill (CL-2, San Francisco, CA, USA), dried and stored at—20°C until use.
2.2. Feeding trial and sampling
Atlantic salmon smolts were sourced from a commercial hatchery (Petuna, Tasmania, Austra-lia), randomly allocated in 12 x 500 L seawater tanks at an initial stocking density of 26 fish tank−1and acclimated for 28 days. Tanks were arranged in two independent six-tank partial recirculation systems, each equipped with a heat-exchanger, protein skimmer, drum filter, UV filter and biological filter. System seawater was continually supplied and progressively replaced twice daily, with tanks supplied at a rate of 8.5 L min−1. Tanks were maintained at 15°C water temperature, and at 12 h light:12 h dark photoperiod. Water quality parameters (pH, DO, nitrate and nitrite) were recorded daily and maintained within limits for Atlantic salmon [27].
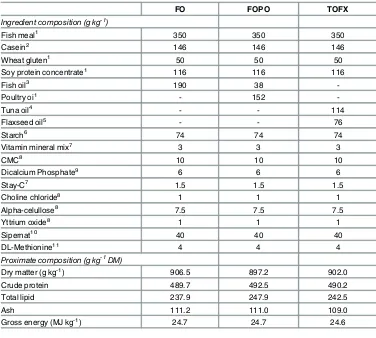
Table 1. Ingredient and proximate composition of experimental feeds.
FO FOPO TOFX
Ingredient composition (g kg-1)
Fish meal1 350 350 350
Casein2 146 146 146
Wheat gluten1 50 50 50
Soy protein concentrate1 116 116 116
Fish oil3 190 38
-Poultry oi1 - 152
-Tuna oil4 - - 114
Flaxseed oil5 - - 76
Starch6 74 74 74
Vitamin mineral mix7 3 3 3
CMC8 10 10 10
Dicalcium Phosphate9 6 6 6
Stay-C7 1.5 1.5 1.5
Choline chloride8 1 1 1
Alpha-celullose8 7.5 7.5 7.5
Yttrium oxide8 1 1 1
Sipernat10 40 40 40
DL-Methionine11 4 4 4
Proximate composition (g kg-1DM)
Dry matter (g kg-1) 906.5 897.2 902.0
Crude protein 489.7 492.5 490.2
Total lipid 237.9 247.9 242.5
Ash 111.2 111.0 109.0
Gross energy (MJ kg-1) 24.7 24.7 24.6
FO, oil content of feed is 100%fish oil; FOCF, oil content of feed is 20%fish oil and 80% chicken fat; TOFX, oil content of feed is 60% tuna oil and 40%flaxseed oil.
1Skretting Australia, Cambridge, TAS, Australia;
2MP Biomedicals Australasia Pty., Seven Hills, NSW, Australia; 3Chilean anchovy oil, Skretting Australia, Cambridge, TAS, Australia; 4Clover Corporation/NuMega Lipids, Melbourne, VIC, Australia; 5Kayban, Melbourne, VIC, Australia;
6Starch Australasia, Lane Cove, NSW, Australia; 7DSM, Wagga, NSW, Australia;
8Sigma-Aldrich, Castle Hill, NSW, Australia; 9ACE Chemical Company, Adelaide, SA, Australia; 10Degussa, Frankfurt, Germany;
11BEC Feed Solutions, Goodna, QLD, Australia.
During acclimation, fish were fed a commercial feed (520 g kg−1of crude protein, 210 g kg−1of fat, and 21.9 MJ kg−1of GE; Skretting, Tasmania, Australia).
At the start of the trial, fish were anaesthetized (Aqui-S150 mg L-1) [28] and wet weight and fork length measured. A total of 24 fish, representative of the initial population, were euthanized (Aqui-S1500 mg L-1). Twelve whole carcasses were stored at -20°C for initial chemical and fatty acid composition analyses. Dissected liver and dorsal muscle from the other twelve fish were frozen in liquid nitrogen and stored at -80°C for initial proximate and fatty acid composition analyses. Four replicate tanks, two per recirculation system, were randomly assigned to each experimental diet or treatment. Feeds were provided at 1% fish body weight in two daily rations (0900 and 1700 h), and increased uniformly by 0.1% fish body weight every week. Uneaten feed was collected twice daily 10 min after feeding to accurately determine feed intake per tank. At 21-day intervals, all fish were anaesthetized and bulk weighed to monitor growth. After 89 days of growth, eight fish tank-1were euthanized. Four whole carcasses were stored at -20°C for final chemical and fatty acid composition analysis. Dissected dorsal muscle and liver from the other four fish were subsampled, frozen in liquid nitrogen, and stored at -80°C for chemical and fatty acid composition and proteomic analyses. At the end of the trial (day 102), four fish per tank were anaesthetized and stripped for collection of faeces [29] and further proximate and fatty acid composition analyses. Fish were not fed for 24 h prior to being anaesthetized or euthanized.
2.3. Chemical composition
Tissues and whole carcasses sampled from the initial population were pooled, whereas tissues, whole carcasses and faeces from the final population were pooled on a per tank basis. Feeds, whole carcasses, tissues and faeces were freeze-dried to constant weight and milled to a fine powder. Dry matter was obtained by drying at 135°C for 2 h and ash content after incineration at 600°C for 2 h [30]. Crude protein was calculated after determination of total nitrogen by Kjeldahl analysis (Kjeltec™8100, Foss, Denmark), based on N x 6.25 [30]. Total lipid was obtained following overnight extraction using a modified Bligh and Dyer protocol [31], involv-ing a sinvolv-ingle phase extraction usinvolv-ing dichloromethane/methanol/water (1:2:0.8, v/v/v) followed by phase separation to yield a total lipid extract. Gross energy was measured by bomb calorim-eter (6725 Semimicro, Parr, IL, USA). Analyses were performed in quadruplicate for experi-mental diets and initial sampling and in duplicate for final sampling. All analyses were corrected for DM.
2.4. Fatty acid analysis
Absolute and relative values for each detected fatty acid were calculated from the areas of chro-matogram peaks.
GC-mass spectrometric (GC-MS) analyses were performed on a Finnigan Trace GC-MS ultra Quadrupole GC-MS (ThermoQuest Trace DSQ, Thermo Electron Corporation, TX, USA). Data was processed with ThermoQuest Xcalibur software (Thermo Electron Corpora-tion, TX, USA). The GC fitted with an on-column injector and a capillary HP-5 Ultra column (50 m x 0.32 mm i.d., 0.17μm film thickness, Agilent technologies, USA) of similar polarity to that described above. Individual components were identified using mass spectral data and by comparing retention time and MS data with those obtained for authentic and laboratory stan-dards. A full procedural blank analysis was performed concurrent to the sample batch.
2.5. Digestibility
Apparent digestibility (AD) was determined by assessing yttrium concentrations in experimen-tal diets and faeces. Yttrium was analysed using inductively coupled plasma mass spectrometry (ELEMENT 2, Thermo Fisher Scientific Inc., MA, USA) following digestion with nitric acid and hydrogen peroxide as previously described [32]. Apparent digestibility coefficients were calculated as (%) = 100−(100 x (Ydiet/ Yfaeces) x (Xfaeces/ Xdiet)), where Y is the percentage of
yttrium oxide and X is the percentage of a particular nutrient [33].
2.6. Fatty acid mass balance (FAMB)
A whole-body FAMB method was performed on the n-3 biosynthetic pathway to estimate the metabolic fate of ALA as previously described [10].
2.7. Liver preparation for proteomic analysis
2.7.1. Protein extraction. Liver tissues from two fish (~ 50 mg each) from each tank (8 treatment-1) were individually homogenized in Eppendorf tubes containing lysis buffer (7M urea, 2M thiourea, 50 mM pH 8 Tris) and protease inhibitor cocktail (Roche) using Tissue-Tearor homogenator (Biospec Products, OK, USA). Each extraction was performed for 18–24 h at 4°C with overnight rotation. After removal of insoluble material by centrifugation, an ali-quot was precipitated with 100% ethanol (9:1, v/v) overnight. Protein pellets were washed twice in 70% ethanol and re-suspended in lysis buffer. Protein concentrations were estimated with Bradford Protein Assay (Bio-Rad) using plate reader (Synergy TMHT, BioTek, QL, Aus-tralia). Sampling pooling was used to reduce the effect of inter-individual variability relative to the biochemical differences between fish groups exposed to different farming conditions [23,
34]. Liver protein extracts were pooled by tank (n = 4) and the volumes adjusted with lysis buffer to achieve a concentration of 1μgμL-1for each sample pool.
2.7.2. Nano-liquid chromatography and tandem mass spectrometry (LTQ-Orbitrap XL). Protein samples were trypsin-digested using standard procedures [35] and analyzed by nanoLC-MS/MS using an LTQ-Orbitrap XL and Ultimate 3000 RSLCnano HPLC system (ThermoFisher Scientific, MA, USA). Tryptic peptides (~1μg) were loaded onto a 20 mm x 75μm PepMap 100 trapping column (3μm C18) at 5μl/min, using 98% water, 2% acetonitrile
and 0.05% TFA. Peptides were separated at 0.3μl/min on a 250 mm x 75μm PepMap 100 RSLC column (2μm C18) held at 40°C, using a stepped gradient from 97% mobile phase A
2.7.3. Database searching and criteria for protein identification. RAW files from the LTQ-Orbitrap were imported into MaxQuant software version 1.5.1.2 for peptide matching to MS/MS spectra and label-free protein quantification on the basis of median peptide intensity (LFQ) values [36]. MS/MS spectra were searched against the Salmonidae database (http:// uniprot.org/taxonomy/8030; 17,795 entries entries) using the Andromeda search engine. Default settings for protein identification were used, including a maximum of two missed cleavages, mass error tolerances of 20 ppm then 4.5 ppm for initial and main peptide searches, respectively, 0.5 Da tolerance for fragment ions, variable oxidation of methionine and fixed carbamidomethylation of cysteine. The false discovery rates for peptide-spectrum matches and protein identification were both set to 0.01. MaxQuant output files of the complete peptide and protein-level mass spectrometry are provided inS1 File.
2.8. Calculations and statistical analysis
Standard formulae were used to assess growth, feed efficiency and biometrical data. Specific growth rate was calculated as SGR (% d-1) = 100 x (ln Wf / ln Wi) / d, where Wf and Wi are the final and initial weights (g) and d the number of days of the experiment. Feed efficiency ratio (g g-1) was determined as FER = Wg/ FI, where Wgis weight gain (g) over the feeding trial and
FI is the total feed intake (g). Fulton’s condition factor was calculated as k = W / FL3, where W
is fish weight (g) and FL is fork length (cm). Hepato-, whole gut-, and pyloric caeca- somatic indices were determined as HSI, GSI, PCSI = (TW / W) x 100, where TW is tissue weight (g) and W is fish weight (g). The % difference in fatty acid concentrations between diet and tissues was calculated as [(dietary fatty acid—tissue fatty acid) / dietary fatty acid] x 100.
Statistical analyses of growth, digestibility and chemical composition were performed using SPSS v22.0 software (IBM Corp., NY, USA). Data interpretation was based on one-way analysis of variance (ANOVA) at a significance level of 0.05. Data were checked with Levene’s test to ensure normality and homogeneity of variance. Where significant differences were detected by ANOVA, data was subjected to Tukey-Kramer HSD post-hoc test. Results were expressed as mean ± standard error (SEM) (n = 4) and different letters within a row were used to denote sig-nificant differences (p<0.05) among treatments.
The effect of two separate recirculation systems as a random factor was explored in the form of a randomized block design, resulting in only a significant difference in terms of feed intake (psystem= 0.042, Fsystem= 5.809) and consequently on final weight (psystem= 0.004, Fsystem=
15.629), SGR (psystem= 0.011, Fsystem= 10.955) and FER (psystem= 0.011, Fsystem= 11.006).
Not-ing there was a balanced design and each feed was fed to duplicate tanks in each system. Accordingly, system was computed as random factor within the ANOVA analysis for all vari-ables under study and will not be discussed further.
of freedom adjusted accordingly. Proteins differentially abundant at an adjusted p-value<0.1 were selected for functional characterization. The salmonidae genes were first mapped to human orthologues using PANTHER [42] and then submitted to STRING v10 [43] for net-work enrichment analysis.
3. Results
3.1 Chemical composition of feeds
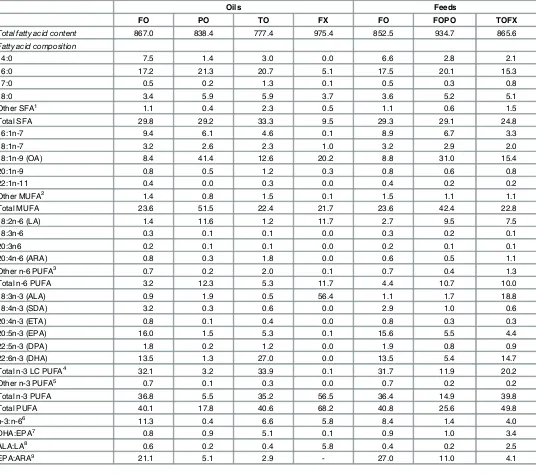
The three experimental feeds were isonitrogenous (490.8±0.86 g kg-1DM), isolipidic (242.8 ± 2.89 g kg-1DM) and isoenergetic (24.7 ± 0.03 MJ kg−1) (Table 1). The fish oil-based feed (FO) was 2.5 and 2.8-fold higher in DHA and EPA, respectively, than the commercial-like feed (FOPO), resulting in similar DHA:EPA ratios of approximately of 1 (Table 2). The TOFX feed was similar to FO in DHA, but 3.5-fold lower in EPA, resulting in a DHA:EPA ratio of 3.4. The concentration of n-3 LC-PUFA in the TOFX feed was 1.6-fold lower than in the FO feed and 1.7-fold greater than in the FOPO feed. The TOFX feed was highest in ALA, with a con-centration 11.4 and 18.7-fold greater than that of the FO and FOPO feeds, respectively. In both FO and TOFX feeds, polyunsaturated fatty acids (PUFA) was the dominant fatty acid group and palmitic acid (16:0, PA) was the dominant fatty acid; in FOPO feed, monounsaturated fatty acids (MUFA) was the dominant fatty acid group with oleic acid (18:1n-9, OA) as the dominant fatty acid.
3.2. Growth performance and biometry
Feed intake was similar across treatments and fish fed the three diets doubled their initial wet weight (Table 3). Growth and biometry were not different in FO and FOPO fish, but were nega-tively affected in TOFX fish. Final weight was significantly lower (pdiet= 0.042, Fdiet= 4.829) in
TOFX fish as compared to FO or FOPO fish. SGR (pdiet= 0.025, Fdiet= 6.046) and FER (pdiet=
0.009, Fdiet= 8.893) were significantly lower in TOFX fish. Fork length was not different across
treatments, but k was significantly (pdiet= 0.033, Fdiet= 5.420) lower for TOFX fish than for FO
or FOPO fish. HSI was not different across treatments. There were significant differences in GSI (pdiet= 0.016, Fdiet= 7.302) and PCSI (pdiet= 0.046, Fdiet= 4.624), with these in TOFX fish
not different to those of FOPO fish, but lower than those of FO fish.
3.3. Digestibility
Dietary oil source did not have a significant effect on apparent digestibility (AD) of dry matter, crude protein, total lipid or gross energy. Digestibility values were on average 69.4 ± 0.09% for dry matter, 89.3 ± 0.32% for crude protein, 94.0 ± 0.08% for lipid, and 80.6 ± 0.93% for gross energy.
AD for fatty acids was significantly affected by dietary oil source, however, differences were smaller than 3% for most individual and classes of fatty acids (S1 Table). AD of DHA was low-est (pdiet= 0.004, Fdiet= 9.993) in TOFX fish, whereas AD of EPA and other n-3 LC-PUFA
were not different across treatments. AD of ALA was lowest (pdiet= 0.000, Fdiet= 30.110) in
TOFX fish, and the same pattern was also followed for total n-3 PUFA (pdiet= 0.002, Fdiet=
12.780) and total PUFA (pdiet= 0.035, Fdiet= 5.275). AD of total MUFA was higher (pdiet=
0.042, Fdiet= 4.819) in TOFX fish than in FO fish, but not different from FOPO fish, whereas
Table 2. Total fatty acid content (mg g-1lipid) and fatty acid composition of oils and feeds (as % total fatty acids).
Oils Feeds
FO PO TO FX FO FOPO TOFX
Total fatty acid content 867.0 838.4 777.4 975.4 852.5 934.7 865.6
Fatty acid composition
14:0 7.5 1.4 3.0 0.0 6.6 2.8 2.1
16:0 17.2 21.3 20.7 5.1 17.5 20.1 15.3
17:0 0.5 0.2 1.3 0.1 0.5 0.3 0.8
18:0 3.4 5.9 5.9 3.7 3.6 5.2 5.1
Other SFA1 1.1 0.4 2.3 0.5 1.1 0.6 1.5
Total SFA 29.8 29.2 33.3 9.5 29.3 29.1 24.8
16:1n-7 9.4 6.1 4.6 0.1 8.9 6.7 3.3
18:1n-7 3.2 2.6 2.3 1.0 3.2 2.9 2.0
18:1n-9 (OA) 8.4 41.4 12.6 20.2 8.8 31.0 15.4
20:1n-9 0.8 0.5 1.2 0.3 0.8 0.6 0.8
22:1n-11 0.4 0.0 0.3 0.0 0.4 0.2 0.2
Other MUFA2 1.4 0.8 1.5 0.1 1.5 1.1 1.1
Total MUFA 23.6 51.5 22.4 21.7 23.6 42.4 22.8
18:2n-6 (LA) 1.4 11.6 1.2 11.7 2.7 9.5 7.5
18:3n-6 0.3 0.1 0.1 0.0 0.3 0.2 0.1
20:3n6 0.2 0.1 0.1 0.0 0.2 0.1 0.1
20:4n-6 (ARA) 0.8 0.3 1.8 0.0 0.6 0.5 1.1
Other n-6 PUFA3 0.7 0.2 2.0 0.1 0.7 0.4 1.3
Total n-6 PUFA 3.2 12.3 5.3 11.7 4.4 10.7 10.0
18:3n-3 (ALA) 0.9 1.9 0.5 56.4 1.1 1.7 18.8
18:4n-3 (SDA) 3.2 0.3 0.6 0.0 2.9 1.0 0.6
20:4n-3 (ETA) 0.8 0.1 0.4 0.0 0.8 0.3 0.3
20:5n-3 (EPA) 16.0 1.5 5.3 0.1 15.6 5.5 4.4
22:5n-3 (DPA) 1.8 0.2 1.2 0.0 1.9 0.8 0.9
22:6n-3 (DHA) 13.5 1.3 27.0 0.0 13.5 5.4 14.7
Total n-3 LC PUFA4 32.1 3.2 33.9 0.1 31.7 11.9 20.2
Other n-3 PUFA5 0.7 0.1 0.3 0.0 0.7 0.2 0.2
Total n-3 PUFA 36.8 5.5 35.2 56.5 36.4 14.9 39.8
Total PUFA 40.1 17.8 40.6 68.2 40.8 25.6 49.8
n-3:n-66 11.3 0.4 6.6 5.8 8.4 1.4 4.0
DHA:EPA7 0.8 0.9 5.1 0.1 0.9 1.0 3.4
ALA:LA8 0.6 0.2 0.4 5.8 0.4 0.2 2.5
EPA:ARA9 21.1 5.1 2.9 - 27.0 11.0 4.1
Oils: FO,fish oil; PO, poultry oil; TO, tuna oil; FX,flaxseed oil; Feeds: FO, oil content of feed is 100%fish oil; FOPO, oil content of feed is 20%fish oil and 80% poultry oil; TOFX, oil content of feed is 60% tuna oil and 40%flaxseed oil.
Data expressed as mean of four replicates per oil and feed.
1Includes 15:0, 20:0, 21:0, 22:0, 23:0 and 24:0.
2Includes 16:1n-5, 16:1n-9, 18:1n-5, 20:1n-7, 22:1n-9 and 24:1n-9. 3Includes 20:2n-6, 22:5n-6, and 22:4n-6.
4Includes 20:4n-3, 20:5n-3, 22:5n-3 and 22:6n-3. 5Includes 21:5n-3, 24:6n-3 and 24:5n3. 6n-3:n-6 ratio.
7DHA:EPA ratio. 8ALA:LA ratio. 9EPA:ARA ratio.
3.3. Chemical composition of tissues and whole carcasses
Diet did not have a significant effect on chemical composition of tissues and whole carcasses. Contents in white dorsal muscle were on average 256.9 ± 1.74 g kg-1for dry matter,
803.9 ± 7.24 g kg-1DM for crude protein, 98.5 ± 3.49 g kg-1DM for lipid, and 73.0 ± 4.21 g kg-1 DM for ash. Contents in liver were on average 258.9 ± 1.17 g kg-1for dry matter, 600.9 ± 7.51 g kg-1DM for crude protein, 153.4 ± 7.10 g kg-1DM for lipid, and 55.6 ± 1.13 g kg-1DM for ash. Contents in whole carcasses were on average 343.1 ± 2.20 g kg-1for dry matter, 498.8.9 ± 7.77 g kg-1DM for crude protein, 414.3 ± 7.52 g kg-1DM for lipid, and 83.9 ± 1.74 g kg-1DM for ash.
3.4. Fatty acid composition of tissues
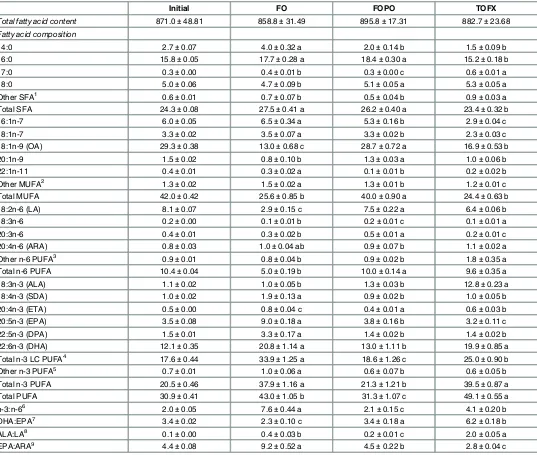
Fatty acid profiles in muscle tissue were significantly different among dietary treatments (Table 4). The concentration of DHA was not different between FO and TOFX fish, and was higher (pdiet= 0.000, Fdiet= 15.242) than that of FOPO fish. EPA was the highest (pdiet= 0.000,
Fdiet= 383.045) in FO fish, and higher in FOPO fish than in TOFX fish. Total n-3 LC-PUFA
differed significantly across treatments (pdiet= 0.000, Fdiet= 40.425), with the concentration in
TOFX fish being higher than in FOPO fish and lower than in FO fish. ALA was highest (pdiet=
0.000, Fdiet= 2319.401) in TOFX fish and not significantly different between FO and FOPO
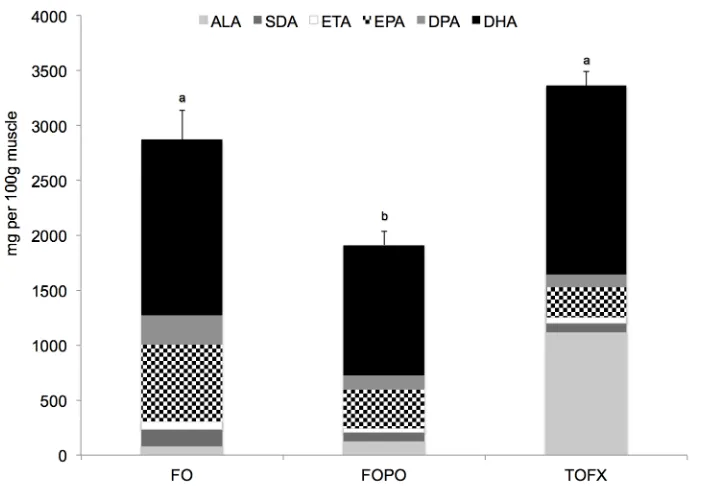
fish. The concentration of total n-3 PUFA in TOFX fish was higher (pdiet= 0.000, Fdiet=
76.281) than in FOPO fish and was not different from FO fish, and the same pattern was fol-lowed in terms of absolute contents (pdiet= 0.001, Fdiet= 15.889) (Fig 1). Total n-6 PUFA did
not differ between TOFX and FOPO fish and was higher (pdiet= 0.000, Fdiet= 114.197) than in
FO fish. The resulting omega-3:omega-6 (n-3:n-6) ratio was significantly different (pdiet=
0.000, Fdiet= 77.650), being higher in TOFX fish than in FOPO fish and lower than in FO fish.
[image:10.612.35.577.87.216.2]In TOFX and FO fish, PUFA was the dominant fatty acid group with DHA as the dominant
Table 3. Growth performance, feed utilisation and biometry of Atlantic salmon smolt fed FO, FOPO and TOFX feeds over a 89 day period.
FO FOPO TOFX
Initial weight (gfish-1) 104.7±0.83 105.4±1.72 107.0±1.92
Final weight (gfish-1) 222.8±5.47 ab 229.3±6.00 a 214.1±5.80 b
Feed intake (gfish-1) 130.2±3.22 137.3±5.42 131.4±2.55
SGR189d (%) 0.85±0.02 a 0.87±0.04 a 0.78±0.03 b
FER2 0.91±0.02 a 0.90±0.03 a 0.81±0.03 b
k3 1.1±0.03 a 1.1±0.02 a 1.0±0.01 b
HSI4(%) 1.4±0.17 1.2±0.06 1.3±0.11
GSI5(%) 10.4±0.54 a 9.3±0.21 ab 8.5±0.15 b
PCSI6(%) 4.9±0.25 a 4.4±0.16 ab 4.1±0.11 b
FO, oil content of feed is 100%fish oil; FOPO, oil content of feed is 20%fish oil and 80% poultry oil; TOFX, oil content of feed is 60% tuna oil and 40%
flaxseed oil.
Data expressed as mean±SEM (n = 4). Different letters within a row denotes significant differences among diets as determined by Tukey-Kramer HSD (p<0.05).
1Speciific growth rate. 2Feed efficiency ratio. 3Condition factor. 4Hepato-somatic index. 5Gut-somatic index.
6Pyloric caeca-somatic index.
Table 4. Total fatty acid content (mg g-1lipid) and fatty acid composition (% total fatty acid) of dorsal white muscle of Atlantic salmon smolt fed FO, FOCF and TOFX feeds over a 89 day period.
Initial FO FOPO TOFX
Total fatty acid content 871.0±48.81 858.8±31.49 895.8±17.31 882.7±23.68 Fatty acid composition
14:0 2.7±0.07 4.0±0.32 a 2.0±0.14 b 1.5±0.09 b
16:0 15.8±0.05 17.7±0.28 a 18.4±0.30 a 15.2±0.18 b
17:0 0.3±0.00 0.4±0.01 b 0.3±0.00 c 0.6±0.01 a
18:0 5.0±0.06 4.7±0.09 b 5.1±0.05 a 5.3±0.05 a
Other SFA1 0.6±0.01 0.7±0.07 b 0.5±0.04 b 0.9±0.03 a
Total SFA 24.3±0.08 27.5±0.41 a 26.2±0.40 a 23.4±0.32 b
16:1n-7 6.0±0.05 6.5±0.34 a 5.3±0.16 b 2.9±0.04 c
18:1n-7 3.3±0.02 3.5±0.07 a 3.3±0.02 b 2.3±0.03 c
18:1n-9 (OA) 29.3±0.38 13.0±0.68 c 28.7±0.72 a 16.9±0.53 b
20:1n-9 1.5±0.02 0.8±0.10 b 1.3±0.03 a 1.0±0.06 b
22:1n-11 0.4±0.01 0.3±0.02 a 0.1±0.01 b 0.2±0.02 b
Other MUFA2 1.3±0.02 1.5±0.02 a 1.3±0.01 b 1.2±0.01 c
Total MUFA 42.0±0.42 25.6±0.85 b 40.0±0.90 a 24.4±0.63 b
18:2n-6 (LA) 8.1±0.07 2.9±0.15 c 7.5±0.22 a 6.4±0.06 b
18:3n-6 0.2±0.00 0.1±0.01 b 0.2±0.01 c 0.1±0.01 a
20:3n-6 0.4±0.01 0.3±0.02 b 0.5±0.01 a 0.2±0.01 c
20:4n-6 (ARA) 0.8±0.03 1.0±0.04 ab 0.9±0.07 b 1.1±0.02 a
Other n-6 PUFA3 0.9±0.01 0.8±0.04 b 0.9±0.02 b 1.8±0.35 a
Total n-6 PUFA 10.4±0.04 5.0±0.19 b 10.0±0.14 a 9.6±0.35 a
18:3n-3 (ALA) 1.1±0.02 1.0±0.05 b 1.3±0.03 b 12.8±0.23 a
18:4n-3 (SDA) 1.0±0.02 1.9±0.13 a 0.9±0.02 b 1.0±0.05 b
20:4n-3 (ETA) 0.5±0.00 0.8±0.04 c 0.4±0.01 a 0.6±0.03 b
20:5n-3 (EPA) 3.5±0.08 9.0±0.18 a 3.8±0.16 b 3.2±0.11 c
22:5n-3 (DPA) 1.5±0.01 3.3±0.17 a 1.4±0.02 b 1.4±0.02 b
22:6n-3 (DHA) 12.1±0.35 20.8±1.14 a 13.0±1.11 b 19.9±0.85 a
Total n-3 LC PUFA4 17.6±0.44 33.9±1.25 a 18.6±1.26 c 25.0±0.90 b
Other n-3 PUFA5 0.7±0.01 1.0±0.06 a 0.6±0.07 b 0.6±0.05 b
Total n-3 PUFA 20.5±0.46 37.9±1.16 a 21.3±1.21 b 39.5±0.87 a
Total PUFA 30.9±0.41 43.0±1.05 b 31.3±1.07 c 49.1±0.55 a
n-3:n-66 2.0±0.05 7.6±0.44 a 2.1±0.15 c 4.1±0.20 b
DHA:EPA7 3.4±0.02 2.3±0.10 c 3.4±0.18 a 6.2±0.18 b
ALA:LA8 0.1±0.00 0.4±0.03 b 0.2±0.01 c 2.0±0.05 a
EPA:ARA9 4.4±0.08 9.2±0.52 a 4.5±0.22 b 2.8±0.04 c
FO, oil content of feed is 100%fish oil; FOPO, oil content of feed is 20%fish oil and 80% poultry oil; TOFX, oil content of feed is 60% tuna oil and 40%
flaxseed oil.
Data expressed as mean±SEM (n = 4). Different letters within a row denotes significant differences among diets as determined by Tukey-Kramer HSD (p<0.05).
1Includes 15:0, 20:0, 21:0, 22:0, 23:0 and 24:0.
2Includes 16:1n-5, 16:1n-9, 18:1n-5, 20:1n-7, 22:1n-9 and 24:1n-9. 3Includes 20:2n-6, 22:5n-6, and 22:4n-6.
4Includes 20:4n-3, 20:5n-3, 22:5n-3 and 22:6n-3. 5Includes 21:5n-3, 24:6n-3 and 24:5n3. 6n-3:n-6 ratio.
7DHA:EPA ratio. 8ALA:LA ratio. 9EPA:ARA ratio.
fatty acid; in FOPO fish, MUFA was the dominant fatty acid group with OA as the dominant fatty acid.
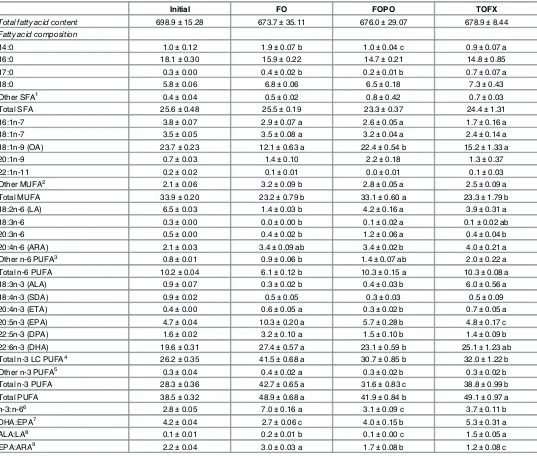
Fatty acid profiles in liver tissue were significantly different among dietary treatments (Table 5). DHA concentration in TOFX fish was not different from those of FO and FOPO fish, but was higher (pdiet= 0.029, Fdiet= 5.564) in FO fish than in FOPO fish. EPA was the
highest (pdiet= 0.000, Fdiet= 208.308) in FO fish, and higher in FOPO fish than in TOFX fish.
Total n-3 LC-PUFA in TOFX and FOPO fish was not different and was lower (pdiet= 0.000,
Fdiet= 37.751) than in FO fish. ALA was highest in TOFX fish and was not significantly
differ-ent between FO or FOPO fish (pdiet= 0.000, Fdiet= 90.088). Total n-3 PUFA in TOFX fish was
higher (pdiet= 0.000, Fdiet= 44.773) than in FOPO fish, but lower than in FO fish. Total n-6
PUFA in TOFX or FOPO fish was not different and lower (pdiet= 0.000, Fdiet= 408.187) than
in FO fish. The n-3:n-6 ratio differed significantly across treatments (pdiet= 0.000, Fdiet=
254.544), with TOFX fish being higher than FOPO fish but lower than FO fish. PUFA was the dominant fatty acid group in all dietary treatments with DHA as the dominant fatty acid.
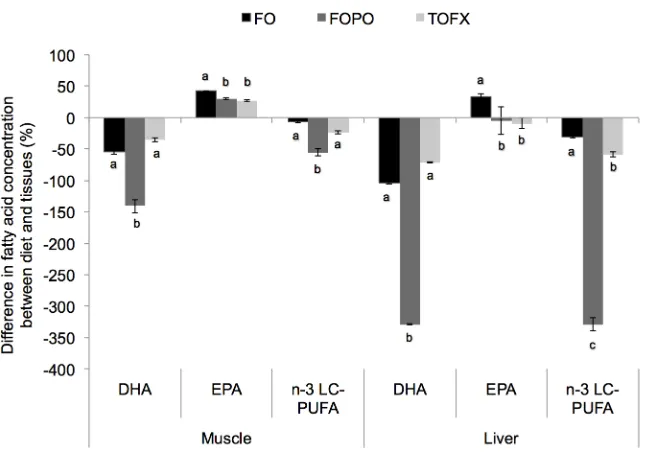
The difference between dietary and tissue concentrations of DHA, EPA, total n-3 LC-PUFA and ALA (in relation to dietary concentration) was significantly different among dietary treat-ments (Fig 2). The difference between diet and muscle DHA in the TOFX was not different from the FO treatment and was higher (pdiet= 0.020, Fdiet= 16.067) than in the FOPO
treat-ment. The difference between diet and muscle EPA in the TOFX treatment was not different from the FOPO treatment and was lower (pdiet= 0.005, Fdiet= 11.258) than in the FO
treat-ment. For both DHA and EPA, the same pattern of difference observed in muscle was found in liver, with the magnitude of difference being generally larger in liver than in muscle. The differ-ence between diet and muscle n-3 LC-PUFA in the TOFX treatment was higher (pdiet= 0.005,
Fdiet= 11.117) than in the FOPO treatment and, although not significant, was numerically
[image:12.612.199.550.74.317.2]lower than in the FO treatment. The difference between diet and liver n-3 LC-PUFA in the
Fig 1. Absolute content of total n-3 PUFA in white dorsal muscle of Atlantic salmon smolt fed FO, FOCF and TOFX feeds over a 89 day period.Data expressed as mg per 100g (dry weight) of tissue. Values are means±SEM (n = 4). Different letters denote significant differences (p<0.05) among treatment means.
Table 5. Total fatty acid content (mg g-1lipid) and fatty acid composition (% total fatty acid) of liver of Atlantic salmon smolt fed FO, FOCF and
TOFX feeds over a 89 day period.
Initial FO FOPO TOFX
Total fatty acid content 698.9±15.28 673.7±35.11 676.0±29.07 678.9±8.44 Fatty acid composition
14:0 1.0±0.12 1.9±0.07 b 1.0±0.04 c 0.9±0.07 a
16:0 18.1±0.30 15.9±0.22 14.7±0.21 14.8±0.85
17:0 0.3±0.00 0.4±0.02 b 0.2±0.01 b 0.7±0.07 a
18:0 5.8±0.06 6.8±0.06 6.5±0.18 7.3±0.43
Other SFA1 0.4±0.04 0.5±0.02 0.8±0.42 0.7±0.03
Total SFA 25.6±0.48 25.5±0.19 23.3±0.37 24.4±1.31
16:1n-7 3.8±0.07 2.9±0.07 a 2.6±0.05 a 1.7±0.16 a
18:1n-7 3.5±0.05 3.5±0.08 a 3.2±0.04 a 2.4±0.14 a
18:1n-9 (OA) 23.7±0.23 12.1±0.63 a 22.4±0.54 b 15.2±1.33 a
20:1n-9 0.7±0.03 1.4±0.10 2.2±0.18 1.3±0.37
22:1n-11 0.2±0.02 0.1±0.01 0.0±0.01 0.1±0.03
Other MUFA2 2.1±0.06 3.2±0.09 b 2.8±0.05 a 2.5±0.09 a
Total MUFA 33.9±0.20 23.2±0.79 b 33.1±0.60 a 23.3±1.79 b
18:2n-6 (LA) 6.5±0.03 1.4±0.03 b 4.2±0.16 a 3.9±0.31 a
18:3n-6 0.3±0.00 0.0±0.00 b 0.1±0.02 a 0.1±0.02 ab
20:3n-6 0.5±0.00 0.4±0.02 b 1.2±0.06 a 0.4±0.04 b
20:4n-6 (ARA) 2.1±0.03 3.4±0.09 ab 3.4±0.02 b 4.0±0.21 a
Other n-6 PUFA3 0.8±0.01 0.9±0.06 b 1.4±0.07 ab 2.0±0.22 a
Total n-6 PUFA 10.2±0.04 6.1±0.12 b 10.3±0.15 a 10.3±0.08 a
18:3n-3 (ALA) 0.9±0.07 0.3±0.02 b 0.4±0.03 b 6.0±0.56 a
18:4n-3 (SDA) 0.9±0.02 0.5±0.05 0.3±0.03 0.5±0.09
20:4n-3 (ETA) 0.4±0.00 0.6±0.05 a 0.3±0.02 b 0.7±0.05 a
20:5n-3 (EPA) 4.7±0.04 10.3±0.20 a 5.7±0.28 b 4.8±0.17 c
22:5n-3 (DPA) 1.6±0.02 3.2±0.10 a 1.5±0.10 b 1.4±0.09 b
22:6n-3 (DHA) 19.6±0.31 27.4±0.57 a 23.1±0.59 b 25.1±1.23 ab
Total n-3 LC PUFA4 26.2±0.35 41.5±0.68 a 30.7±0.85 b 32.0±1.22 b
Other n-3 PUFA5 0.3±0.04 0.4±0.02 a 0.3±0.02 b 0.3±0.02 b
Total n-3 PUFA 28.3±0.36 42.7±0.65 a 31.6±0.83 c 38.8±0.99 b
Total PUFA 38.5±0.32 48.9±0.68 a 41.9±0.84 b 49.1±0.97 a
n-3:n-66 2.8±0.05 7.0±0.16 a 3.1±0.09 c 3.7±0.11 b
DHA:EPA7 4.2±0.04 2.7±0.06 c 4.0±0.15 b 5.3±0.31 a
ALA:LA8 0.1±0.01 0.2±0.01 b 0.1±0.00 c 1.5±0.05 a
EPA:ARA9 2.2±0.04 3.0±0.03 a 1.7±0.08 b 1.2±0.08 c
FO, oil content of feed is 100%fish oil; FOPO, oil content of feed is 20%fish oil and 80% poultry oil; TOFX, oil content of feed is 60% tuna oil and 40%
flaxseed oil.
Data expressed as mean±SEM (n = 4). Different letters within a row denotes significant differences among diets as determined by Tukey-Kramer HSD (p<0.05).
1Includes 15:0, 20:0, 21:0, 22:0, 23:0 and 24:0.
2Includes 16:1n-5, 16:1n-9, 18:1n-5, 20:1n-7, 22:1n-9 and 24:1n-9. 3Includes 20:2n-6, 22:5n-6, and 22:4n-6.
4Includes 20:4n-3, 20:5n-3, 22:5n-3 and 22:6n-3. 5Includes 21:5n-3, 24:6n-3 and 24:5n3. 6n-3:n-6 ratio.
7DHA:EPA ratio. 8ALA:LA ratio. 9EPA:ARA ratio.
TOFX treatment was higher (pdiet= 0.000, Fdiet= 156.978) than in the FOPO treatment and
lower than in the FO treatment. The difference between diet and muscle ALA in the TOFX treatment was not different from the FOPO treatment and was higher (pdiet= 0.000, Fdiet=
26.726) than in the FO treatment, whereas the difference between diet and liver ALA did not differ across treatments.
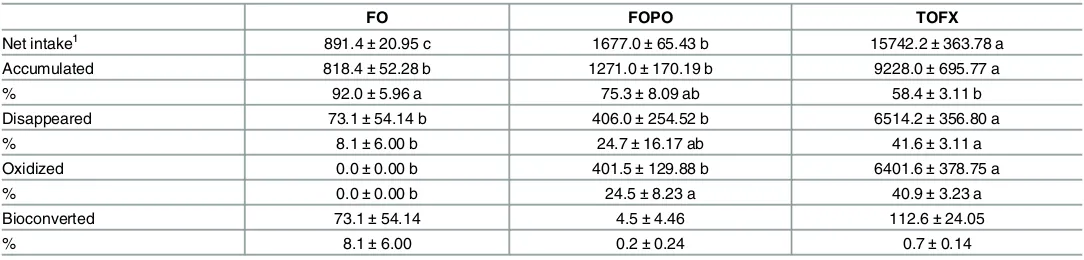
3.5. Fatty acid mass balance (FAMB)
FAMB suggested the metabolic fate of ALA was significantly affected by dietary oil source (Table 6). The net intake and absolute disappearance was highest (pdiet= 0.000, Fdiet= 337.219)
in TOFX fish. The retention efficiency in TOFX fish was not different from FOPO fish and was lower (pdiet= 0.015, Fdiet= 6.000) than in FO fish. ALA bioconversion was not different across
treatments.
3.6. Liver proteomics
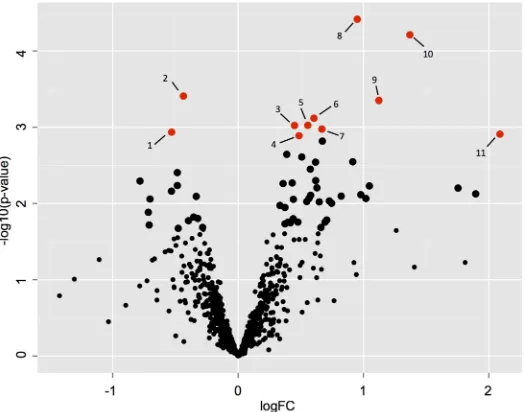
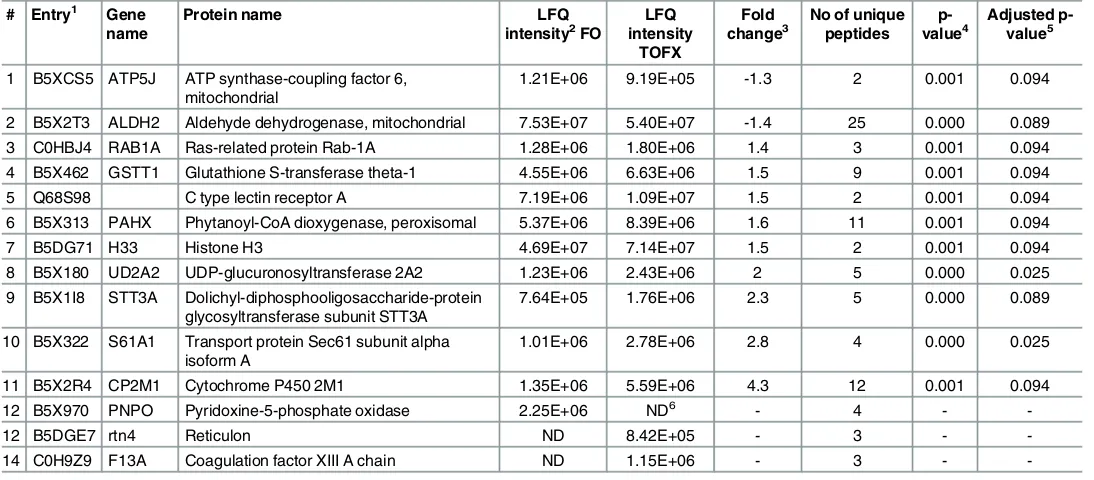
[image:14.612.201.529.73.299.2]A total of 752 proteins were identified on the basis of two or more unique matching peptide sequences (S2 File). Principal component analysis (PCA) showed maximum separation between TOFX and FO livers whereas FOPO livers showed considerable overlap with both FO and TOFX (S1 Fig). Statistical comparison of intensity values identified significant differences between TOFX and FO livers, the results of which are shown on the volcano plot inFig 3. On the basis of an adjusted p<0.1, 11 proteins were differentially abundant, nine of which were up-regulated in TOFX livers and two in FO livers (Table 7). In addition, two proteins were detected only in TOFX livers and one was detected only in FO livers. Fold changes in differen-tially abundant proteins between FO and TOFX livers ranged from 4.3 to 1.3. Interaction net-work analysis of differentially abundant proteins revealed a significant enrichment for interacting proteins (p = 0.027) with three interactions (ALDH2-GSTT1, RAB1A-S61A1, S61A1-STT3A).
Fig 2. Difference in dietary and tissue (white dorsal muscle and liver) concentrations of EPA, DHA, total n-3 LC-PUFA and ALA.Data expressed as % difference in relation to dietary concentration. Values are means±SEM (n = 4). Different letters denote significant differences (p<0.05) among treatment means.
4. Discussion
4.1. Fatty acid profiles and nutritional implications
Novel oils extracted from transgenic oilseeds with fish oil-like proportions of DHA may pro-vide the aquafeed industry with an option to enhance the nutritional quality of salmon flesh, as measured by the concentration of n-3 LC-PUFA, to the previous concentrations when marine oils were included in aquafeeds at higher amounts [2]. In the current study, a major compari-son was between feeds formulated with fish oil (FO), as a historical standard, a current com-mercial-like oil blend (FOPO), and a blended oil reflecting the fatty acid profile of DHA-containingCamelinaoil (TOFX) [18,19]. The concentration of n-3 LC PUFA in white muscle was used as the most direct indication of how differences in dietary oil composition translated to differences in the product. This reached absolute contents of 2160 mg per 100 g (dry weight) in TOFX fish, and despite not being as high as in FO fish (2760 mg per 100 g), provided an extra 450 mg per 100 g muscle relative to the current industry FOPO diet.
Although the importance of ALA from a health perspective has been generally less reported relative to n-3 LC-PUFA, ALA is receiving interest as a nutraceutical supplement, based on reports of beneficial effects similar to those of n-3 LC-PUFA [44]. ALA is a minor fatty acid in marine oils, however, it is highly and naturally present inCamelinaand other transgenic oil-seeds such as canola, reaching proportions of over 25% of the total fatty acids in oils extracted from transgenic seed [18]. Given the high relative level of ALA in the TOFX oil (22.8% total fatty acids), the muscle content of ALA was the highest in TOFX fish, with absolute levels of 1110 mg per 100 g of muscle in comparison with 86 and 123 mg per 100g of muscle in FO and FOPO fish, respectively. ALA is an essential fatty acid (EFA) for humans, and intake recom-mendations have been established at a minimum of 14 g weekly [45].
[image:15.612.35.577.96.226.2]Some evidence suggests that a balanced dietary n-3:n-6 ratio is positive in maintaining opti-mal human health [46,47]. A ratio of 1:1–2 has been proposed as a target for adult human nutrition in relation to ratios of 1:10–20 in current western diets [48]. Consumption of fatty fish, and salmon in particular, is advised in western societies for the health benefits associated with high n-3 LC-PUFA content [5,6]. The intake of these, and n-3 in general rather than n-6, largely control the human dietary n-3:n-6 ratio [49]. The n-3:n-6 ratio in TOFX fish (4.4),
Table 6. Net intake (μmol fish-1) and metabolic fate (
μmol fish-1and % total net intake) of ALA in whole carcasses of Atlantic salmon smolt fed FO,
FOPO and TOFX feeds over a 89 day period.
FO FOPO TOFX
Net intake1 891.4±20.95 c 1677.0±65.43 b 15742.2±363.78 a
Accumulated 818.4±52.28 b 1271.0±170.19 b 9228.0±695.77 a
% 92.0±5.96 a 75.3±8.09 ab 58.4±3.11 b
Disappeared 73.1±54.14 b 406.0±254.52 b 6514.2±356.80 a
% 8.1±6.00 b 24.7±16.17 ab 41.6±3.11 a
Oxidized 0.0±0.00 b 401.5±129.88 b 6401.6±378.75 a
% 0.0±0.00 b 24.5±8.23 a 40.9±3.23 a
Bioconverted 73.1±54.14 4.5±4.46 112.6±24.05
% 8.1±6.00 0.2±0.24 0.7±0.14
FO, oil content of feed is 100%fish oil; FOPO, oil content of feed is 20%fish oil and 80% poultry oil; TOFX, oil content of feed is 60% tuna oil and 40%
flaxseed oil.
Data expressed as mean±SEM (n = 4). Different letters within a row denotes significant differences among diets as determined by Tukey-Kramer HSD (p<0.05).
1Calculated as intake minus excretion.
albeit not being as high as in FO fish (7.6), was markedly higher than in FOPO fish (2.2). This was directly attributed to the greater accumulation of both n-3 LC-PUFA and ALA, and implies that aquafeeds with high DHA and ALA content would enhance the nutritional quality of farmed salmon, and consequently the potential health benefits to the consumer relative to commercial blends containing a high proportion of poultry oil.
[image:16.612.52.577.78.490.2]In aiming to enhance the current and future nutritional value of salmon, fish nutritionists should maximize deposition of n-3 LC-PUFA [15]. In the present study, the pattern of tissue deposition in relation to diet was explored by the difference in the relative composition between diet and tissue as previously reported by Codabaccus et al. [11]. In both muscle and liver, the difference in terms of DHA was similar between TOFX and FO treatments, whereas the difference in terms of EPA was lower in TOFX treatment than in FO treatment. This
Fig 3. Differences in protein abundance between FO and TOFX livers.Volcano plot displaying differences of the pairwise comparison. Proteins found to be significantly (adjusted p<0.1; p<0.05) different between treatments are plotted in red and described inTable 7. Larger black circles represent those proteins significantly different at a lower stringent threshold (adjusted p<0.3; p<0.05).
comparison indicates enhanced overall efficiency of tissue deposition of n-3 LC-PUFA in the TOFX treatment, as shown by the lower difference between dietary and tissue n-3 LC-PUFA in relation to FO; though the dissimilarity in this difference was only numerical in muscle, it was significant in liver. These results were consistent with our hypothesis and with Codabaccus et al. [11], with the two studies collectively demonstrating that increasing the DHA:EPA ratio in relation to a fish-oil based diet promotes a tissue deposition“sparing effect”of n-3 LC-PUFA. This“sparing effect”is based on the mechanism of selective conservation of DHA; whereas n-3 LC-PUFA are normally oxidized for energy production if supplied in surplus, DHA is prefer-entially deposited as EPA is more extensively oxidized [11,50,51]. Accordingly, the DHA:EPA ratio of tissues increased in relation to diet, with this increase being less pronounced in TOFX fish than in FO fish due to the lower amount of EPA available for oxidation. Equally important, but unrelated to the DHA:EPA ratio, the sparing effect on n-3 LC-PUFA is also determined by absolute dietary concentration values as well as by the abundance of other SFA and MUFA that are more readily catabolized [11,14,50]. This was clearly observed in FOPO treatment, which, despite a dietary DHA:EPA ratio similar to that of FO diet (~ 1), showed the lowest difference between dietary and tissue n-3 LC-PUFA concentration and consequently the highest effi-ciency in tissue deposition. Low n-3 LC-PUFA in FOPO diet promoted minimum EPA oxida-tion and maximum DHA deposioxida-tion, with the more abundant oleic acid (18:1n-9, OA) and linoleic acid (18:2n-6, LA) in FOPO being used for energy production and thereby likely con-tributing to enhanced sparing and resultant tissue deposition of n-3 LC-PUFA.
Table 7. Proteins significantly and differentially abundant in liver of Atlantic salmon smolt fed FO and TOFX feeds.
# Entry1 Gene name
Protein name LFQ
intensity2FO
LFQ intensity
TOFX
Fold change3
No of unique peptides
p-value4
Adjusted p-value5
1 B5XCS5 ATP5J ATP synthase-coupling factor 6, mitochondrial
1.21E+06 9.19E+05 -1.3 2 0.001 0.094
2 B5X2T3 ALDH2 Aldehyde dehydrogenase, mitochondrial 7.53E+07 5.40E+07 -1.4 25 0.000 0.089
3 C0HBJ4 RAB1A Ras-related protein Rab-1A 1.28E+06 1.80E+06 1.4 3 0.001 0.094
4 B5X462 GSTT1 Glutathione S-transferase theta-1 4.55E+06 6.63E+06 1.5 9 0.001 0.094
5 Q68S98 C type lectin receptor A 7.19E+06 1.09E+07 1.5 2 0.001 0.094
6 B5X313 PAHX Phytanoyl-CoA dioxygenase, peroxisomal 5.37E+06 8.39E+06 1.6 11 0.001 0.094
7 B5DG71 H33 Histone H3 4.69E+07 7.14E+07 1.5 2 0.001 0.094
8 B5X180 UD2A2 UDP-glucuronosyltransferase 2A2 1.23E+06 2.43E+06 2 5 0.000 0.025
9 B5X1I8 STT3A Dolichyl-diphosphooligosaccharide-protein glycosyltransferase subunit STT3A
7.64E+05 1.76E+06 2.3 5 0.000 0.089
10 B5X322 S61A1 Transport protein Sec61 subunit alpha isoform A
1.01E+06 2.78E+06 2.8 4 0.000 0.025
11 B5X2R4 CP2M1 Cytochrome P450 2M1 1.35E+06 5.59E+06 4.3 12 0.001 0.094
12 B5X970 PNPO Pyridoxine-5-phosphate oxidase 2.25E+06 ND6 - 4 -
-12 B5DGE7 rtn4 Reticulon ND 8.42E+05 - 3 -
-14 C0H9Z9 F13A Coagulation factor XIII A chain ND 1.15E+06 - 3 -
-1UniProtKB from UniProt imported Salmo salar database. 2Average LFQ intensity of non-normalised values (n = 4). 3Fold changes (TOFX vs. FO) in non-normalised LFQ intensities. 4p value after pair-wise comparison.
5False discovery rate adjustment using Benjamini Hochberg correction. Reported proteins with values less than 0.1. 6Not detected.
Atlantic salmon hepatocytes possess the ability to desaturate and elongate C18fatty acids
such as ALA to the long-chain and more unsaturated fatty acids [52–55]. Hence, we evaluated whether a high ALA concentration, as that occurring in the TOFX diet, might contribute to enhancing tissue deposition of n-3 LC-PUFA in relation to the FO diet by promoting desatura-tion and elongadesatura-tion. ALA in TOFX fish was largely accumulated and/or oxidized, and only minimally (<1%) bioconverted, and thus no further ALA bioconversion was observed in rela-tion to FO or FOPO fish. Limited or negligible bioconversion of ALA to n-3 LC-PUFA has been attributed to high availability of either substrate (ALA) or end-product (DHA). Whereas excessive C18fatty acids can affect elongation activities by limiting the ability of
delta-6-desatur-ase to act on C24and consequently restraining DHA production [56,57], the high abundance of
n-3 LC-PUFA, particularly DHA rather than EPA, can limit their possible biosynthesis due to an inhibitory effect on delta-6-desaturase and Elovl-2-like elongase enzymes [58–60]. ALA bio-conversion has been reported to reach 25% of total net intake in Atlantic salmon fed a diet with full replacement of fish oil withCamelinaoil [13,55]; although ALA concentration was similar to that of TOFX diet (~ 20% total fatty acid), DHA was approximately 10-fold lower than in TOFX diet. Taken together, these findings suggest that DHA is likely more limiting than ALA itself in promoting ALA bioconversion in Atlantic salmon fed high DHA and ALA diets. The fairly high concentration of LA in the TOFX diet (7.5% total fatty acids) could also evoke com-petition between LA and ALA as substrates for the delta-6-desaturase enzyme, as proposed by composition-based studies in teleost [61]. However, this possibility is unlikely for salmonids, where more specific FAMB studies have shown that bioconversion of ALA is favored over LA due to the greater affinity of delta-6-desaturase for the n-3 pathway [12,62]. In addition to bio-conversion, an alternative pathway for ALA to improve tissue deposition of n-3 LC PUFA is through beta-oxidation. ALA has a high rate of oxidation and, if present in large proportions, it is more readily utilized for energy production than other fatty acids [14,50,63]. For this hypothesis to be tested, a different approach using graded levels of ALA and constant levels of n-3 LC-PUFA and DHA:EPA ratio would be more suitable.
4.2. Growth and performance
4.3. Liver proteomics
—
potential oxidative stress responses
The liver proteome provides an informative biological matrix to study diet-induced changes and better understand the physiological basis of different phenotypic traits [23,24]. Overall, our quantitative comparison among the liver proteomes found the most significantly different proteins between TOFX and FO diets, whereas comparisons between FOPO and FO, and between FOPO and TOFX, revealed no significant differences. This is consistent with the fact that TOFX and FO livers showed maximum separation by PCA analysis, whereas FOPO livers showed considerable overlap with both FO and TOFX.
Several proteins related to protein biogenesis in the ER and secretory protein trafficking were among the more highly up-regulated proteins in the TOFX livers, such as the alpha sub-unit of Sec6 (S61A1) and the glycosyltransferase subsub-unit STT3A (STT3A). These two proteins were also increased in TOFX livers relative to FOPO livers, albeit at a less stringent cut-off (adjusted p<0.3). However, the majority of protein alterations in the liver of TOFX fish were related to oxidative stress and detoxification pathways, such as changes in glutathione S-trans-ferase theta-1 (GSTT1), cytochrome P450 2M1 (CP2M1) and mitochondrial aldehyde dehy-drogenase (ALDH2). GSTT1 catalyzes the conjugation of the reduced form of glutathione to xenobiotic substrates and up-regulation has been associated to detoxification and increased protection against reactive molecules causing oxidative stress, such as hydrogen peroxides or aldehydes generated from lipid peroxidation [73,74]. Glutathione transferases operate in par-allel with aldehyde dehydrogenases and cytochrome P450 as hepato-protective mechanism against oxidative stress [75], and thus alterations of these proteins have been observed in fish in response to temperature-induced [76] and xenobiotic-induced [77,78] oxidative stress. ALDH2 was down-regulated in TOFX livers, following the trend previously reported in response to lipid peroxidation [79,80] and/or to the presence of hydrogen peroxide [81,82]. In turn, expression of CP2M1 was increased, corroborating the role of cytochrome P450 as com-pensatory mechanism when the aldehyde dehydrogenase pathway is compromised [75].
Lipid peroxidation-induced oxidative stress was also supported by changes in UD2A2 and pyridoxine-5-phosphate oxidase (PNPO). UD2A2 is the precursor of UDP-glucuronosyl ferase and up-regulation in TOFX fish may be related to the role of UDP-glucuronosyl trans-ferase and glutathione transtrans-ferases in preventing the propagation of lipid peroxidation [83]. PNPO catalyzes several reactions in the metabolism of vitamin B6, which has an antioxidant role by inhibiting lipid peroxidation or by serving as a coenzyme in the glutathione antioxidant defense system [84]. Increased oxidative stress has been reported in vitamin B6 deficient ani-mals [85], suggesting that down-regulation (to below detection limits) of PNPO in TOFX livers may have contributed to this response. Lipid peroxidation in TOFX livers was also evident from changes in the abundance of several additional proteins (indicated by the data points labeled onFig 3), albeit at a less stringent threshold for statistical significance (adjusted p<0.3). Proteins that participate in the process of fatty acid oxidation (ECHA, NCPR, ECPH and PAHX) and in the subsequent antioxidant response (PRDX5, CATA and HBA), as well as oxidoreductases (CRYL1, AL3A2, G6PD) that catalyze these oxidative reactions, were mostly detected at elevated levels in the TOFX diet. Also related to fatty acid oxidation was the up-reg-ulation of PAYH. This protein, along with AL3A2, catalyze the alpha-oxidation of phytanic acid, which is commonly found in high concentrations in tuna oil [86,87], thus reflecting the specific use of tuna oil in TOFX diet.
relation to the other two diets, and from the lower tissue concentration in relation to feed. Increased susceptibility of fish to oxidative damage has been associated with excessive dietary PUFA; this relation is dependent on the efficacy of the antioxidant system [88–90], and on the proportion that PUFA represents in the total dietary lipid [91,92]. In the present experiment, all feeds were considered on the safe side in terms of protection from peroxidation; feeds were evenly supplemented with antioxidant (vitamin C supplied by Stay-C, and vitamin E contained in the vitamin premix) in comparable amounts to those used in previous studies testing feeds with similar n-3 LC-PUFA content [22,88], and stored at -20°C. The PUFA concentration in TOFX diet were the highest across treatment and of 42% of the total lipid, lying within the range (~ 37%–50% total lipid) of previous data in salmonids that showed increased susceptibil-ity to peroxidation through to growth reduction [91,93,94]. In a more recent study with Atlan-tic salmon fed EPA-containing oil (ECO) extracted from transgenicCamelina, higher PUFA concentration (~55% of total lipid) did not affect growth [22], suggesting that fish vulnerability to oxidative damage is dependent on both the quality of the input oil(s), total PUFA and the balance among specific PUFA. While the formulation of TOFX and ECO diets were similar in terms of oil inclusion and nutrient composition, the most noticeable difference between the two were the high content of DHA and ALA (TOFX diet) versus a high content of EPA and LA (ECO diet). High dietary DHA amounts may induce oxidative stress and cause adverse effects on fish growth [90]. The threshold from which such responses can be triggered in fish is broad (~ 10%–36% total lipid) and correlated to the respective balance with the antioxidant supply [88–90,95]. DHA concentration in TOFX diet was high (12.7% total lipid), but close to those of the FO diet (11.5% total lipid), thus high DHA as unique cause of oxidative stress in TOFX fish was rather unlikely. In contrast, ALA concentration in TOFX diet was considerably high (~ 16% of total lipid) in relation to the other diets and not far from dietary concentrations (~ 19%–25% total lipid) that have previously resulted in growth detriment in Atlantic salmon [55,96]. The negative effects of high dietary ALA have been associated with an increased sus-ceptibility to lipid peroxidation and immunosuppression by a reduction in the antioxidant capacity provided by alpha-tocopherol [97–99]. We therefore speculate that the antioxidant defense in TOFX fish could have been overwhelmed by the high dietary PUFA concentration, and in particular by the combination of high DHA and ALA. Despite the dietary inclusion of antioxidants, it is possible that the high susceptibility of DHA to oxidative damage was enhanced in our study by ALA-induced depression of the antioxidant system. The increased liver detoxification activities and small reduction in performance probably relates to these mechanisms. In this line, DHA is also more susceptible than EPA to oxidative breakdown [100]. The observed impaired performance in fish fed the TOFX diet in relation to those fed the EPA-containing oil diet, as in Betancor et al. [22], could be explained by the higher suscep-tibility of fish on the TOFX diet to oxidative damage and the need of extra antioxidant supple-mentation when fed oils rich in DHA and ALA. Future feeding trials should therefore consider the use of higher inclusion of antioxidants in feeds using such an oil blend, although consider-ably higher levels of antioxidants are present inCamelinaand canola oils.
4.4. Conclusion
consumer perspective, DHA-containing oils extracted from transgenic terrestrial oil seeds are therefore potentially suitable as a means to improve the nutritional quality for consumers of salmon fillet. The particular fatty acid profile of the TOFX oil also promoted a more efficient deposition of n-3 LC-PUFA in muscle and liver in relation to a fish oil-based diet; this was attributed to less inefficient utilization, in particular as occurs via beta-oxidation, of n-3 LC-PUFA due to the higher DHA:EPA ratio, rather than to bioconversion from the higher
content of the ALA precursor. The TOFX oil triggered an oxidative stress response that was likely associated to impaired growth. This draws attention to the necessity of considering the balance between total and specific PUFA and antioxidant levels present in the diet and the pos-sible need for supplementation in order to protect PUFA from oxidative damage in both the feed and in the fish. Notwithstanding, we also note that unlike the oil blend used in this study, the pending transgenic terrestrial oils do contain elevated levels of naturally occurring antioxi-dants including carotenes and tocopherols (CSIRO, unpublished data). This aspect will need further consideration for the future inclusion of DHA-containing oils extracted from trans-genicCamelinaor canola in salmon aquafeeds.
The mass spectrometry proteomics data have been deposited to the ProteomeXchange Con-sortium via the PRIDE partner repository with the dataset identifier PXD004114
Supporting Information
S1 Fig. Principal component analysis (PCA) of the liver proteome profiles.Data points are marked with sample identifiers and replicate number.
(TIF)
S1 File. MaxQuant output files of the complete peptide and protein-level mass spectrome-try.
(XLSX)
S2 File. List of proteins identified and proteins showing significant (adjusted p-value 0.1– 0.3) fold changes.
(XLSX)
S1 Table. Apparent digestibility (AD; %) of fatty acids in Atlantic salmon smolt fed FO, FOPO and TOFX diets over a 89 day period.
(DOCX)
Acknowledgments
The authors acknowledge Matthew Bransden (Skretting, Tasmania) for supplying the majority of feed ingredients; Daniel Poutney for technical assistance during diet preparation; Carla dos Anjos, Daniela Farias, Tania Mendo, Felipe Briceño, Lara Marcus and Ivan Hinojosa for assis-tance during fish sampling; and Peter Mansour and Basseer Codabaccus for assisassis-tance during chemical analysis. We thank two anonymous journal reviewers for their comments that improved the manuscript.
Author Contributions
Conceptualization:WGN CGC PDN.
Formal analysis:WGN.
Methodology:WGN CGC PDN RW IC.
Writing–original draft:WGN.
Writing–review & editing:CGC PDN RW IC.
References
1. Watson RA, Nowara GB, Hartmann K, Green BS, Tracey SR, Carter CG. Marine foods sourced from farther as their use of global ocean primary production increases. Nat Commun. 2015; 6. doi:10. 1038/ncomms8365
2. Nichols P, Glencross B, Petrie J, Singh S. Readily available sources of long-chain omega-3 oils: Is farmed Australian seafood a better source of the good oil than wild-caught seafood? Nutrients. 2014; 6(3):1063–79. doi:10.3390/nu6031063PMID:24618601
3. Delgado-Lista J, Perez-Martinez P, Lopez-Miranda J, Perez-Jimenez F. Long chain omega-3 fatty acids and cardiovascular disease: a systematic review. Br J Nutr. 2012; 107(SupplementS2):S201– S13. doi:10.1017/S0007114512001596
4. Bell GA, Kantor ED, Lampe JW, Kristal AR, Heckbert SR, White E. Intake of long-chain omega-3 fatty acids from diet and supplements in relation to mortality. Am J Epidemiol. 2014; 179(6):710–20. Epub 2014/02/06. doi:10.1093/aje/kwt326PMID:24496442; PubMed Central PMCID: PMCPMC3939849. 5. EFSA. Scientific Opinion on Dietary Reference Values for fats, including saturated fatty acids, polyun-saturated fatty acids, monounpolyun-saturated fatty acids, trans fatty acids, and cholesterol. EFSA Journal. 2010; 8:1461.
6. NHMRC. Nutrient Reference Values for Australia and New Zealand. Canberra, Australia: NHMRC, 2006.
7. Fry JP, Love DC, MacDonald GK, West PC, Engstrom PM, Nachman KE, et al. Environmental health impacts of feeding crops to farmed fish. Environ Int. 2016; 91:201–14.http://dx.doi.org/10.1016/j. envint.2016.02.022. doi:10.1016/j.envint.2016.02.022PMID:26970884
8. Henriques J, Dick JR, Tocher DR, Bell JG. Nutritional quality of salmon products available from major retailers in the UK: content and composition of n-3 long-chain PUFA. Br J Nutr. 2014; 112(6):964–75. Epub 2014/07/16. doi:10.1017/s0007114514001603PMID:25017007.
9. Emery JA, Smullen RP, Turchini GM. Tallow in Atlantic salmon feed. Aquaculture. 2014; 422–423 (0):98–108.http://dx.doi.org/10.1016/j.aquaculture.2013.12.004.
10. Turchini GM, Francis DS. Fatty acid metabolism (desaturation, elongation and beta-oxidation) in rain-bow trout fed fish oil- or linseed oil-based diets. Br J Nutr. 2009; 102(1):69–81. Epub 2009/01/07. doi:
10.1017/s0007114508137874PMID:19123959.
11. Codabaccus BM, Carter CG, Bridle AR, Nichols PD. The“n−3 LC-PUFA sparing effect”of modified dietary n−3 LC-PUFA content and DHA to EPA ratio in Atlantic salmon smolt. Aquaculture. 2012; 356–357(0):135–40.http://dx.doi.org/10.1016/j.aquaculture.2012.05.024.
12. Emery JA, Hermon K, Hamid NKA, Donald JA, Turchini GM.Δ-6 Desaturase substrate competition: Dietary linoleic acid (18:2n-6) has only trivial effects onα-linolenic acid (18:3n-3) bioconversion in the teleost rainbow trout. PLoS One. 2013; 8(2). PMID:23460861.
13. Hixson SM, Parrish CC, Anderson DM. Use of camelina oil to replace fish oil in diets for farmed salmonids and Atlantic cod. Aquaculture. 2014; 431(43–52).http://dx.doi.org/10.1016/j.aquaculture.2014.04.042. 14. Budge SM, Penney SN, Lall SP. Response of tissue lipids to diet variation in Atlantic salmon (Salmo
salar): Implications for estimating diets with fatty acid analysis. J Exp Mar Biol Ecol. 2011; 409(1– 2):267–74.http://dx.doi.org/10.1016/j.jembe.2011.09.002.
15. Sanden M, Stubhaug I, Berntssen MH, Lie O, Torstensen BE. Atlantic salmon (Salmo salar L.) as a net producer of long-chain marine omega-3 fatty acids. J Agric Food Chem. 2011; 59(23):12697–706. Epub 2011/10/25. doi:10.1021/jf203289sPMID:22017199.
16. Ruiz-Lopez N, Usher S, Sayanova OV, Napier JA, Haslam RP. Modifying the lipid content and compo-sition of plant seeds: engineering the production of LC-PUFA. Appl Microbiol Biotechnol. 2015; 99 (1):143–54. Epub 2014/11/25. doi:10.1007/s00253-014-6217-2PMID:25417743; PubMed Central PMCID: PMCPMC4286622.
17. Petrie JR, Singh SP. Expanding the docosahexaenoic acid food web for sustainable production: engi-neering lower plant pathways into higher plants. AoB Plants. 2011; 2011:plr011. Epub 2011/01/01. doi:10.1093/aobpla/plr011PMID:22476481; PubMed Central PMCID: PMCPMC3114564. 18. Petrie JR, Shrestha P, Belide S, Kennedy Y, Lester G, Liu Q, et al. Metabolic EngineeringCamelina